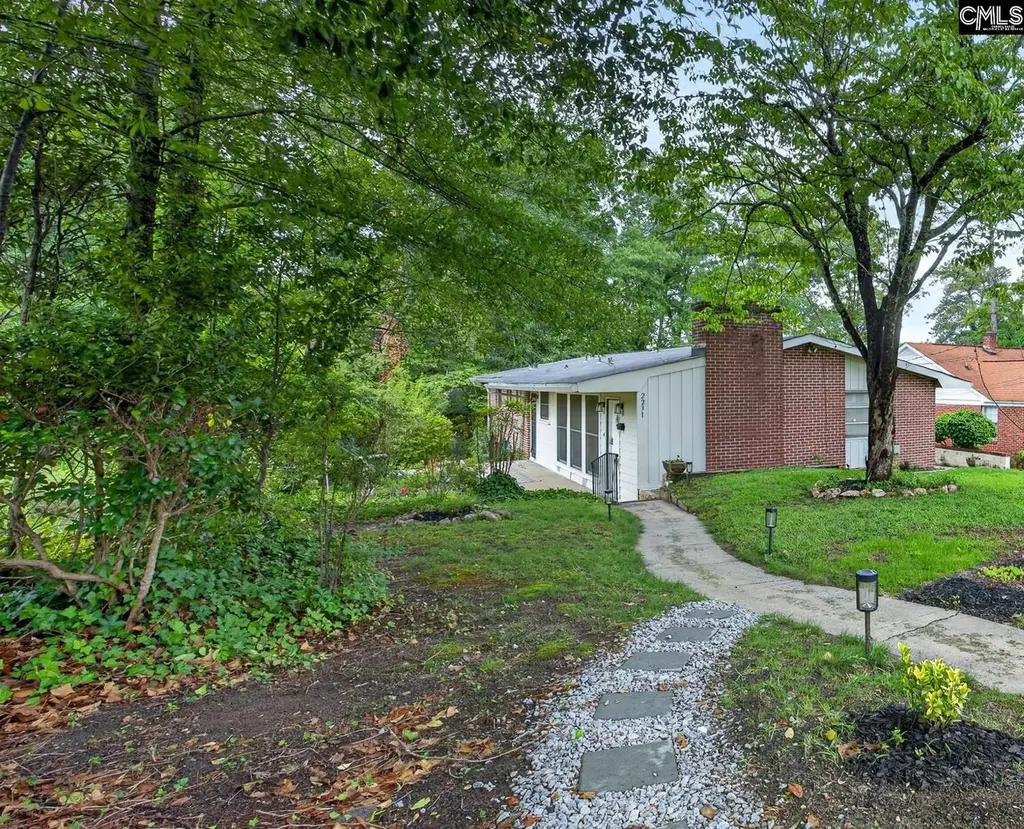
2231 Margurette St · Columbia, SC
Flood risk 1/10 · Minimal
- FEMA flood zone
- X (unshaded)
- Chance of flooding over 30 yrs
- 0.0%
- Est. flood insurance / yr
- $507 – $1,088
Fire risk 1/10 · Minimal
- Est. fire insurance / yr
- $783 – $1,453
Heat risk 6/10 · Moderate
- Hot days now (above 109°F)
- 7 days/yr
- Hot days in 30 yrs
- 16 days/yr
Wind risk 6/10 · Moderate
- Chance of severe wind over 30 yrs
- 68.0%
Air-quality risk 3/10 · Minor
- Unhealthy air days now
- 2 days/yr
- Unhealthy air days in 30 yrs
- 2 days/yr
Risk factors via First Street. Map © Google.
Why this score? — see what drove the C grade
The composite is a weighted blend of 9 inputs, each scored 0–100. Each bar is that input's sub-score; the figure is the points it added to the 100-point composite (weight × sub-score).
- Cash flow +19.5/30.0
- ARV discount +13.4/15.0
- DSCR +6.1/10.0
- 1% rule +4.3/10.0
- Livability +3.9/5.0
- Rent growth +3.7/5.0
- Schools +2.6/10.0
- Condition / age +2.5/5.0
- Appreciation +0.0/10.0
$240,000
🖨 Deal sheet (PDF) 📄 Offer letter ✓ Due diligence
Listing remarks
Welcome to 2231 Margurette, a move-in ready home that is full of charm! This 4-bedroom, 2-bath home features hardwood floors, flexible living spaces, and a warm, inviting feel throughout. Step inside to a cozy living room highlighted by a beautiful brick fireplace wall as well as floor to ceiling windows. The open dining area flows seamlessly into the spacious kitchen, creating an ideal layout for everyday living. Just off the kitchen, the versatile bonus room offers endless possibilities, perfect for a home office, den, playroom, or a flex space. Conveniently located just minutes from Downtown Columbia, Forest Acres, and Fort Jackson, this home is a fantastic opportunity for first-time buy
Key facts
- Open dining area
- Spacious kitchen
- Versatile bonus room
Tags
Property features AI
Exterior
- Utilities: Public water; Public sewer
- Home design: Single-story home
- Construction: Crawlspace foundation
- Exterior features: Patio; Full gutters; Covered front porch; Brick siding on all sides above foundation; Paved road access
Interior
- Kitchen: Granite countertops; Tiled backsplash; Painted cabinets; Luxury vinyl plank flooring; Smooth-surface range; Dishwasher; Refrigerator; Stove (vented externally)
- Bedrooms: Main-level primary bedroom with private bath, separate shower, spa/multiple-head shower, ceiling fan, private closet, hardwood floors; Additional bedrooms with private closets, hardwood floors; two have ceiling fans; shared baths
- Flooring: Hardwood floors in main living areas and bedrooms; Luxury vinyl plank flooring in kitchen
- Bathrooms: Two full bathrooms
- Heating & cooling: Central heating; Central cooling
- Interior features: Attic access; Wood-burning fireplace (1)
- Laundry & utility: Heated utility/laundry room; Washer; Dryer; Gas water heater
Neighborhood map
What this means for you Summary
Snapshot
- This is a 4-bed/2.0-bath single-family listed at $240k.
Deal economics
- At list price, monthly cash flow is $270 ($3k/yr) — positive.
- The deal already cash-flows at list — no discount required.
- To meet the 1% rule (rent ≥ 1% of price), the offer needs to be $223k (7.3% below list).
- Recommended offer: $223k (7.3% below list) — sets the bar for 1% rule.
- Cap rate 7.6% vs local median 5.1% in Columbia — top-decile yield for the area; either an underpriced asset or a hidden risk that comps aren't pricing in. Stress-test before assuming the spread holds.
Location & tenants
- Location reads 78/100 on livability (#18 in SC, #2,436 nationally) — a middle-class / working-renter tenant base. Strengths: amenities A+, commute A+, cost of living A+; Watch: employment D, crime F.
- Richland 01 (urban): math 26% / reading 36% proficiency, ranked #54 of 80 in SC (top 68%) — families likely to look elsewhere, expect single-tenant / working-renter base with shorter leases; 64% free/reduced lunch — lower-income household profile, screen leases tightly.
- Zoned schools: Bradley Elementary (math 22% / reading 32%, grade F, #421 of 597 statewide, top 73%, 437 students, 100% FRL); Crayton Middle (math 48% / reading 64%, grade B-, #23 of 229 statewide, top 10%, 905 students, 100% FRL); A. C. Flora High (math 42% / reading 92%, grade B, #73 of 196 statewide, top 41%, 1,352 students, 100% FRL) — zoned schools average 100% FRL vs 64% district-wide (36 pts higher); higher-poverty schools than district average — tighter screening recommended.
- Zoned-school proficiency averages 50% at this address vs 31% district-wide (+19 pts) — the actual schools serving this property are materially stronger than the Richland 01 average implies; a family-tenant draw the district grade alone would hide.
- Market conditions: Rents rising fast (+4.7%/yr); 115 active listings in the ZIP; 13 comparable units currently listed for rent nearby; rentals at typical pace (median 26d on market — plan ~3-4 weeks tenant-placement turnaround); 3,472 units permitted in Richland County in 2024 (1,096 in 5+ unit buildings).
- At $2,225/mo this rent would consume 53% of the median local household income ($50k/yr) (locally 1045% of renters already pay >50% of income on rent) — very limited rent-growth headroom before tenants either downsize or default.
Forward outlook
- Local home prices are declining (-3.0%/yr); year-one equity from $2k of loan paydown is wiped out by about $7k of value loss. Plan a longer hold.
- Richland County population projected at +30% by 2050 — long-run rental-demand tailwind backs the buy-and-hold thesis.
Negotiation context
- Only 5 days on market — expect competitive offers; lowballing is unlikely to land.
- 6 sale attempts since 7y ago with the ask held roughly flat each time — persistent listings suggest the price (not the market) is what's stuck; bring a comps-based counter.
Risks & watch-outs
- Watch-outs: built in 1955 — expect roof / HVAC / electrical / plumbing capex.
- Climate carrying-cost: major wind risk, 68% chance of damaging wind over 30y; extreme-heat days projected 7→16/yr by 2055 (HVAC capex compounding) — expect insurance premiums to compound above CPI over the hold.
Questions for the listing agent
- Built in 1955 — when were the roof, HVAC, electrical panel, plumbing, and water heater last replaced?
- Is there a deadline driving the sale (1031 exchange, divorce, estate, relocation)? That informs how much negotiation room exists.
- Schools are D-rated, which usually means shorter tenancies and higher turnover. Who's the typical renter profile here, and what's been the actual vacancy rate?
- Crime grade is F in this area — have there been break-ins, vandalism, or insurance claims at this property in the last 3 years? What carrier currently insures it and at what premium?
- What's the average days-on-market for RENTAL listings here right now (not sales)? A rising rental-DOM trend means longer vacancies and softer asking-rent achievability than the comps imply.
- What's the recent tenant-quality profile in this submarket — average credit score on applications, eviction rate, late-payment / NSF rate, and stable-employment percentage? A property-management company in the area should have these aggregated.
- How much new for-sale + rental construction is in the pipeline within 1–3 miles? Heavy new supply typically softens prices + rents 12–24 months out; constrained supply supports both.
Investment metrics
- 1% rule
- 0.93% ✗
- Cap rate
- 7.64%
- Cash-on-cash
- 4.83%
- DSCR
- 1.21
- GRM
- 9.0
CMA / ARV
- ARV (on-the-fly)
- $275,892
- Comps found
- 1
Show comp detail 1 sale within ~0.75 mi
| Address | Dist | Beds/Ba | Sqft | Sold | Price | $/sf | Match |
|---|---|---|---|---|---|---|---|
| 1908 Bristol Dr | 0.41mi | 3/2.0 (-1) | 1,689 (+2%) | 21mo | $280,000 | $166 | 56 |
Match score weights: distance 35% · size 25% · config 20% · recency 20%. Top-matched comps best support the ARV.
Projected returns pro-forma
-3.0% appreciation · 4.73% rent growth · sell at horizon
- IRR
- -7.1%
- Equity multiple
- 0.74×
- Total profit
- $-17,808
- Equity at exit
- $35,785
- IRR
- 4.4%
- Equity multiple
- 1.34×
- Total profit
- $23,118
- Equity at exit
- $20,751
Cash invested: $67,200 (down + closing). Projections, not guarantees.
Landlord ↔ Tenant lean methodology
- Overall (STATE)
- 90 Strongly Landlord-Friendly
- State South Carolina
- 90 Strongly Landlord-Friendly · R+6
- County
- — inherits STATE
- City
- — inherits STATE
ZIP-level market 29204
- Home prices YoY
- -34.9%
- Rents YoY
- 4.7%
- Active inventory
- 115
- Price-to-rent
- 9.0×
Monthly cashflow live
- Estimated rent
- $2,225 high interval (Pro) →
- Mortgage (P&I)
- −$1,259
- Tax from tax record
- −$129 /mo · $1,548/yr
- Insurance
- −$100
- HOA
- −$0
- Vacancy / Maint / Mgmt
- −$467
- Net cashflow
- $270
Break-even live
Sensitivity live
| Price | -10% $406 | -5% $338 | +0% $270 | +5% $202 | +10% $134 |
|---|---|---|---|---|---|
| Rent | -10% $94 | -5% $182 | +0% $270 | +5% $358 | +10% $446 |
| Rate | -1.0pp $391 | -0.5pp $331 | base $270 | +0.5pp $208 | +1.0pp $145 |
UW: 25.0% down · 7.5% · 30yr · 1.5% tax · 5.0% vac · 8.0% maint · 8.0% mgmt
Financing live
Cash to close
- Down payment
- $60,000
- Closing costs
- $7,200
- Reserves months
- —
- Total cash needed
- —
Loan-product check · same deal, 3 products live
Conventional
25% down · 7.5% · 30yr
- Down + closing
- —
- Monthly P&I
- —
- Monthly cashflow
- —
- DSCR
- —
- Eligible?
- —
Personal DTI + credit; lowest rate.
DSCR
20% down · 8.5% · 30yr
- Down + closing
- —
- Monthly P&I
- —
- Monthly cashflow
- —
- DSCR
- —
- Eligible?
- —
No personal income docs; deal must DSCR.
Hard money
10% down · 12.0% · 12mo
- Down + closing
- —
- Monthly P&I
- —
- Monthly cashflow
- —
- DSCR
- —
- Eligible?
- —
Short-term bridge; refi at stabilization.
Rent comps 13 comps
| Address | Beds | Baths | Sqft | Rent | $/sqft | DOM | Units | Dist |
|---|---|---|---|---|---|---|---|---|
| 3040 Girardeau Ave Columbia, SC | 3.0 | 1.5 | 1400 | $2,150 | $1.54 | 16d | 1 | 0.68mi |
| 3040 Girardeau Ave Columbia, SC | 3.0 | 1.5 | 1400 | $2,150 | $1.54 | 25d | 1 | 0.68mi |
| 1318 House St Columbia, SC | 4.0 | 4.0 | 1500 | $2,900 | $1.93 | 25d | 2 | 0.68mi |
| 1121 Zeigler St Unit B Columbia, SC | 3.0 | 2.5 | 1550 | $3,300 | $2.13 | 23d | 1 | 0.76mi |
| 3419 Piedmont Ave Columbia, SC | 3.0 | 1.0 | 1100 | $1,195 | $1.09 | 25d | 1 | 1.14mi |
| 3117 Quitman St Columbia, SC | 3.0 | 2.0 | 1500 | $1,750 | $1.17 | 25d | 1 | 1.19mi |
| 2928 English Ave Unit NA Columbia, SC | 3.0 | 1.0 | 1320 | $1,590 | $1.20 | 13d | 1 | 1.22mi |
| 2229 Greene St Columbia, SC | 3.0 | 2.0 | 1050 | $1,695 | $1.61 | 21d | 1 | 1.30mi |
| 1840 Hampton St Unit 3 Columbia, SC | 4.0 | 2.0 | 1514 | $1,895 | $1.25 | 25d | 1 | 1.32mi |
| 1840 Hampton St Unit 1 Columbia, SC | 4.0 | 2.0 | 1056 | $1,795 | $1.70 | 25d | 1 | 1.32mi |
| 3145 Bronx Rd Columbia, SC | 3.0 | 1.5 | 1207 | $1,511 | $1.25 | 25d | 1 | 1.40mi |
| 1018 Laurens St Columbia, SC | 3.0 | 1.0 | 1500 | $2,700 | $1.80 | 25d | 1 | 1.40mi |
| 2522 Lee St Columbia, SC | 5.0 | 2.0 | 2024 | $3,650 | $1.80 | 16d | 1 | 1.41mi |
Listing history 4 events
-
2026-06-03statusdays on market $240,000 Pending 5 DOM
-
2026-06-03days on market $240,000 Active 4 DOM
-
2026-06-01days on market $240,000 Active 3 DOM
-
2026-05-31days on market $240,000 Active 2 DOM
ⓘ Source: listings_history table (triggers on properties + properties_extension) + one-shot
backfill from property_details.listing_events for pre-trigger history.
Tax reassessment forecast SC · Resets to sale price
- Current annual tax
- $1,548 · $129/mo
- Projected year-2 tax
- $1,548 · $129/mo
- Expected delta
- $0/yr ($0/mo · 0.0%)
ⓘ Screening estimate from a state-policy table — verify with the county assessor before closing.
Climate risk First Street
- Flood 1/10 Low FEMA zone X (unshaded) · 0% chance over 30 yrs
- Wildfire 1/10 Low
- Heat 6/10 Major 7 d/yr ≥109°F today · 16 d/yr by 30 yrs out
- Wind 6/10 Major 68% chance of damaging wind over 30 yrs
- Air quality 3/10 Moderate 2 unhealthy d/yr today · 2 by 30 yrs out
Nearby sold comps map
Loading sold comps map…
Walkable amenities ~0.75 mi
Loading nearby amenities…
Taxation est. · year 1
- Rental income
- $26,702
- − Mortgage interest
- −$13,444
- − Property taxes
- −$1,548
- − Insurance
- −$1,200
- − Repairs & maintenance
- −$2,136
- − Management
- −$2,136
- − Depreciation
- −$6,982
- Taxable loss
- −$744
- Est. tax savings @ 24.0%
- +$179
- After-tax cash flow
- $3,422/yr
For passive investors: Depreciation is non-cash, so a rental often shows a tax loss while cash-flowing — sheltering income. Rental losses are passive: they offset passive income freely, and up to $25,000/yr can offset ordinary (W-2) income if you actively participate and your MAGI is under $100k (phasing out to $0 by $150k); unused losses carry forward. On sale, claimed depreciation is recaptured at up to 25%, and gains may owe capital-gains tax (a 1031 exchange can defer both). Figures are a year-1 estimate at your 24.0% rate — not tax advice; consult a CPA.
Schools (NCES district)
- District
- Richland 01
- NCES district ID
- 4503360
- Math proficiency
- 26% ▼ -7.00%
- Reading proficiency
- 36% ▼ -5.00%
- Median HH income
- $38,931
- Composite
- 25.94/100
- National rank
- #7335
- State rank
- #54 of 80 in SC
Livability — Columbia
- Score
- 78/100
- State rank
- #18
- US rank
- #2436
Category grades
Schools grade is shown separately in the Schools card above.
Census & demographics
- Census place
- Columbia, SC
- County
- Richland County · 389,530 people
- City population
- 335,994
- Metro
- Columbia, SC
- Population (ZIP)
- 18,159
- Household income
- $50,189
- Rent vs Own
- Severe rent burden
- 1045.0
Population outlook (Richland County) Hauer SSP2
- Today (2025)
- 459,667 people
- By 2030
- 487,524 · +6.1%
- By 2040
- 542,035 · +17.9%
- By 2050
- 595,371 · +29.5%
- By 2075
- 732,998 · +59.5%
- By 2100
- 820,415 · +78.5%
Race, ethnicity, and origin ACS 2023
- Neighborhood character
- Diverse neighborhood (Simpson 0.57)
- Race & ethnicity
- Black 48% White 44% Two or more races 3% Asian 3% Hispanic / Latino 2%
- Common ancestry
- Serbian 2% Slovak 2% Italian 1%
- Foreign-born
- 3% · Canada
- Languages at home
- 93% English-only · Spanish 2% Tagalog/Filipino 1% Arabic 1%
Political lean MEDSL · Richland
- 2024 margin
- Solid D (+34.6) · D 66.4% · R 31.8% · Other 1.8%
- 2008→2024 swing
- +5.7pp toward D · 2008: 28.9pp · 2024: 34.6pp
- All cycles
- 2024: D+34.6 2020: D+38.3 2016: D+32.9 2012: D+33.3 2008: D+28.9
Not yet ingested
- Civics
- —
Market trends
- HPI YoY
- ▼ -104.76%
- Current HPI
- 195.2246
- Rent YoY
- ▲ 4.73%
- Metro
- Columbia, SC
- State GDP YoY
- ▲ 4.51%
- F500 in state
- 2
Industry mix (Fortune 500 HQ in SC)
| Industry | F500 HQs | Revenue |
|---|---|---|
| Packaging | 1 | $7B |
|
||
Price history
+114.3% since first listed14 events — show timeline
- 2026-05-29 Listed $240,000 Consolidated MLS
- 2023-07-12 Sold (Public Records) $216,500 Public Records
- 2023-06-13 Pending — Consolidated MLS
- 2023-05-29 Contingent — Consolidated MLS
- 2023-05-26 Listed $210,000 Consolidated MLS
- 2023-05-24 Listing Removed — Charleston Trident MLS
- 2023-05-18 Listed $232,000 Charleston Trident MLS
- 2021-01-07 Sold (Public Records) $110,875 Public Records
- 2020-09-26 Delisted — Consolidated MLS
- 2020-09-16 Listed $115,000 Consolidated MLS
- 2020-02-12 Delisted — Consolidated MLS
- 2020-01-22 Relisted — Consolidated MLS
- 2019-11-04 Delisted — Consolidated MLS
- 2019-10-28 Listed $112,000 Consolidated MLS
Property tax history
+10.9%/yrLatest (2025): $1,548 · +3.7% YoY. Source: county tax records.
Cash-flow waterfall
monthlySold comps — $/sqft
last 12 mo · ≤1 miLoading sold comps…