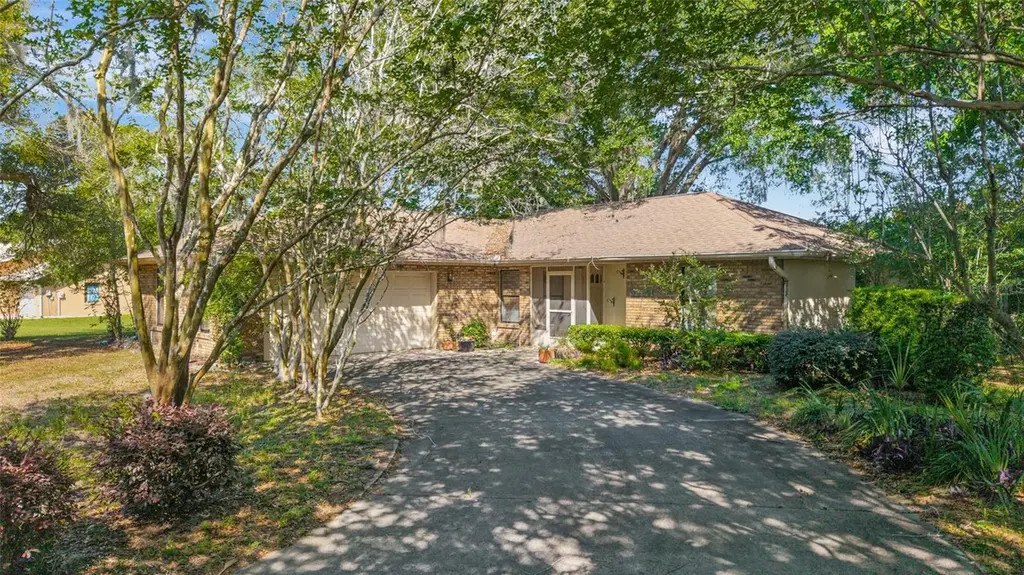
7385 SW 103rd Ln · Liberty Triangle, FL
Flood risk 1/10 · Minimal
- FEMA flood zone
- X (unshaded)
- Chance of flooding over 30 yrs
- 0.0%
- Est. flood insurance / yr
- $507 – $1,088
Fire risk 4/10 · Minor
- Est. fire insurance / yr
- $947 – $1,759
Heat risk 8/10 · Major
- Hot days now (above 107°F)
- 7 days/yr
- Hot days in 30 yrs
- 22 days/yr
Wind risk 9/10 · Severe
- Chance of severe wind over 30 yrs
- 99.0%
Air-quality risk 2/10 · Minimal
- Unhealthy air days now
- 2 days/yr
- Unhealthy air days in 30 yrs
- 2 days/yr
Risk factors via First Street. Map © Google.
Why this score? — see what drove the C- grade
The composite is a weighted blend of 9 inputs, each scored 0–100. Each bar is that input's sub-score; the figure is the points it added to the 100-point composite (weight × sub-score).
- Cash flow +16.7/30.0
- ARV discount +15.0/15.0
- DSCR +5.2/10.0
- 1% rule +3.6/10.0
- Schools +3.6/10.0
- Livability +2.5/5.0
- Condition / age +2.5/5.0
- Rent growth +1.9/5.0
- Appreciation +0.0/10.0
$210,000
🖨 Deal sheet 📄 Offer letter ✓ Due diligence
Listing remarks
Under contract-accepting backup offers. Tucked away on a generous 0.31-acre lot in desirable southwest Ocala, this charming three-bedroom, two-bath home offers a wonderful opportunity to create something special. Lovingly cared for by the same family for years, it’s now ready to welcome new owners to make it their own. Inside, you’ll find a comfortable layout featuring a living room, a separate dining room, and a bright, spacious 375 square feet sunroom at the back of the home, perfect for relaxing, entertaining or enjoying views of the backyard year-round. The spacious kitchen offers a breakfast bar, ample storage and a cozy breakfast nook, complete with a window overlooking th
Key facts
- 0.31-acre lot
- Walk-in closet
- Sunroom
Tags
Property features AI
Finance
- Other: Homestead exempt; Zoning: R3; Lot about 0.31 acre (1/4 to less than 1/2 acre)
- HOA & community: No association
Exterior
- Parking: Attached garage with 2 spaces
- Utilities: Public water; Septic tank; Cable available; Electricity connected; Sewer connected
- Home design: Single family residence; One story; Northeast facing
- Construction: Block construction; Shingle roof; Slab foundation; Building area reported as 2,534 square feet
- Exterior features: Private mailbox; Level lot; Asphalt road access
Interior
- Kitchen: Dishwasher; Range; Refrigerator
- Bedrooms: 3 bedrooms
- Flooring: Carpet; Tile
- Bathrooms: 2 full bathrooms
- Heating & cooling: Central heating; Central air conditioning
- Interior features: Eat-in kitchen; Kitchen/family room combo; Split bedroom floor plan
- Laundry & utility: Laundry room; Washer; Dryer
Neighborhood map
What this means for you Summary
Snapshot
- This is a 3-bed/2.0-bath single-family listed at $210k.
Deal economics
- At list price, monthly cash flow is $130 ($2k/yr) — positive.
- The deal already cash-flows at list — no discount required.
- To meet the 1% rule (rent ≥ 1% of price), the offer needs to be $181k (14.0% below list).
- Recommended offer: $181k (14.0% below list) — sets the bar for 1% rule.
- Cap rate 7.0% vs local median 4.5% in Liberty Triangle — top-decile yield for the area; either an underpriced asset or a hidden risk that comps aren't pricing in. Stress-test before assuming the spread holds.
Location & tenants
- Location reads: area grade C — affects rentability + tenant quality, not the cash-flow math above.
- Marion (rural): math 42% / reading 43% proficiency, ranked #61 of 73 in FL (top 84%) — families likely to look elsewhere, expect single-tenant / working-renter base with shorter leases; 61% free/reduced lunch — lower-income household profile, screen leases tightly.
- Zoned schools: Hammett Bowen Jr. Elementary School (math 56% / reading 56%, grade C+, #832 of 2,144 statewide, top 40%, 867 students, 54% FRL); West Port High School (math 34% / reading 52%, grade F, #255 of 667 statewide, top 39%, 2,906 students, 52% FRL).
- Market conditions: Rents soft (-2.6%/yr); 852 active listings in the ZIP; 21 comparable units currently listed for rent nearby; rentals at typical pace (median 21d on market — plan ~3-4 weeks tenant-placement turnaround); 7,071 units permitted in Marion County in 2024 (534 in 5+ unit buildings).
- This rent runs 33% of the median local income ($66k/yr) — at the standard rent-burdened threshold; future hikes will face affordability resistance.
Forward outlook
- Local home prices are declining (-3.0%/yr); year-one equity from $1k of loan paydown is wiped out by about $6k of value loss. Plan a longer hold.
- Marion County population projected at +13% by 2050 — modest demand growth; plan on rents tracking national, not racing it.
Negotiation context
- It's been on market 43 days — a 3% lower offer ($204k) is reasonable based on typical stale-listing flexibility.
- 2 sale attempts; this cycle's ask has dropped $15k (7%) from the opening price — seller is motivated, your offer sets the floor, not the list.
- Current owner paid $92k; list at $210k implies a 129% gain — meaningful room to come down on a strong offer.
Risks & watch-outs
- Climate carrying-cost: severe wind risk, 99% chance of damaging wind over 30y; extreme-heat days projected 7→22/yr by 2055 (HVAC capex compounding) — expect insurance premiums to compound above CPI over the hold.
Questions for the listing agent
- It's been on market 43 days. Have you received any prior offers? Is the seller open to a 14% concession, seller financing, or rate buy-down credit?
- Is there a deadline driving the sale (1031 exchange, divorce, estate, relocation)? That informs how much negotiation room exists.
- What's the average days-on-market for RENTAL listings here right now (not sales)? A rising rental-DOM trend means longer vacancies and softer asking-rent achievability than the comps imply.
- What's the recent tenant-quality profile in this submarket — average credit score on applications, eviction rate, late-payment / NSF rate, and stable-employment percentage? A property-management company in the area should have these aggregated.
- How much new for-sale + rental construction is in the pipeline within 1–3 miles? Heavy new supply typically softens prices + rents 12–24 months out; constrained supply supports both.
Investment metrics
- 1% rule
- 0.86% ✗
- Cap rate
- 7.04%
- Cash-on-cash
- 2.66%
- DSCR
- 1.12
- GRM
- 9.7
CMA / ARV
- ARV (median comp)
- $275,714
- List price
- $210,000
- Delta
- -23.83%
- Verdict
- UNDERPRICED
- Comps
- 20 within 1.0 mi
Show comp detail 5 sales within ~0.75 mi
| Address | Dist | Beds/Ba | Sqft | Sold | Price | $/sf | Match |
|---|---|---|---|---|---|---|---|
| 7448 SW 102 Pl | 0.10mi | 3/2.0 | 1,261 (-6%) | 22mo | $213,750 | $170 | 68 |
| 10696 SW 74th Ter | 0.30mi | 3/2.0 | 1,485 (+11%) | 2mo | $225,000 | $152 | 65 |
| 10655 SW 74th Ter | 0.24mi | 3/2.0 | 1,510 (+13%) | 12mo | $254,500 | $169 | 57 |
| 11120 SW 71st Terrace Rd | 0.71mi | 2/2.0 (-1) | 1,290 (-3%) | 13mo | $209,888 | $163 | 46 |
| 11132 SW 73rd Ct | 0.72mi | 3/2.0 | 1,530 (+15%) | 23mo | $275,000 | $180 | 23 |
Match score weights: distance 35% · size 25% · config 20% · recency 20%. Top-matched comps best support the ARV.
Projected returns pro-forma
-3.0% appreciation · 0.0% rent growth · sell at horizon
- IRR
- -15.2%
- Equity multiple
- 0.47×
- Total profit
- $-31,082
- Equity at exit
- $31,312
- IRR
- -12.1%
- Equity multiple
- 0.37×
- Total profit
- $-37,103
- Equity at exit
- $18,157
Cash invested: $58,800 (down + closing). Projections, not guarantees.
Landlord ↔ Tenant lean methodology
- Overall (STATE)
- 87 Strongly Landlord-Friendly
- State Florida
- 87 Strongly Landlord-Friendly · R+3
- County
- — inherits STATE
- City
- — inherits STATE
ZIP-level market 34476
- Rents YoY
- -2.6%
- Active inventory
- 852
- Price-to-rent
- 9.7×
Monthly cashflow live
- Estimated rent
- $1,807 high interval (Pro) →
- Mortgage (P&I)
- −$1,101
- Tax from tax record
- −$108 /mo · $1,297/yr
- Insurance
- −$88
- HOA
- −$0
- Vacancy / Maint / Mgmt
- −$379
- Net cashflow
- $130
Break-even live
UW: 25.0% down · 7.5% · 30yr · 1.5% tax · 5.0% vac · 8.0% maint · 8.0% mgmt
Financing live
Cash to close
- Down payment
- $52,500
- Closing costs
- $6,300
- Reserves months
- —
- Total cash needed
- —
Loan-product check · same deal, 3 products live
Conventional
25% down · 7.5% · 30yr
- Down + closing
- —
- Monthly P&I
- —
- Monthly cashflow
- —
- DSCR
- —
- Eligible?
- —
Personal DTI + credit; lowest rate.
DSCR
20% down · 8.5% · 30yr
- Down + closing
- —
- Monthly P&I
- —
- Monthly cashflow
- —
- DSCR
- —
- Eligible?
- —
No personal income docs; deal must DSCR.
Hard money
10% down · 12.0% · 12mo
- Down + closing
- —
- Monthly P&I
- —
- Monthly cashflow
- —
- DSCR
- —
- Eligible?
- —
Short-term bridge; refi at stabilization.
Rent comps 21 comps
| Address | Beds | Baths | Sqft | Rent | $/sqft | DOM | Units | Dist |
|---|---|---|---|---|---|---|---|---|
| 7750 SW 100th St Ocala, FL | 3.0 | 2.0 | 1805 | $1,795 | $0.99 | 21d | 1 | 0.57mi |
| 7750 SW 100th St Ocala, FL | 3.0 | 2.0 | 1805 | $1,750 | $0.97 | 13d | 1 | 0.57mi |
| 8130 SW 108th Street Rd Ocala, FL | 2.0 | 2.0 | 1084 | $1,975 | $1.82 | 21d | 1 | 0.96mi |
| 10912 SW 69th Cir Ocala, FL | 2.0 | 2.0 | 1169 | $1,600 | $1.37 | 21d | 1 | 1.11mi |
| 10819 SW 83rd Ct Ocala, FL | 3.0 | 2.0 | 1601 | $1,495 | $0.93 | 21d | 1 | 1.12mi |
| 15062 SW 63rd Ct Ocala, FL | 4.0 | 2.5 | 1560 | $1,850 | $1.19 | 21d | 1 | 1.17mi |
| 7867 SW 115th Loop Ocala, FL | 3.0 | 2.0 | 1462 | $1,600 | $1.09 | 21d | 1 | 1.22mi |
| 6345 SW 115th Street Rd Ocala, FL | 2.0 | 2.0 | 1008 | $1,400 | $1.39 | 21d | 1 | 1.23mi |
| 10441 SW 85th Ct Ocala, FL | 2.0 | 2.0 | 1090 | $1,495 | $1.37 | 21d | 1 | 1.24mi |
| 10312 SW 61st Terrace Rd Ocala, FL | 2.0 | 2.0 | 1008 | $1,650 | $1.64 | 21d | 1 | 1.31mi |
| 14173 SW 60th Ter Unit 2 Ocala, FL | 2.0 | 2.0 | 1127 | $1,450 | $1.29 | 21d | 1 | 1.34mi |
| 11302 SW 62nd Cir Ocala, FL | 3.0 | 2.0 | 1526 | $2,095 | $1.37 | 21d | 1 | 1.42mi |
| 8669 SW 108th Ln Ocala, FL | 2.0 | 1.0 | 1152 | $1,250 | $1.09 | 21d | 1 | 1.43mi |
| 8744 SW 108th Lane Rd Ocala, FL | 3.0 | 2.0 | 1614 | $2,200 | $1.36 | 21d | 1 | 1.43mi |
| 8655 SW 98th Street Rd Unit G Ocala, FL | 2.0 | 2.0 | 1424 | $1,500 | $1.05 | 21d | 1 | 1.45mi |
| 8757 SW 97th Lane Rd Unit C Ocala, FL | 2.0 | 2.0 | 1490 | $1,600 | $1.07 | 13d | 1 | 1.46mi |
| 6035 SW 98th Street Rd Ocala, FL | 2.0 | 2.0 | 1494 | $1,650 | $1.10 | 13d | 1 | 1.47mi |
| 8670 SW 97th St Unit A Ocala, FL | 2.0 | 2.0 | 1341 | $1,600 | $1.19 | 21d | 1 | 1.48mi |
| 9257 SW 82nd Ter Unit H Ocala, FL | 2.0 | 2.0 | 1748 | $1,600 | $0.92 | 21d | 1 | 1.48mi |
| 9853 SW 59th Cir Ocala, FL | 2.0 | 1.0 | 935 | $1,500 | $1.60 | 13d | 1 | 1.49mi |
| 8671 SW 97th St Unit C Ocala, FL | 2.0 | 2.0 | 1341 | $1,474 | $1.10 | 13d | 1 | 1.49mi |
Listing history 15 events
-
2026-06-15status $210,000 Pending 43 DOM
-
2026-06-15days on market $210,000 Active 43 DOM
-
2026-06-14days on market $210,000 Active 41 DOM
-
2026-06-13days on market $210,000 Active 40 DOM
-
2026-06-10pricedays on market $210,000 Active 38 DOM
-
2026-06-09days on market $224,900 Active 37 DOM
-
2026-06-09status $224,900 Active 36 DOM
-
2026-06-03statusdays on market $224,900 Pending 36 DOM
-
2026-06-02days on market $224,900 Active 35 DOM
-
2026-06-01days on market $224,900 Active 34 DOM
-
2026-05-31days on market $224,900 Active 33 DOM
-
2026-05-30days on market $224,900 Active 32 DOM
-
2026-04-28$224,900 Active 1648-char remark
-
1999-05-07soldstatus $91,600
-
1997-09-22soldstatus $85,000
ⓘ Source: listings_history table (triggers on properties + properties_extension) + one-shot
backfill from property_details.listing_events for pre-trigger history.
Tax reassessment forecast FL · Resets to sale price
- Current annual tax
- $1,297 · $108/mo
- Projected year-2 tax
- $1,743 · $145/mo
- Expected delta
- +$446/yr (+$37/mo · 34.4%)
ⓘ Screening estimate from a state-policy table — verify with the county assessor before closing.
Climate risk First Street
- Flood 1/10 Low FEMA zone X (unshaded) · 0% chance over 30 yrs
- Wildfire 4/10 Moderate
- Heat 8/10 Severe 7 d/yr ≥107°F today · 22 d/yr by 30 yrs out
- Wind 9/10 Extreme 99% chance of damaging wind over 30 yrs
- Air quality 2/10 Low 2 unhealthy d/yr today · 2 by 30 yrs out
Nearby sold comps map
Loading sold comps map…
Walkable amenities ~0.75 mi
Loading nearby amenities…
Taxation est. · year 1
- Rental income
- $21,680
- − Mortgage interest
- −$11,763
- − Property taxes
- −$1,297
- − Insurance
- −$1,050
- − Repairs & maintenance
- −$1,734
- − Management
- −$1,734
- − Depreciation
- −$6,109
- Taxable loss
- −$2,008
- Est. tax savings @ 24.0%
- +$482
- After-tax cash flow
- $2,047/yr
For passive investors: Depreciation is non-cash, so a rental often shows a tax loss while cash-flowing — sheltering income. Rental losses are passive: they offset passive income freely, and up to $25,000/yr can offset ordinary (W-2) income if you actively participate and your MAGI is under $100k (phasing out to $0 by $150k); unused losses carry forward. On sale, claimed depreciation is recaptured at up to 25%, and gains may owe capital-gains tax (a 1031 exchange can defer both). Figures are a year-1 estimate at your 24.0% rate — not tax advice; consult a CPA.
Schools (NCES district)
- District
- Marion
- NCES district ID
- 1201260
- Math proficiency
- 42% ▼ -7.00%
- Reading proficiency
- 43% ▼ -4.00%
- Median HH income
- $40,015
- Composite
- 35.61/100
- National rank
- #4890
- State rank
- #61 of 73 in FL
Livability — Liberty Triangle
No livability data for this city. (Only ~50 U.S. cities are tracked.)
Census & demographics
- Census place
- Liberty Triangle, FL
- County
- Marion County · 315,796 people
- City population
- 26,397
- Metro
- Ocala, FL
- Population (ZIP)
- 28,997
- Household income
- $65,860
- Rent vs Own
- Severe rent burden
- 204.0
Population outlook (Marion County) Hauer SSP2
- Today (2025)
- 365,905 people
- By 2030
- 376,768 · +3.0%
- By 2040
- 396,555 · +8.4%
- By 2050
- 412,723 · +12.8%
- By 2075
- 446,090 · +21.9%
- By 2100
- 436,193 · +19.2%
Race, ethnicity, and origin ACS 2023
- Neighborhood character
- Diverse neighborhood (Simpson 0.55)
- Race & ethnicity
- White 63% Hispanic / Latino 18% Black 13% Two or more races 10% Asian 1%
- Hispanic origin (detail)
- Mexican 3% Puerto Rican 8% Cuban 3%
- Common ancestry
- Romanian 3% Slovak 3% Lithuanian 3%
- Foreign-born
- 15% · Canada, Jamaica, Dominican Republic
- Languages at home
- 83% English-only · Spanish 14% Other Indo-European 1% German/W. Germanic 1%
Political lean MEDSL · Marion
- 2024 margin
- Solid R (+31.6) · D 33.8% · R 65.5%
- 2008→2024 swing
- -20.0pp toward R · 2008: -11.6pp · 2024: -31.6pp
- All cycles
- 2024: R+31.6 2020: R+25.9 2016: R+26.2 2012: R+16.2 2008: R+11.6
Not yet ingested
- Civics
- —
Market trends
- HPI YoY
- ▼ -105.22%
- Current HPI
- 189.0869
- Rent YoY
- ▼ -2.57%
- Metro
- Ocala, FL
- State GDP YoY
- ▲ 3.28%
- F500 in state
- 36
Industry mix (Fortune 500 HQ in FL)
| Industry | F500 HQs | Revenue |
|---|---|---|
| Industrial Technology | 2 | $29B |
|
||
| Insurance | 2 | $17B |
|
||
| Retail | 1 | $60B |
|
||
| Technology Distribution | 1 | $58B |
|
||
| Homebuilding | 1 | $35B |
|
||
| Technology Manufacturing | 1 | $35B |
|
||
Price history
+147.1% since first listed7 events — show timeline
- 2026-06-15 Pending — Stellar MLS as Distributed by MLS Grid
- 2026-06-09 Price Changed $210,000 Stellar MLS as Distributed by MLS Grid
- 2026-06-08 Relisted — Stellar MLS as Distributed by MLS Grid
- 2026-06-03 Pending — Stellar MLS as Distributed by MLS Grid
- 2026-04-28 Listed $224,900 Stellar MLS as Distributed by MLS Grid
- 1999-05-07 Sold (Public Records) $91,600 Public Records
- 1997-09-22 Sold (Public Records) $85,000 Public Records
Property tax history
+3.7%/yrLatest (2025): $1,297 · +22.3% YoY. Source: county tax records.
Cash-flow waterfall
monthlySold comps — $/sqft
last 12 mo · ≤1 miLoading sold comps…