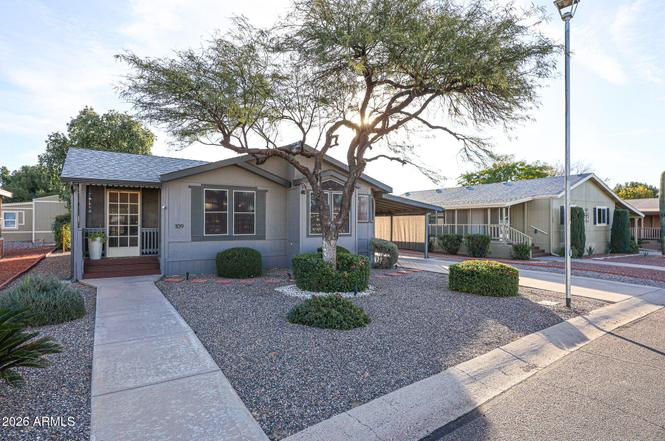
3901 E Pinnacle Peak Rd #109 · Phoenix, AZ
Flood risk No data
- FEMA flood zone
- —
- Chance of flooding over 30 yrs
- —
- Est. flood insurance / yr
- —
Fire risk No data
- Est. fire insurance / yr
- —
Heat risk No data
- Hot days now (above threshold)
- —
- Hot days in 30 yrs
- —
Wind risk No data
- Chance of severe wind over 30 yrs
- —
Air-quality risk No data
- Unhealthy air days now
- —
- Unhealthy air days in 30 yrs
- —
Risk factors via First Street. Map © Google.
Why this score? — see what drove the B+ grade
The composite is a weighted blend of 9 inputs, each scored 0–100. Each bar is that input's sub-score; the figure is the points it added to the 100-point composite (weight × sub-score).
- Cash flow +30.0/30.0
- ARV discount +14.5/15.0
- 1% rule +10.0/10.0
- DSCR +10.0/10.0
- Schools +3.8/10.0
- Livability +3.8/5.0
- Rent growth +3.0/5.0
- Condition / age +2.5/5.0
- Appreciation +0.0/10.0
$130,000
🖨 Deal sheet 📄 Offer letter ✓ Due diligence
Listing remarks
Price Adjustment! Seller has moved out. Come See! Completely Remodeled in 2022 and so open and bright! Owner put in new white kitchen cabinets and large island, Stainless Steel appliances recessed lighting, all new plumbing, trex deck. Barstools and all patio furniture will convey with home. You have to come see. 2022 HVAC. This one is ready for you! 2 Sinks in the master with walk in shower. It's all done and priced to sell! Large shed with window a/c unit. Covered Deck plus additional yard area for pet and entertaining. Come see this 55+ park with 9 hole executive golf course free for owners, 24/7 manned guard gate, pool, pickleball and clubhouse. Monthly land lease $955 includes water/s
Key facts
- 2022 hvac
- New plumbing
- New white kitchen
Tags
Property features AI
Finance
- Other: Lot size not available
- HOA & community: Land lease (monthly); Land lease amount: $955 monthly; Association covers sewer, water, trash, street maintenance, and grounds maintenance; Community amenities include pool, heated community spa, golf, and pickleball courts
Exterior
- Parking: 1 open parking space; 2 covered spaces; 2 carport spaces
- Security: Gated community; Guarded entry
- Utilities: City water; Sewer: other
- Home design: Manufactured/mobile home; Leasehold ownership
- Construction: Wood frame construction; Painted exterior; Composition roof; Building area per builder
- Exterior features: Storage; Sprinklers in front and rear; Gravel/stone front and back
Interior
- Kitchen: Built-in microwave; Refrigerator; Dishwasher
- Bedrooms: 2 possible bedrooms
- Flooring: Vinyl
- Bathrooms: 2 full bathrooms
- Heating & cooling: Electric heating; Central air conditioning
- Interior features: Double vanity; Breakfast bar; Furnished (see remarks); Master bedroom with 3/4 bath; Dual-pane, ENERGY STAR qualified windows
- Laundry & utility: Inside laundry
Neighborhood map
What this means for you Summary
Snapshot
- This is a 2-bed/2.0-bath manufactured listed at $130k.
Deal economics
- At list price, monthly cash flow is $2k ($19k/yr) — positive.
- The deal already cash-flows at list — no discount required.
- Meets the 1% rule at list price ($3k rent vs $130k).
- Recommended offer: $118k (9.0% below list) — sets the bar for market timing.
- Cap rate 21.0% vs local median 3.3% in Phoenix — top-decile yield for the area; either an underpriced asset or a hidden risk that comps aren't pricing in. Stress-test before assuming the spread holds.
Location & tenants
- Location reads 75/100 on livability (#16 in AZ, #3,924 nationally) — a middle-class / working-renter tenant base. Strengths: amenities A+, commute A+, housing A+; Watch: health & safety C-, crime F.
- Paradise Valley Unified District (4241) (urban): math 39% / reading 46% proficiency, ranked #56 of 249 in AZ (top 22%) — families likely to look elsewhere, expect single-tenant / working-renter base with shorter leases.
- Market conditions: Rents rising (+2.0%/yr); 218 active listings in the ZIP; 15 comparable units currently listed for rent nearby; rentals at typical pace (median 18d on market — plan ~3-4 weeks tenant-placement turnaround); high-income renter base; 36,011 units permitted in Maricopa County in 2024 (12,801 in 5+ unit buildings).
Forward outlook
- Local home prices are declining (-3.0%/yr); year-one equity from $899 of loan paydown is wiped out by about $4k of value loss. Plan a longer hold.
- Maricopa County population projected at +38% by 2050 — long-run rental-demand tailwind backs the buy-and-hold thesis.
- At projected returns (-3.0% appreciation + 2.0% rent growth), your $36k cash investment doubles in ~3 years — after that, you're playing with house money.
Negotiation context
- It's been on market 109 days — a 9% lower offer ($118k) is reasonable based on typical stale-listing flexibility.
- 3 sale attempts since 4y ago; this cycle's ask has dropped $39k (23%) from the opening price — seller is motivated, your offer sets the floor, not the list.
Questions for the listing agent
- It's been on market 109 days. Have you received any prior offers? Is the seller open to a 9% concession, seller financing, or rate buy-down credit?
- Why hasn't it sold? Are there any deal-killer items the seller is aware of (foundation, flood, title, zoning, code violations)?
- Is there a deadline driving the sale (1031 exchange, divorce, estate, relocation)? That informs how much negotiation room exists.
- Crime grade is F in this area — have there been break-ins, vandalism, or insurance claims at this property in the last 3 years? What carrier currently insures it and at what premium?
- What's the average days-on-market for RENTAL listings here right now (not sales)? A rising rental-DOM trend means longer vacancies and softer asking-rent achievability than the comps imply.
- What's the recent tenant-quality profile in this submarket — average credit score on applications, eviction rate, late-payment / NSF rate, and stable-employment percentage? A property-management company in the area should have these aggregated.
- How much new for-sale + rental construction is in the pipeline within 1–3 miles? Heavy new supply typically softens prices + rents 12–24 months out; constrained supply supports both.
Investment metrics
- 1% rule
- 2.42% ✓
- Cap rate
- 20.98%
- Cash-on-cash
- 52.47%
- DSCR
- 3.33
- GRM
- 3.4
CMA / ARV
- ARV (on-the-fly)
- $154,000
- Comps found
- 12
Show comp detail 12 sales within ~0.75 mi
| Address | Dist | Beds/Ba | Sqft | Sold | Price | $/sf | Match |
|---|---|---|---|---|---|---|---|
| 3901 E Pinnacle Peak Rd #109 | 0.00mi | 2/2.0 | 1,400 (0%) | 1mo | $130,000 | $93 | 99 |
| 3901 E Pinnacle Peak Rd #4 | 0.00mi | 3/2.0 (+1) | 1,456 (+4%) | 4mo | $179,000 | $123 | 85 |
| 3901 E Pinnacle Peak Rd #323 | 0.00mi | 2/2.0 | 1,296 (-7%) | 4mo | $159,000 | $123 | 84 |
| 3901 E Pinnacle Peak Rd #67 | 0.00mi | 2/2.0 | 1,316 (-6%) | 8mo | $172,000 | $131 | 84 |
| 3901 E Pinnacle Peak Rd #240 | 0.07mi | 3/2.0 (+1) | 1,456 (+4%) | 3mo | $152,500 | $105 | 83 |
| 3901 E Pinnacle Peak Rd #250 | 0.00mi | 2/2.0 | 1,248 (-11%) | 3mo | $152,000 | $122 | 80 |
| 3901 E Pinnacle Peak Rd #339 | 0.02mi | 2/2.0 | 1,550 (+11%) | 4mo | $170,000 | $110 | 78 |
| 3901 E Pinnacle Peak Rd #294 | 0.00mi | 2/2.0 | 1,560 (+11%) | 4mo | $142,000 | $91 | 78 |
| 3901 E Pinnacle Peak Rd #275 | 0.07mi | 2/2.0 | 1,560 (+11%) | 1mo | $160,000 | $103 | 77 |
| 3901 E Pinnacle Peak Rd #134 | 0.00mi | 3/2.0 (+1) | 1,560 (+11%) | 1mo | $145,000 | $93 | 75 |
| 3901 E Pinnacle Peak Rd #65 | 0.07mi | 2/2.0 | 1,534 (+10%) | 7mo | $207,000 | $135 | 75 |
| 3901 E Pinnacle Peak Rd #108 | 0.07mi | 3/2.0 (+1) | 1,248 (-11%) | 1mo | $132,000 | $106 | 73 |
Match score weights: distance 35% · size 25% · config 20% · recency 20%. Top-matched comps best support the ARV.
Projected returns pro-forma
-3.0% appreciation · 1.98% rent growth · sell at horizon
- IRR
- 49.3%
- Equity multiple
- 3.12×
- Total profit
- $77,148
- Equity at exit
- $19,383
- IRR
- 54.4%
- Equity multiple
- 6.08×
- Total profit
- $185,027
- Equity at exit
- $11,240
Cash invested: $36,400 (down + closing). Projections, not guarantees.
Landlord ↔ Tenant lean methodology
- Overall (STATE)
- 87 Strongly Landlord-Friendly
- State Arizona
- 87 Strongly Landlord-Friendly · R+3
- County
- — inherits STATE
- City
- — inherits STATE
ZIP-level market 85050
- Home prices YoY
- -21.9%
- Rents YoY
- 2.0%
- Active inventory
- 218
- Price-to-rent
- 3.4×
Monthly cashflow live
- Estimated rent
- $3,152 high interval (Pro) →
- Mortgage (P&I)
- −$682
- Tax est. 1.5%
- −$162 /mo · $1,950/yr
- Insurance
- −$54
- HOA
- −$0
- Vacancy / Maint / Mgmt
- −$662
- Net cashflow
- $1,592
Break-even live
UW: 25.0% down · 7.5% · 30yr · 1.5% tax · 5.0% vac · 8.0% maint · 8.0% mgmt
Financing live
Cash to close
- Down payment
- $32,500
- Closing costs
- $3,900
- Reserves months
- —
- Total cash needed
- —
Loan-product check · same deal, 3 products live
Conventional
25% down · 7.5% · 30yr
- Down + closing
- —
- Monthly P&I
- —
- Monthly cashflow
- —
- DSCR
- —
- Eligible?
- —
Personal DTI + credit; lowest rate.
DSCR
20% down · 8.5% · 30yr
- Down + closing
- —
- Monthly P&I
- —
- Monthly cashflow
- —
- DSCR
- —
- Eligible?
- —
No personal income docs; deal must DSCR.
Hard money
10% down · 12.0% · 12mo
- Down + closing
- —
- Monthly P&I
- —
- Monthly cashflow
- —
- DSCR
- —
- Eligible?
- —
Short-term bridge; refi at stabilization.
Rent comps 15 comps
| Address | Beds | Baths | Sqft | Rent | $/sqft | DOM | Units | Dist |
|---|---|---|---|---|---|---|---|---|
| 3935 E Rough Rider Rd Phoenix, AZ | 2.0 | 2.5–3.0 | 1490 | $4,750 | $3.19 | 43d | 2 | 0.65mi |
| 3935 E Rough Rider Rd Phoenix, AZ | 2.0 | 2.5 | 1383 | $4,350 | $3.15 | 17d | 2 | 0.65mi |
| 3935 E Rough Rider Rd Phoenix, AZ | 2.0–3.0 | 2.5 | 1405 | $2,600 | $1.85 | 18d | 3 | 0.65mi |
| 4066 E Melinda Ln Phoenix, AZ | 3.0 | 2.5 | 1269 | $3,500 | $2.76 | 43d | 1 | 0.97mi |
| 4517 E Melinda Ln Phoenix, AZ | 3.0 | 2.0 | 1663 | $3,100 | $1.86 | 14d | 1 | 1.31mi |
| 4509 E Lone Cactus Dr Phoenix, AZ | 3.0 | 2.0 | 1663 | $4,500 | $2.71 | 43d | 1 | 1.32mi |
| 21624 N 46th Pl Phoenix, AZ | 3.0 | 2.0 | 1540 | $3,200 | $2.08 | 5d | 1 | 1.37mi |
| 3626 E Potter Dr Phoenix, AZ | 3.0 | 2.0 | 1519 | $2,500 | $1.65 | 24d | 1 | 1.37mi |
| 4632 E Mossman Rd Phoenix, AZ | 3.0 | 2.0 | 1519 | $3,800 | $2.50 | 43d | 1 | 1.37mi |
| 20729 N 37th Way Phoenix, AZ | 3.0 | 2.0 | 1670 | $3,000 | $1.80 | 15d | 1 | 1.39mi |
| 20660 N 40th St Phoenix, AZ | 2.0–3.0 | 2.0 | 1325 | $1,749 | $1.32 | 18d | 4 | 1.42mi |
| 4726 E Mossman Rd Phoenix, AZ | 3.0 | 2.5 | 1610 | $2,500 | $1.55 | 7d | 1 | 1.43mi |
| 4723 E Weaver Rd Phoenix, AZ | 3.0 | 2.0 | 1663 | $2,595 | $1.56 | 14d | 1 | 1.44mi |
| 20660 N 40th St #2137 Phoenix, AZ | 2.0 | 2.0 | 1131 | $3,500 | $3.09 | 43d | 1 | 1.46mi |
| 21150 N Tatum Blvd Phoenix, AZ | 1.0–3.0 | 1.0–2.0 | 1136 | $1,938 | $1.71 | 2d | 26 | 1.48mi |
Listing history 11 events
-
2026-05-05status Pending
-
2026-04-24historical Under Contract Accepting Backups
-
2026-04-16price $130,000
-
2026-03-11price $140,000
-
2026-02-27price $159,000
-
2026-01-30price $166,000
-
2026-01-15$169,000 Active
-
2022-07-26status Active
-
2022-07-26historical
-
2022-07-21historical
-
2022-07-13$119,950
ⓘ Source: listings_history table (triggers on properties + properties_extension) + one-shot
backfill from property_details.listing_events for pre-trigger history.
Nearby sold comps map
Loading sold comps map…
Walkable amenities ~0.75 mi
Loading nearby amenities…
Taxation est. · year 1
- Rental income
- $37,822
- − Mortgage interest
- −$7,282
- − Property taxes
- −$1,950
- − Insurance
- −$650
- − Repairs & maintenance
- −$3,026
- − Management
- −$3,026
- − Depreciation
- −$3,782
- Taxable income
- $18,107
- Est. tax owed @ 24.0%
- −$4,346
- After-tax cash flow
- $14,753/yr
For passive investors: Depreciation is non-cash, so a rental often shows a tax loss while cash-flowing — sheltering income. Rental losses are passive: they offset passive income freely, and up to $25,000/yr can offset ordinary (W-2) income if you actively participate and your MAGI is under $100k (phasing out to $0 by $150k); unused losses carry forward. On sale, claimed depreciation is recaptured at up to 25%, and gains may owe capital-gains tax (a 1031 exchange can defer both). Figures are a year-1 estimate at your 24.0% rate — not tax advice; consult a CPA.
Schools (NCES district)
- District
- Paradise Valley Unified District (4241)
- NCES district ID
- 0405930
- Math proficiency
- 39% ▼ -11.00%
- Reading proficiency
- 46% ▼ -7.00%
- Median HH income
- $64,106
- Composite
- 37.89/100
- National rank
- #4316
- State rank
- #56 of 249 in AZ
Livability — Phoenix
- Score
- 75/100
- State rank
- #16
- US rank
- #3924
Category grades
Schools grade is shown separately in the Schools card above.
Census & demographics
- Census place
- Phoenix, AZ
- County
- Maricopa County · 4,537,380 people
- City population
- 1,500,198
- Metro
- Phoenix-Mesa-Chandler, AZ
- Population (ZIP)
- 33,118
- Household income
- $139,836
- Rent vs Own
- Severe rent burden
- 432.0
Population outlook (Maricopa County) Hauer SSP2
- Today (2025)
- 4,979,203 people
- By 2030
- 5,378,229 · +8.0%
- By 2040
- 6,156,598 · +23.6%
- By 2050
- 6,872,376 · +38.0%
- By 2075
- 8,401,270 · +68.7%
- By 2100
- 9,247,439 · +85.7%
Race, ethnicity, and origin ACS 2023
- Neighborhood character
- Predominantly White (71%)
- Race & ethnicity
- White 71% Hispanic / Latino 11% Two or more races 11% Asian 9% Black 2%
- Hispanic origin (detail)
- Mexican 8%
- Common ancestry
- Romanian 5% Italian 4% Lithuanian 3%
- Foreign-born
- 15% · Canada, China, Vietnam
- Languages at home
- 82% English-only · Spanish 6% Other Indo-European 5% Other Asian/Pacific 2%
Political lean MEDSL · Maricopa
- 2024 margin
- Toss-up / Even · D 47.7% · R 51.2% · Other 1.1%
- 2008→2024 swing
- +7.1pp toward D · 2008: -10.6pp · 2024: -3.5pp
- All cycles
- 2024: R+3.5 2020: D+2.2 2016: R+3.5 2012: R+12.0 2008: R+10.6
Not yet ingested
- Civics
- —
Market trends
- HPI YoY
- ▼ -86.38%
- Current HPI
- 308.7483
- Rent YoY
- ▲ 1.98%
- Metro
- Phoenix-Mesa-Chandler, AZ
- State GDP YoY
- ▲ 4.54%
- F500 in state
- 20
Industry mix (Fortune 500 HQ in AZ)
| Industry | F500 HQs | Revenue |
|---|---|---|
| Technology | 2 | $13B |
|
||
| Mining / Metals | 1 | $23B |
|
||
| Environmental Services | 1 | $16B |
|
||
| Metals / Steel | 1 | $14B |
|
||
| Technology Distribution | 1 | $9B |
|
||
| Homebuilding | 1 | $8B |
|
||
Price history
+8.4% since first listed11 events — show timeline
- 2026-05-05 Pending — ARMLS
- 2026-04-24 Contingent — ARMLS
- 2026-04-16 Price Changed $130,000 ARMLS
- 2026-03-11 Price Changed $140,000 ARMLS
- 2026-02-27 Price Changed $159,000 ARMLS
- 2026-01-30 Price Changed $166,000 ARMLS
- 2026-01-15 Listed $169,000 ARMLS
- 2022-07-26 Relisted — ARMLS
- 2022-07-26 Listing Removed — ARMLS
- 2022-07-21 Listing Removed — ARMLS
- 2022-07-13 Listed $119,950 ARMLS
Cash-flow waterfall
monthlySold comps — $/sqft
last 12 mo · ≤1 miLoading sold comps…