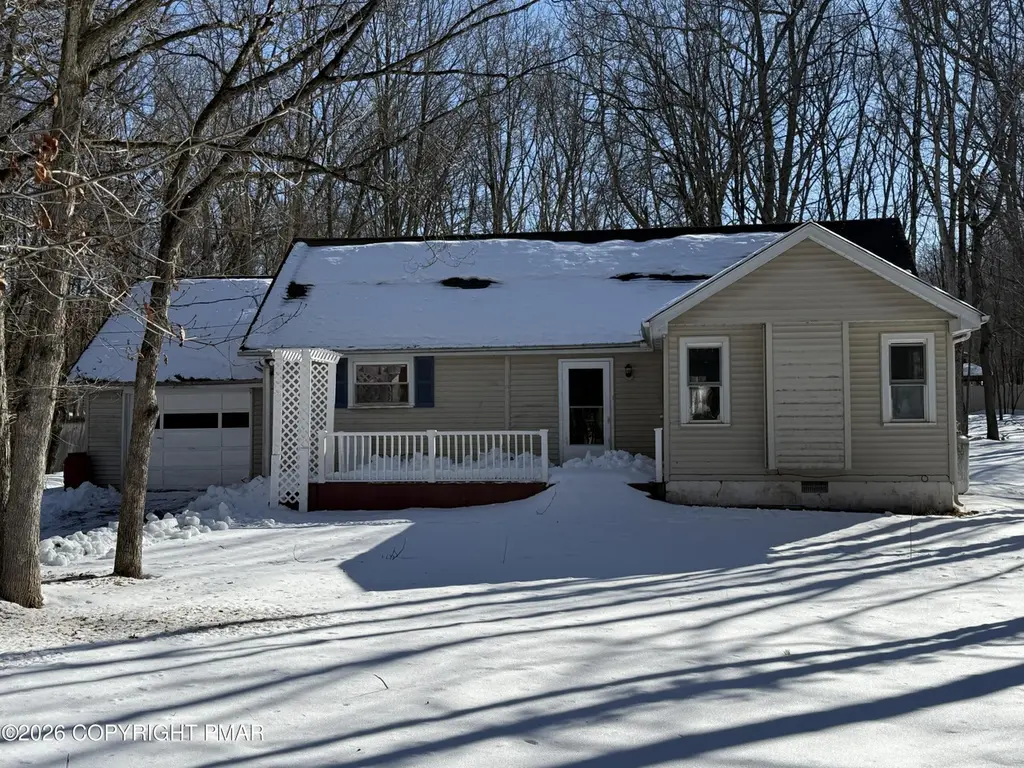
118 Buckhill Rd · Indian Mountain Lake, PA
Flood risk 1/10 · Minimal
- FEMA flood zone
- X (unshaded)
- Chance of flooding over 30 yrs
- 0.0%
- Est. flood insurance / yr
- $507 – $1,088
Fire risk 4/10 · Minor
- Est. fire insurance / yr
- $511 – $949
Heat risk 2/10 · Minimal
- Hot days now (above 91°F)
- 7 days/yr
- Hot days in 30 yrs
- 15 days/yr
Wind risk 4/10 · Minor
- Chance of severe wind over 30 yrs
- 7.0%
Air-quality risk 3/10 · Minor
- Unhealthy air days now
- 1 days/yr
- Unhealthy air days in 30 yrs
- 4 days/yr
Risk factors via First Street. Map © Google.
Why this score? — see what drove the B- grade
The composite is a weighted blend of 9 inputs, each scored 0–100. Each bar is that input's sub-score; the figure is the points it added to the 100-point composite (weight × sub-score).
- Cash flow +24.6/30.0
- ARV discount +13.1/15.0
- DSCR +8.0/10.0
- 1% rule +7.2/10.0
- Appreciation +3.6/10.0
- Schools +3.1/10.0
- Livability +3.1/5.0
- Rent growth +2.5/5.0
- Condition / age +2.5/5.0
$179,000
🖨 Deal sheet 📄 Offer letter ✓ Due diligence
Listing remarks MLS
Attention INVESTOR and VISIONARIES! This 3-bedroom, 1-bath gem is a blank canvas awaiting your creative touch. Perfectly sized for a high-demand rental or a profitable resale, this home offers ''great bones'' and a traditional layout that just needs rehabilitation to be brought back to its original glory. Whether you are looking for your next flip or a long-term addition to your portfolio, this property is priced to move and sold strictly AS-IS.
Key facts
- 0.46 acre lot
- Garage
- Community pool
Neighborhood map
What this means for you Summary
Snapshot
- This is a 3-bed/1.0-bath single-family listed at $179k.
Deal economics
- At list price, monthly cash flow is $372 ($4k/yr) — positive.
- The deal already cash-flows at list — no discount required.
- Meets the 1% rule at list price ($2k rent vs $179k).
- Recommended offer: $168k (6.0% below list) — sets the bar for market timing.
- Cap rate 8.8% vs local median 4.7% in Indian Mountain Lake — top-decile yield for the area; either an underpriced asset or a hidden risk that comps aren't pricing in. Stress-test before assuming the spread holds.
Location & tenants
- Location reads 62/100 on livability (#1,349 in PA) — a middle-class / working-renter tenant base. Strengths: cost of living A+, housing A+, crime A; Watch: schools D, health & safety D, amenities F.
- Jim Thorpe Area SD (rural): math 25% / reading 47% proficiency, ranked #394 of 539 in PA (top 73%) — families likely to look elsewhere, expect single-tenant / working-renter base with shorter leases.
- Market conditions: 453 active listings in the ZIP; 5 comparable units currently listed for rent nearby; rentals at typical pace (median 14d on market — plan ~3-4 weeks tenant-placement turnaround); 180 units permitted in Carbon County in 2024 (10 in 5+ unit buildings).
Forward outlook
- Local home prices are declining (-2.9%/yr); year-one equity from $1k of loan paydown is wiped out by about $5k of value loss. Plan a longer hold.
- Carbon County population projected at -18% by 2050 — secular population decline; favor cash flow + early exit over multi-decade hold.
Negotiation context
- It's been on market 84 days — a 6% lower offer ($168k) is reasonable based on typical stale-listing flexibility.
- 7 sale attempts with the ask held roughly flat each time — persistent listings suggest the price (not the market) is what's stuck; bring a comps-based counter.
- Current owner paid $94k; list at $179k implies a 91% gain — meaningful room to come down on a strong offer.
Questions for the listing agent
- It's been on market 84 days. Have you received any prior offers? Is the seller open to a 6% concession, seller financing, or rate buy-down credit?
- Built in 1969 — when were the roof, HVAC, electrical panel, plumbing, and water heater last replaced?
- What does the HOA fee cover, when was the last increase, and are there any pending special assessments or reserve-fund shortfalls?
- Why hasn't it sold? Are there any deal-killer items the seller is aware of (foundation, flood, title, zoning, code violations)?
- Is there a deadline driving the sale (1031 exchange, divorce, estate, relocation)? That informs how much negotiation room exists.
- Schools are D-rated, which usually means shorter tenancies and higher turnover. Who's the typical renter profile here, and what's been the actual vacancy rate?
- What's the average days-on-market for RENTAL listings here right now (not sales)? A rising rental-DOM trend means longer vacancies and softer asking-rent achievability than the comps imply.
- What's the recent tenant-quality profile in this submarket — average credit score on applications, eviction rate, late-payment / NSF rate, and stable-employment percentage? A property-management company in the area should have these aggregated.
- How much new for-sale + rental construction is in the pipeline within 1–3 miles? Heavy new supply typically softens prices + rents 12–24 months out; constrained supply supports both.
Investment metrics
- 1% rule
- 1.22% ✓
- Cap rate
- 8.78%
- Cash-on-cash
- 8.90%
- DSCR
- 1.40
- GRM
- 6.8
CMA / ARV
- ARV (median comp)
- $204,649
- List price
- $179,000
- Delta
- -12.53%
- Verdict
- UNDERPRICED
- Comps
- 20 within 1.0 mi
Show comp detail 12 sales within ~0.75 mi
| Address | Dist | Beds/Ba | Sqft | Sold | Price | $/sf | Match |
|---|---|---|---|---|---|---|---|
| 118 Buckhill Rd | 0.00mi | 3/1.0 | 1,168 (-1%) | 0mo | $160,000 | $137 | 98 |
| 126 Lenape Trl | 0.09mi | 3/1.0 | 1,200 (+1%) | 9mo | $200,000 | $167 | 86 |
| 10 White Birch Way | 0.26mi | 3/1.5 | 1,200 (+1%) | 1mo | $250,000 | $208 | 82 |
| 87 Lenape Trl | 0.19mi | 3/1.0 | 1,270 (+7%) | 3mo | $275,000 | $217 | 76 |
| 9 Pine Tree Rd | 0.30mi | 2/1.0 (-1) | 1,072 (-10%) | 6mo | $225,000 | $210 | 60 |
| 64 Shawnee Trl | 0.27mi | 3/2.0 | 1,350 (+14%) | 2mo | $299,000 | $221 | 59 |
| 49 Mansi Dr | 0.71mi | 3/1.0 | 1,200 (+1%) | 9mo | $244,900 | $204 | 57 |
| 26 Grouse Trl | 0.69mi | 3/1.0 | 1,128 (-5%) | 6mo | $265,000 | $235 | 55 |
| 85 Shawnee Trl | 0.23mi | 4/2.0 (+1) | 1,352 (+14%) | 4mo | $270,000 | $200 | 54 |
| 47 Tapuco Dr | 0.40mi | 3/1.0 | 1,344 (+14%) | 10mo | $145,000 | $108 | 51 |
| 23 Willow Way | 0.47mi | 2/1.0 (-1) | 1,008 (-15%) | 0mo | $188,000 | $187 | 48 |
| 49 Sekani Trl | 0.42mi | 2/2.0 (-1) | 1,322 (+12%) | 14mo | $200,000 | $151 | 40 |
Match score weights: distance 35% · size 25% · config 20% · recency 20%. Top-matched comps best support the ARV.
Projected returns pro-forma
-2.89% appreciation · 3.0% rent growth · sell at horizon
- IRR
- -2.3%
- Equity multiple
- 0.91×
- Total profit
- $-4,375
- Equity at exit
- $27,592
- IRR
- 7.2%
- Equity multiple
- 1.56×
- Total profit
- $27,834
- Equity at exit
- $17,031
Cash invested: $50,120 (down + closing). Projections, not guarantees.
Landlord ↔ Tenant lean methodology
- Overall (STATE)
- 62 Landlord-Friendly
- State Pennsylvania
- 62 Landlord-Friendly · EVEN
- County
- — inherits STATE
- City
- — inherits STATE
ZIP-level market 18210
- Home prices YoY
- -1.4%
- Active inventory
- 453
- Price-to-rent
- 6.8×
Monthly cashflow live
- Estimated rent
- $2,189 high interval (Pro) →
- Mortgage (P&I)
- −$939
- Tax from tax record
- −$252 /mo · $3,028/yr
- Insurance
- −$75
- HOA
- −$92
- Vacancy / Maint / Mgmt
- −$460
- Net cashflow
- $372
Break-even live
UW: 25.0% down · 7.5% · 30yr · 1.5% tax · 5.0% vac · 8.0% maint · 8.0% mgmt
Financing live
Cash to close
- Down payment
- $44,750
- Closing costs
- $5,370
- Reserves months
- —
- Total cash needed
- —
Loan-product check · same deal, 3 products live
Conventional
25% down · 7.5% · 30yr
- Down + closing
- —
- Monthly P&I
- —
- Monthly cashflow
- —
- DSCR
- —
- Eligible?
- —
Personal DTI + credit; lowest rate.
DSCR
20% down · 8.5% · 30yr
- Down + closing
- —
- Monthly P&I
- —
- Monthly cashflow
- —
- DSCR
- —
- Eligible?
- —
No personal income docs; deal must DSCR.
Hard money
10% down · 12.0% · 12mo
- Down + closing
- —
- Monthly P&I
- —
- Monthly cashflow
- —
- DSCR
- —
- Eligible?
- —
Short-term bridge; refi at stabilization.
Rent comps 5 comps
| Address | Beds | Baths | Sqft | Rent | $/sqft | DOM | Units | Dist |
|---|---|---|---|---|---|---|---|---|
| 182 Mountain Rd Albrightsville, PA | 3.0 | 1.0 | 960 | $2,100 | $2.19 | 2d | 1 | 0.67mi |
| 35 Grouse Trl Albrightsville, PA | 3.0 | 2.0 | 1399 | $2,500 | $1.79 | 14d | 1 | 0.73mi |
| 40 Nosirrah Rd Albrightsville, PA | 4.0 | 1.0 | 1338 | $1,995 | $1.49 | 14d | 1 | 1.07mi |
| 20 Iowa Rd Albrightsville, PA | 3.0 | 1.0 | 930 | $2,750 | $2.96 | 23d | 1 | 1.27mi |
| 45 Piute Trl Albrightsville, PA | 3.0 | 2.0 | 1248 | $1,495 | $1.20 | 2d | 1 | 1.50mi |
HOA detail
- Monthly dues
- $92 · $1,104/yr
Listing history 13 events
-
2026-04-26status Active 449-char remark
Show marketing remark (449 chars)
Attention INVESTOR and VISIONARIES! This 3-bedroom, 1-bath gem is a blank canvas awaiting your creative touch. Perfectly sized for a high-demand rental or a profitable resale, this home offers ''great bones'' and a traditional layout that just needs rehabilitation to be brought back to its original glory. Whether you are looking for your next flip or a long-term addition to your portfolio, this property is priced to move and sold strictly AS-IS.
-
2026-04-22status Pending 449-char remark
Show marketing remark (449 chars)
Attention INVESTOR and VISIONARIES! This 3-bedroom, 1-bath gem is a blank canvas awaiting your creative touch. Perfectly sized for a high-demand rental or a profitable resale, this home offers ''great bones'' and a traditional layout that just needs rehabilitation to be brought back to its original glory. Whether you are looking for your next flip or a long-term addition to your portfolio, this property is priced to move and sold strictly AS-IS.
-
2026-02-26$179,000 Active 449-char remark
Show marketing remark (449 chars)
Attention INVESTOR and VISIONARIES! This 3-bedroom, 1-bath gem is a blank canvas awaiting your creative touch. Perfectly sized for a high-demand rental or a profitable resale, this home offers ''great bones'' and a traditional layout that just needs rehabilitation to be brought back to its original glory. Whether you are looking for your next flip or a long-term addition to your portfolio, this property is priced to move and sold strictly AS-IS.
-
2025-09-11historical
-
2025-07-10$179,900 Active
-
2025-07-07historical
-
2025-06-18status Active
-
2025-06-12status Active
-
2025-06-11status Pending
-
2025-06-10status Pending
-
2025-04-14$189,900 Active
-
2025-04-09$189,900 Active
-
2003-09-18soldstatus $93,500
ⓘ Source: listings_history table (triggers on properties + properties_extension) + one-shot
backfill from property_details.listing_events for pre-trigger history.
Tax reassessment forecast PA · Partial reset (capped growth)
- Current annual tax
- $3,028 · $252/mo
- Projected year-2 tax
- $3,028 · $252/mo
- Expected delta
- $0/yr ($0/mo · 0.0%)
ⓘ Screening estimate from a state-policy table — verify with the county assessor before closing.
Climate risk First Street
- Flood 1/10 Low FEMA zone X (unshaded) · 0% chance over 30 yrs
- Wildfire 4/10 Moderate
- Heat 2/10 Low 7 d/yr ≥91°F today · 15 d/yr by 30 yrs out
- Wind 4/10 Moderate 7% chance of damaging wind over 30 yrs
- Air quality 3/10 Moderate 1 unhealthy d/yr today · 4 by 30 yrs out
Nearby sold comps map
Loading sold comps map…
Walkable amenities ~0.75 mi
Loading nearby amenities…
Taxation est. · year 1
- Rental income
- $26,268
- − Mortgage interest
- −$10,027
- − Property taxes
- −$3,028
- − Insurance
- −$895
- − Repairs & maintenance
- −$2,101
- − Management
- −$2,101
- − HOA
- −$1,104
- − Depreciation
- −$5,207
- Taxable income
- $1,804
- Est. tax owed @ 24.0%
- −$433
- After-tax cash flow
- $4,028/yr
For passive investors: Depreciation is non-cash, so a rental often shows a tax loss while cash-flowing — sheltering income. Rental losses are passive: they offset passive income freely, and up to $25,000/yr can offset ordinary (W-2) income if you actively participate and your MAGI is under $100k (phasing out to $0 by $150k); unused losses carry forward. On sale, claimed depreciation is recaptured at up to 25%, and gains may owe capital-gains tax (a 1031 exchange can defer both). Figures are a year-1 estimate at your 24.0% rate — not tax advice; consult a CPA.
Schools (NCES district)
- District
- Jim Thorpe Area SD
- NCES district ID
- 4212540
- Math proficiency
- 25% ▼ -12.00%
- Reading proficiency
- 47% ▼ -11.00%
- Median HH income
- $53,476
- Composite
- 31.42/100
- National rank
- #5988
- State rank
- #394 of 539 in PA
Livability — Indian Mountain Lake
- Score
- 62/100
- State rank
- #1349
- US rank
- #16713
Category grades
Schools grade is shown separately in the Schools card above.
Census & demographics
- Census place
- Indian Mountain Lake, PA
- Population (ZIP)
- 7,879
Population outlook (Carbon County) Hauer SSP2
- Today (2025)
- 61,643 people
- By 2030
- 59,840 · -2.9%
- By 2040
- 55,413 · -10.1%
- By 2050
- 50,843 · -17.5%
- By 2075
- 43,326 · -29.7%
- By 2100
- 37,126 · -39.8%
Race, ethnicity, and origin ACS 2023
- Neighborhood character
- Predominantly White (69%)
- Race & ethnicity
- White 69% Hispanic / Latino 22% Two or more races 11% Black 6% Native American 1% Asian 1%
- Hispanic origin (detail)
- Puerto Rican 12% Cuban 2% Dominican 1%
- Common ancestry
- Romanian 8% Russian 4% Iranian 2%
- Foreign-born
- 12% · Canada
- Languages at home
- 81% English-only · Spanish 10% Russian/Polish/Slavic 7% Other Indo-European 1%
Political lean MEDSL · Carbon
- 2024 margin
- Solid R (+34.8) · D 32.2% · R 67.0%
- 2008→2024 swing
- -36.7pp toward R · 2008: 1.9pp · 2024: -34.8pp
- All cycles
- 2024: R+34.8 2020: R+32.0 2016: R+34.1 2012: R+6.9 2008: D+1.9
Not yet ingested
- Civics
- —
Market trends
- HPI YoY
- ▼ -2.89%
- Current HPI
- 203.8099
- Rent YoY
- —
- Metro
- —
- State GDP YoY
- ▲ 1.68%
- F500 in state
- 34
Industry mix (Fortune 500 HQ in PA)
| Industry | F500 HQs | Revenue |
|---|---|---|
| Healthcare | 2 | $309B |
|
||
| Insurance | 2 | $27B |
|
||
| Telecommunications / Media | 1 | $124B |
|
||
| Industrial Distribution | 1 | $22B |
|
||
| Financial Services | 1 | $20B |
|
||
| Chemicals / Materials | 1 | $18B |
|
||
Price history
+91.4% since first listed13 events — show timeline
- 2026-04-26 Relisted — PMAR
- 2026-04-22 Pending — PMAR
- 2026-02-26 Listed $179,000 PMAR
- 2025-09-11 Delisted — PMAR
- 2025-07-10 Listed $179,900 PMAR
- 2025-07-07 Listing Removed — BRIGHT MLS
- 2025-06-18 Relisted — BRIGHT MLS
- 2025-06-12 Relisted — PMAR
- 2025-06-11 Pending — BRIGHT MLS
- 2025-06-10 Pending — PMAR
- 2025-04-14 Listed $189,900 BRIGHT MLS
- 2025-04-09 Listed $189,900 PMAR
- 2003-09-18 Sold (Public Records) $93,500 Public Records
Property tax history
+1.7%/yrLatest (2026): $3,028 · +5.4% YoY. Source: county tax records.
Cash-flow waterfall
monthlySold comps — $/sqft
last 12 mo · ≤1 miLoading sold comps…