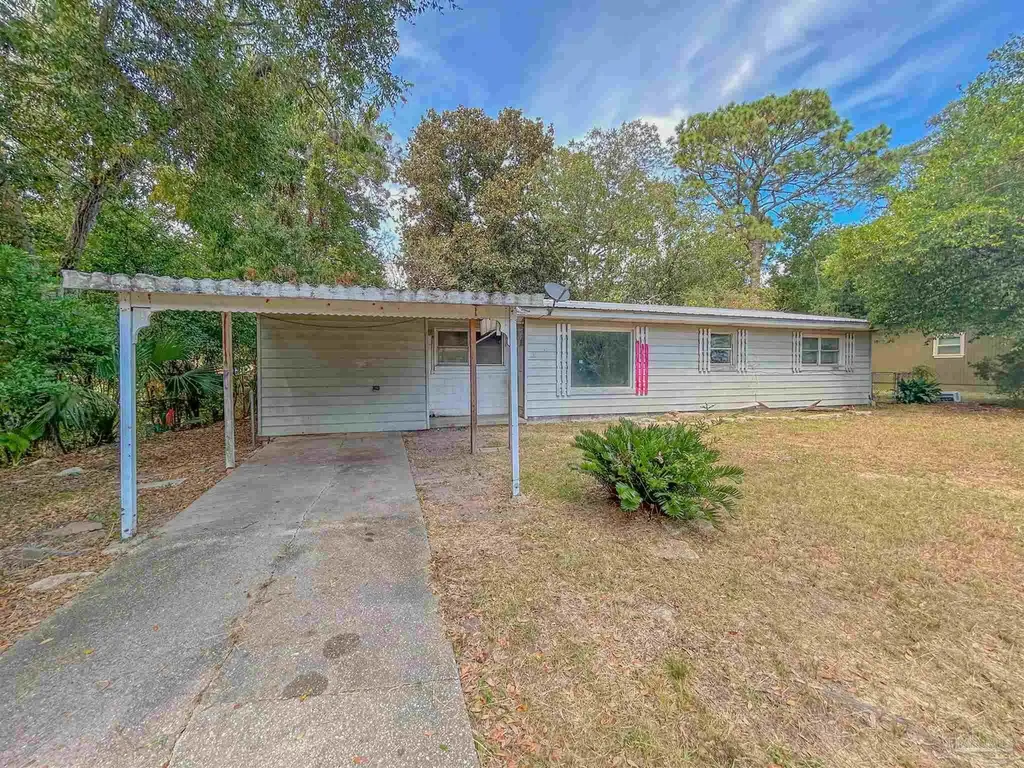
924 Cranbrook Ave · Brent, FL
Flood risk 1/10 · Minimal
- FEMA flood zone
- X (unshaded)
- Chance of flooding over 30 yrs
- 0.0%
- Est. flood insurance / yr
- $507 – $1,088
Fire risk 1/10 · Minimal
- Est. fire insurance / yr
- $947 – $1,759
Heat risk 10/10 · Severe
- Hot days now (above 105°F)
- 7 days/yr
- Hot days in 30 yrs
- 22 days/yr
Wind risk 9/10 · Severe
- Chance of severe wind over 30 yrs
- 99.0%
Air-quality risk 1/10 · Minimal
- Unhealthy air days now
- 0 days/yr
- Unhealthy air days in 30 yrs
- 0 days/yr
Risk factors via First Street. Map © Google.
Why this score? — see what drove the B grade
The composite is a weighted blend of 9 inputs, each scored 0–100. Each bar is that input's sub-score; the figure is the points it added to the 100-point composite (weight × sub-score).
- Cash flow +30.0/30.0
- 1% rule +10.0/10.0
- DSCR +10.0/10.0
- ARV discount +7.5/15.0
- Rent growth +3.7/5.0
- Schools +3.6/10.0
- Livability +3.5/5.0
- Condition / age +2.5/5.0
- Appreciation +0.0/10.0
$70,000
🖨 Deal sheet (PDF) 📄 Offer letter ✓ Due diligence
Listing remarks MLS
use your imagination and TLC to turn this house into your dreamhome. Converted garage and workshop shown as bonus rooms have been partially finished and could yield additional bedrooms or even a seperate apartment. A lot of solid home for the money, but home needs updating.
Key facts
- 9,343 sq ft lot
- Parking
- Built 1960
Neighborhood map
What this means for you Summary
Snapshot
- This is a 4-bed/2.0-bath single-family listed at $70k.
Deal economics
- At list price, monthly cash flow is $990 ($12k/yr) — positive.
- The deal already cash-flows at list — no discount required.
- Meets the 1% rule at list price ($2k rent vs $70k).
- Recommended offer: $69k (1.5% below list) — sets the bar for market timing.
- Cap rate 23.3% vs local median 6.6% in Brent — top-decile yield for the area; either an underpriced asset or a hidden risk that comps aren't pricing in. Stress-test before assuming the spread holds.
Location & tenants
- Location reads 69/100 on livability (#484 in FL) — a middle-class / working-renter tenant base. Strengths: cost of living A+, housing A+, health & safety A+; Watch: crime D, amenities F, commute F.
- Escambia (suburban): math 40% / reading 45% proficiency, ranked #56 of 73 in FL (top 77%) — families likely to look elsewhere, expect single-tenant / working-renter base with shorter leases.
- Market conditions: Rents rising fast (+4.9%/yr); 203 active listings in the ZIP; 8 comparable units currently listed for rent nearby; rentals at typical pace (median 25d on market — plan ~3-4 weeks tenant-placement turnaround); lower-income renter base — watch delinquency; 1,479 units permitted in Escambia County in 2024 (0 in 5+ unit buildings).
- At $1,960/mo this rent would consume 53% of the median local household income ($45k/yr) (locally 1458% of renters already pay >50% of income on rent) — very limited rent-growth headroom before tenants either downsize or default.
Forward outlook
- Local home prices are declining (-3.0%/yr); year-one equity from $484 of loan paydown is wiped out by about $2k of value loss. Plan a longer hold.
- Escambia County population projected at +13% by 2050 — modest demand growth; plan on rents tracking national, not racing it.
- At projected returns (-3.0% appreciation + 4.9% rent growth), your $20k cash investment doubles in ~2 years — after that, you're playing with house money.
Negotiation context
- It's been on market 16 days — a 2% lower offer ($69k) is reasonable based on typical stale-listing flexibility.
- 5 sale attempts since 26y ago with the ask held roughly flat each time — persistent listings suggest the price (not the market) is what's stuck; bring a comps-based counter.
- Current owner paid $48k; 46% above their basis — modest negotiation headroom, anchor on the comps not their cost.
Risks & watch-outs
- Watch-outs: property tax is 2.8% of price.
- Climate carrying-cost: severe wind risk, 99% chance of damaging wind over 30y; extreme-heat days projected 7→22/yr by 2055 (HVAC capex compounding) — expect insurance premiums to compound above CPI over the hold.
Questions for the listing agent
- Built in 1960 — when were the roof, HVAC, electrical panel, plumbing, and water heater last replaced?
- Property tax is high relative to price — has the assessment been appealed recently, and will the sale trigger a re-assessment?
- Is there a deadline driving the sale (1031 exchange, divorce, estate, relocation)? That informs how much negotiation room exists.
- Crime grade is D in this area — have there been break-ins, vandalism, or insurance claims at this property in the last 3 years? What carrier currently insures it and at what premium?
- What's the average days-on-market for RENTAL listings here right now (not sales)? A rising rental-DOM trend means longer vacancies and softer asking-rent achievability than the comps imply.
- What's the recent tenant-quality profile in this submarket — average credit score on applications, eviction rate, late-payment / NSF rate, and stable-employment percentage? A property-management company in the area should have these aggregated.
- How much new for-sale + rental construction is in the pipeline within 1–3 miles? Heavy new supply typically softens prices + rents 12–24 months out; constrained supply supports both.
Investment metrics
- 1% rule
- 2.80% ✓
- Cap rate
- 23.27%
- Cash-on-cash
- 60.63%
- DSCR
- 3.70
- GRM
- 3.0
CMA / ARV
- ARV (median comp)
- $188,282
- List price
- $70,000
- Delta
- -62.82%
- Verdict
- UNDERPRICED
- Comps
- 20 within 1.0 mi
Show comp detail 12 sales within ~0.75 mi
| Address | Dist | Beds/Ba | Sqft | Sold | Price | $/sf | Match |
|---|---|---|---|---|---|---|---|
| 5508 Glass Dr | 0.24mi | 3/2.0 (-1) | 1,768 (-0%) | 3mo | $223,000 | $126 | 81 |
| 5877 Somerset Dr | 0.57mi | 3/2.5 (-1) | 1,795 (+1%) | 3mo | $279,000 | $155 | 62 |
| 921 Lagoon Dr | 0.26mi | 3/1.5 (-1) | 1,546 (-13%) | 3mo | $244,700 | $158 | 57 |
| 5897 Somerset Dr | 0.58mi | 3/2.0 (-1) | 1,646 (-7%) | 1mo | $272,500 | $166 | 55 |
| 2601 Tinosa Cir | 0.70mi | 4/2.0 | 1,894 (+7%) | 2mo | $385,000 | $203 | 55 |
| 4607 Marseille Dr | 0.49mi | 4/3.0 | 1,638 (-8%) | 8mo | $245,000 | $150 | 54 |
| 2634 Tinosa Cir | 0.75mi | 3/2.0 (-1) | 1,711 (-4%) | 2mo | $324,900 | $190 | 52 |
| 4514 Florelle Way | 0.65mi | 4/2.0 | 1,650 (-7%) | 7mo | $180,000 | $109 | 52 |
| 6116 E Shore Dr | 0.36mi | 3/2.0 (-1) | 1,543 (-13%) | 6mo | $220,000 | $143 | 51 |
| 2626 Tinosa Cir | 0.70mi | 3/2.0 (-1) | 1,657 (-7%) | 6mo | $215,000 | $130 | 46 |
| 2016 Pin High Dr | 0.62mi | 3/2.0 (-1) | 1,944 (+10%) | 7mo | $307,500 | $158 | 44 |
| 220 Sand Trap Ln | 0.73mi | 3/2.0 (-1) | 2,041 (+15%) | 6mo | $305,000 | $149 | 31 |
Match score weights: distance 35% · size 25% · config 20% · recency 20%. Top-matched comps best support the ARV.
Projected returns pro-forma
-3.0% appreciation · 4.92% rent growth · sell at horizon
- IRR
- 61.7%
- Equity multiple
- 3.84×
- Total profit
- $55,666
- Equity at exit
- $10,437
- IRR
- 67.0%
- Equity multiple
- 8.47×
- Total profit
- $146,463
- Equity at exit
- $6,052
Cash invested: $19,600 (down + closing). Projections, not guarantees.
Landlord ↔ Tenant lean methodology
- Overall (STATE)
- 87 Strongly Landlord-Friendly
- State Florida
- 87 Strongly Landlord-Friendly · R+3
- County
- — inherits STATE
- City
- — inherits STATE
ZIP-level market 32505
- Home prices YoY
- -26.5%
- Rents YoY
- 4.9%
- Active inventory
- 203
- Price-to-rent
- 3.0×
Monthly cashflow live
- Estimated rent
- $1,960 high interval (Pro) →
- Mortgage (P&I)
- −$367
- Tax from tax record
- −$161 /mo · $1,938/yr
- Insurance
- −$29
- HOA
- −$0
- Vacancy / Maint / Mgmt
- −$412
- Net cashflow
- $990
Break-even live
Sensitivity live
| Price | -10% $1,030 | -5% $1,010 | +0% $990 | +5% $971 | +10% $951 |
|---|---|---|---|---|---|
| Rent | -10% $836 | -5% $913 | +0% $990 | +5% $1,068 | +10% $1,145 |
| Rate | -1.0pp $1,026 | -0.5pp $1,008 | base $990 | +0.5pp $972 | +1.0pp $954 |
UW: 25.0% down · 7.5% · 30yr · 1.5% tax · 5.0% vac · 8.0% maint · 8.0% mgmt
Financing live
Cash to close
- Down payment
- $17,500
- Closing costs
- $2,100
- Reserves months
- —
- Total cash needed
- —
Loan-product check · same deal, 3 products live
Conventional
25% down · 7.5% · 30yr
- Down + closing
- —
- Monthly P&I
- —
- Monthly cashflow
- —
- DSCR
- —
- Eligible?
- —
Personal DTI + credit; lowest rate.
DSCR
20% down · 8.5% · 30yr
- Down + closing
- —
- Monthly P&I
- —
- Monthly cashflow
- —
- DSCR
- —
- Eligible?
- —
No personal income docs; deal must DSCR.
Hard money
10% down · 12.0% · 12mo
- Down + closing
- —
- Monthly P&I
- —
- Monthly cashflow
- —
- DSCR
- —
- Eligible?
- —
Short-term bridge; refi at stabilization.
Rent comps 8 comps
| Address | Beds | Baths | Sqft | Rent | $/sqft | DOM | Units | Dist |
|---|---|---|---|---|---|---|---|---|
| 902 Lucerne Ave Pensacola, FL | 3.0 | 2.0 | 1276 | $1,600 | $1.25 | 24d | 1 | 0.38mi |
| 2143 Yardley Cir Pensacola, FL | 3.0 | 2.0 | 1725 | $2,300 | $1.33 | 15d | 1 | 0.52mi |
| 918 Fremont Ave Pensacola, FL | 3.0 | 1.0 | 1756 | $1,450 | $0.83 | 15d | 1 | 0.55mi |
| 2121 Pin High Dr Pensacola, FL | 3.0 | 2.5 | 1918 | $2,065 | $1.08 | 24d | 1 | 0.80mi |
| 5877 Tryton Cir Pensacola, FL | 4.0 | 2.0 | 1419 | $1,825 | $1.29 | 24d | 1 | 0.97mi |
| 6111 Enterprise Dr Pensacola, FL | 1.0–3.0 | 1.0–2.0 | 1224 | $1,688 | $1.38 | 15d | 19 | 1.23mi |
| 3177 Two Sisters Way Pensacola, FL | 4.0 | 2.5 | 2244 | $1,975 | $0.88 | 24d | 1 | 1.38mi |
| 3296 Two Sisters Way Pensacola, FL | 4.0 | 2.5 | 1856 | $1,795 | $0.97 | 24d | 1 | 1.40mi |
Listing history 18 events
-
2026-06-10days on market $70,000 Active 16 DOM
-
2026-06-09days on market $70,000 Active 15 DOM
-
2026-06-08days on market $70,000 Active 14 DOM
-
2026-06-07days on market $70,000 Active 13 DOM
-
2026-06-03days on market $70,000 Active 9 DOM
-
2026-06-02days on market $70,000 Active 8 DOM
-
2026-06-01days on market $70,000 Active 7 DOM
-
2026-05-31days on market $70,000 Active 6 DOM
-
2026-05-31statusdays on market $70,000 Active 5 DOM
-
2026-05-15$70,000 Active 139-char remark
-
2026-02-12historical
-
2025-09-26status Pending
-
2025-09-24$69,900 Active
-
2003-04-02soldstatus $47,900
-
2003-02-21soldstatus $47,900
Show marketing remark (274 chars)
use your imagination and TLC to turn this house into your dreamhome. Converted garage and workshop shown as bonus rooms have been partially finished and could yield additional bedrooms or even a seperate apartment. A lot of solid home for the money, but home needs updating.
-
2001-06-27$49,900
Show marketing remark (274 chars)
use your imagination and TLC to turn this house into your dreamhome. Converted garage and workshop shown as bonus rooms have been partially finished and could yield additional bedrooms or even a seperate apartment. A lot of solid home for the money, but home needs updating.
-
2001-05-25historical
-
2000-07-03$56,000
ⓘ Source: listings_history table (triggers on properties + properties_extension) + one-shot
backfill from property_details.listing_events for pre-trigger history.
Tax reassessment forecast FL · Resets to sale price
- Current annual tax
- $1,938 · $161/mo
- Projected year-2 tax
- $1,938 · $161/mo
- Expected delta
- $0/yr ($0/mo · 0.0%)
ⓘ Screening estimate from a state-policy table — verify with the county assessor before closing.
Climate risk First Street
- Flood 1/10 Low FEMA zone X (unshaded) · 0% chance over 30 yrs
- Wildfire 1/10 Low
- Heat 10/10 Extreme 7 d/yr ≥105°F today · 22 d/yr by 30 yrs out
- Wind 9/10 Extreme 99% chance of damaging wind over 30 yrs
- Air quality 1/10 Low 0 unhealthy d/yr today · 0 by 30 yrs out
Nearby sold comps map
Loading sold comps map…
Walkable amenities ~0.75 mi
Loading nearby amenities…
Taxation est. · year 1
- Rental income
- $23,515
- − Mortgage interest
- −$3,921
- − Property taxes
- −$1,938
- − Insurance
- −$350
- − Repairs & maintenance
- −$1,881
- − Management
- −$1,881
- − Depreciation
- −$2,036
- Taxable income
- $11,508
- Est. tax owed @ 24.0%
- −$2,762
- After-tax cash flow
- $9,122/yr
For passive investors: Depreciation is non-cash, so a rental often shows a tax loss while cash-flowing — sheltering income. Rental losses are passive: they offset passive income freely, and up to $25,000/yr can offset ordinary (W-2) income if you actively participate and your MAGI is under $100k (phasing out to $0 by $150k); unused losses carry forward. On sale, claimed depreciation is recaptured at up to 25%, and gains may owe capital-gains tax (a 1031 exchange can defer both). Figures are a year-1 estimate at your 24.0% rate — not tax advice; consult a CPA.
Schools (NCES district)
- District
- Escambia
- NCES district ID
- 1200510
- Math proficiency
- 40% ▼ -9.00%
- Reading proficiency
- 45% ▼ -4.00%
- Median HH income
- $44,649
- Composite
- 36.04/100
- National rank
- #4773
- State rank
- #56 of 73 in FL
Livability — Brent
- Score
- 69/100
- State rank
- #484
- US rank
- #8921
Category grades
Schools grade is shown separately in the Schools card above.
Census & demographics
- Census place
- Brent, FL
- County
- Escambia County · 301,722 people
- City population
- 27,543
- Metro
- Pensacola-Ferry Pass-Brent, FL
- Population (ZIP)
- 27,877
- Household income
- $44,783
- Rent vs Own
- Severe rent burden
- 1458.0
Population outlook (Escambia County) Hauer SSP2
- Today (2025)
- 334,637 people
- By 2030
- 345,779 · +3.3%
- By 2040
- 364,828 · +9.0%
- By 2050
- 378,514 · +13.1%
- By 2075
- 403,220 · +20.5%
- By 2100
- 386,125 · +15.4%
Race, ethnicity, and origin ACS 2023
- Neighborhood character
- Diverse neighborhood (Simpson 0.66)
- Race & ethnicity
- Black 48% White 32% Hispanic / Latino 11% Two or more races 9% Asian 2%
- Hispanic origin (detail)
- Mexican 5% Cuban 2%
- Common ancestry
- Slovak 2% Italian 1% Serbian 1%
- Foreign-born
- 9% · Canada, Vietnam
- Languages at home
- 87% English-only · Spanish 9% Other Indo-European 1% Vietnamese 1%
Political lean MEDSL · Escambia
- 2024 margin
- R (+19.5) · D 39.7% · R 59.2% · Other 1.1%
- 2008→2024 swing
- -0.2pp no change · 2008: -19.3pp · 2024: -19.5pp
- All cycles
- 2024: R+19.5 2020: R+15.1 2016: R+20.6 2012: R+20.6 2008: R+19.3
Not yet ingested
- Civics
- —
Market trends
- HPI YoY
- ▼ -74.10%
- Current HPI
- 205.45
- Rent YoY
- ▲ 4.92%
- Metro
- Pensacola-Ferry Pass-Brent, FL
- State GDP YoY
- ▲ 3.28%
- F500 in state
- 36
Industry mix (Fortune 500 HQ in FL)
| Industry | F500 HQs | Revenue |
|---|---|---|
| Industrial Technology | 2 | $29B |
|
||
| Insurance | 2 | $17B |
|
||
| Retail | 1 | $60B |
|
||
| Technology Distribution | 1 | $58B |
|
||
| Homebuilding | 1 | $35B |
|
||
| Technology Manufacturing | 1 | $35B |
|
||
Price history
+25.0% since first listed12 events — show timeline
- 2026-06-13 Listing Removed — PARMLS
- 2026-05-29 Relisted — PARMLS
- 2026-05-19 Pending — PARMLS
- 2026-05-15 Listed $70,000 PARMLS
- 2026-02-12 Listing Removed — PARMLS
- 2025-09-26 Pending — PARMLS
- 2025-09-24 Listed $69,900 PARMLS
- 2003-04-02 Sold (Public Records) $47,900 Public Records
- 2003-02-21 Sold (MLS) $47,900 PARMLS
- 2001-06-27 Listed $49,900 PARMLS
- 2001-05-25 Listing Removed — PARMLS
- 2000-07-03 Listed $56,000 PARMLS
Property tax history
+7.8%/yrLatest (2025): $1,938 · +15.9% YoY. Source: county tax records.
Cash-flow waterfall
monthlySold comps — $/sqft
last 12 mo · ≤1 miLoading sold comps…