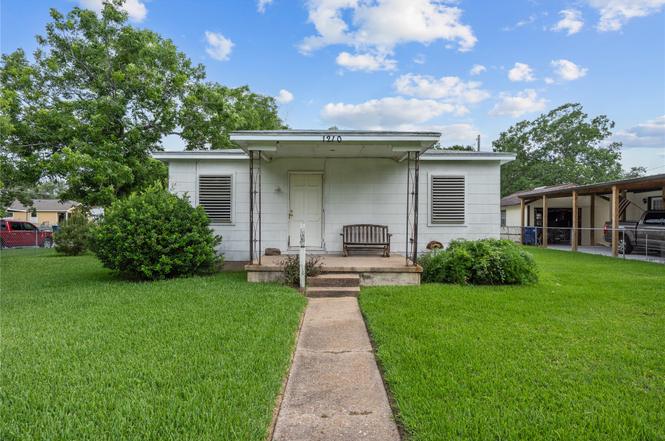
1210 10th Ave N · Texas City, TX
Flood risk 8/10 · Major
- FEMA flood zone
- X
- Chance of flooding over 30 yrs
- 0.75%
- Est. flood insurance / yr
- $507 – $1,088
Fire risk 1/10 · Minimal
- Est. fire insurance / yr
- $1,222 – $2,270
Heat risk 9/10 · Severe
- Hot days now (above 108°F)
- 2 days/yr
- Hot days in 30 yrs
- 9 days/yr
Wind risk 10/10 · Severe
- Chance of severe wind over 30 yrs
- 99.0%
Air-quality risk 2/10 · Minimal
- Unhealthy air days now
- 2 days/yr
- Unhealthy air days in 30 yrs
- 2 days/yr
Risk factors via First Street. Map © Google.
Why this score? — see what drove the C+ grade
The composite is a weighted blend of 9 inputs, each scored 0–100. Each bar is that input's sub-score; the figure is the points it added to the 100-point composite (weight × sub-score).
- Cash flow +21.6/30.0
- ARV discount +15.0/15.0
- 1% rule +7.9/10.0
- DSCR +6.9/10.0
- Rent growth +3.7/5.0
- Livability +3.1/5.0
- Condition / age +2.5/5.0
- Schools +2.4/10.0
- Appreciation +0.0/10.0
$99,999
🖨 Deal sheet 📄 Offer letter ✓ Due diligence
Listing remarks
Investor Special in the Heart of Texas City! Opportunity awaits at 1210 10th Ave N, Texas City! This 3-bedroom, 1-bath home sits on a spacious lot and offers tremendous potential for investors, flippers, landlords, or buyers looking for their next renovation project. The property features a detached 2-car garage, covered front porch, original hardwood flooring in portions of the home, and a functional floor plan ready for updates and improvements. Conveniently located near schools, shopping, and dining. This property provides easy access to both local amenities and employment centers. Whether you're looking to renovate and resell, add to your rental portfolio, or create your own vision,
Key facts
- Covered front porch
- 7,875 sq ft lot
- 2 garage spots
Tags
Property features AI
Finance
- Other: Seller disclosure available
Exterior
- Parking: Detached garage and driveway providing 2 garage spaces
- Utilities: Public water; Public sewer
- Home design: Residential property; Built in 1944; Pillar/post/pier foundation
- Construction: Composition roof; Construction materials: Unknown
- Exterior features: Corner lot
Interior
- Bedrooms: Three bedrooms on the first floor (approx. 14' x 9'3", 11' x 9', and 11' x 12")
- Bathrooms: One full bathroom
- Heating & cooling: Central electric heating; Central electric air conditioning
- Interior features: 3 total rooms
Neighborhood map
What this means for you Summary
Snapshot
- This is a 3-bed/1.0-bath single-family listed at $100k.
Deal economics
- At list price, monthly cash flow is $85 ($1k/yr) — positive.
- The deal already cash-flows at list — no discount required.
- Meets the 1% rule at list price ($1k rent vs $100k).
- Cap rate 8.1% vs local median 4.3% in Texas City — top-decile yield for the area; either an underpriced asset or a hidden risk that comps aren't pricing in. Stress-test before assuming the spread holds.
Location & tenants
- Location reads 62/100 on livability (#907 in TX) — a middle-class / working-renter tenant base. Strengths: cost of living A+, housing A+; Watch: crime D+, amenities F, commute F.
- Texas City ISD (suburban): math 28% / reading 29% proficiency, ranked #655 of 826 in TX (top 79%) — low school quality limits family demand, transient renter base, plan for 1-2y turnover; 66% free/reduced lunch — lower-income household profile, screen leases tightly.
- Zoned schools: Blocker Middle (math 33% / reading 36%, grade F, #858 of 1,662 statewide, top 54%, 865 students, 80% FRL); Texas City H S (math 32% / reading 36%, grade F, #1,002 of 1,632 statewide, top 62%, 1,718 students, 72% FRL).
- Market conditions: Rents rising fast (+4.9%/yr); 292 active listings in the ZIP; 25 comparable units currently listed for rent nearby; rentals at typical pace (median 21d on market — plan ~3-4 weeks tenant-placement turnaround); 3,258 units permitted in Galveston County in 2024 (0 in 5+ unit buildings).
Forward outlook
- Local home prices are declining (-3.0%/yr); year-one equity from $691 of loan paydown is wiped out by about $3k of value loss. Plan a longer hold.
- Galveston County population projected at +43% by 2050 — long-run rental-demand tailwind backs the buy-and-hold thesis.
Negotiation context
- Only 3 days on market — expect competitive offers; lowballing is unlikely to land.
Risks & watch-outs
- Watch-outs: property tax is 3.6% of price; flood insurance adds $66/mo; built in 1944 — expect roof / HVAC / electrical / plumbing capex.
- Climate carrying-cost: severe flood risk; severe wind risk, 99% chance of damaging wind over 30y; extreme-heat days projected 2→9/yr by 2055 (HVAC capex compounding) — expect insurance premiums to compound above CPI over the hold.
Questions for the listing agent
- Built in 1944 — when were the roof, HVAC, electrical panel, plumbing, and water heater last replaced?
- Property tax is high relative to price — has the assessment been appealed recently, and will the sale trigger a re-assessment?
- What's the actual annual flood-insurance premium (NFIP or private), and is the property in a SFHA with mandatory coverage?
- Is there a deadline driving the sale (1031 exchange, divorce, estate, relocation)? That informs how much negotiation room exists.
- Schools are F-rated, which usually means shorter tenancies and higher turnover. Who's the typical renter profile here, and what's been the actual vacancy rate?
- Crime grade is D in this area — have there been break-ins, vandalism, or insurance claims at this property in the last 3 years? What carrier currently insures it and at what premium?
- What's the average days-on-market for RENTAL listings here right now (not sales)? A rising rental-DOM trend means longer vacancies and softer asking-rent achievability than the comps imply.
- What's the recent tenant-quality profile in this submarket — average credit score on applications, eviction rate, late-payment / NSF rate, and stable-employment percentage? A property-management company in the area should have these aggregated.
- How much new for-sale + rental construction is in the pipeline within 1–3 miles? Heavy new supply typically softens prices + rents 12–24 months out; constrained supply supports both.
Investment metrics
- 1% rule
- 1.29% ✓
- Cap rate
- 8.11%
- Cash-on-cash
- 6.50%
- DSCR
- 1.29
- GRM
- 6.5
CMA / ARV
- ARV (on-the-fly)
- $138,754
- Comps found
- 12
Show comp detail 12 sales within ~0.75 mi
| Address | Dist | Beds/Ba | Sqft | Sold | Price | $/sf | Match |
|---|---|---|---|---|---|---|---|
| 706 13th St N | 0.16mi | 3/1.0 | 920 (+2%) | 2mo | $156,000 | $170 | 87 |
| 1109 11th St N | 0.22mi | 3/1.0 | 972 (+8%) | 10mo | $150,000 | $154 | 68 |
| 1412 13th Ave N | 0.25mi | 2/1.0 (-1) | 903 (+0%) | 19mo | $129,900 | $144 | 68 |
| 1706 3rd Ave N | 0.62mi | 3/1.0 | 942 (+5%) | 2mo | $149,000 | $158 | 62 |
| 1205 Abbott Dr | 0.19mi | 2/1.0 (-1) | 816 (-9%) | 18mo | $80,000 | $98 | 56 |
| 1406 4th Ave N | 0.41mi | 3/1.0 | 1,032 (+14%) | 3mo | $99,900 | $97 | 54 |
| 908 19th Ave N | 0.70mi | 3/1.5 | 936 (+4%) | 8mo | $189,900 | $203 | 52 |
| 723 10th Ave N | 0.49mi | 3/1.0 | 973 (+8%) | 15mo | $153,000 | $157 | 52 |
| 1103 Abbott Dr | 0.26mi | 2/1.0 (-1) | 814 (-10%) | 20mo | $149,000 | $183 | 50 |
| 822 1st Ave N | 0.75mi | 3/2.0 | 900 (-0%) | 13mo | $71,000 | $79 | 50 |
| 1521 15th Ave N | 0.41mi | 2/1.0 (-1) | 1,036 (+15%) | 6mo | $105,000 | $101 | 46 |
| 714 6th Ave N | 0.56mi | 2/1.0 (-1) | 988 (+10%) | 17mo | $120,000 | $121 | 38 |
Match score weights: distance 35% · size 25% · config 20% · recency 20%. Top-matched comps best support the ARV.
Projected returns pro-forma
-3.0% appreciation · 4.91% rent growth · sell at horizon
- IRR
- -7.6%
- Equity multiple
- 0.71×
- Total profit
- $-8,086
- Equity at exit
- $14,910
- IRR
- 5.0%
- Equity multiple
- 1.41×
- Total profit
- $11,415
- Equity at exit
- $8,646
Cash invested: $28,000 (down + closing). Projections, not guarantees.
Landlord ↔ Tenant lean methodology
- Overall (STATE)
- 87 Strongly Landlord-Friendly
- State Texas
- 87 Strongly Landlord-Friendly · R+5
- County
- — inherits STATE
- City
- — inherits STATE
ZIP-level market 77590
- Home prices YoY
- -19.3%
- Rents YoY
- 4.9%
- Active inventory
- 292
- Price-to-rent
- 6.5×
Monthly cashflow live
- Estimated rent
- $1,291 high interval (Pro) →
- Mortgage (P&I)
- −$524
- Tax from tax record
- −$302 /mo · $3,627/yr
- Insurance
- −$42
- Flood insurance flood zone
- −$66 /mo · $798/yr
- HOA
- −$0
- Vacancy / Maint / Mgmt
- −$271
- Net cashflow
- $85
Break-even live
UW: 25.0% down · 7.5% · 30yr · 1.5% tax · 5.0% vac · 8.0% maint · 8.0% mgmt
Financing live
Cash to close
- Down payment
- $25,000
- Closing costs
- $3,000
- Reserves months
- —
- Total cash needed
- —
Loan-product check · same deal, 3 products live
Conventional
25% down · 7.5% · 30yr
- Down + closing
- —
- Monthly P&I
- —
- Monthly cashflow
- —
- DSCR
- —
- Eligible?
- —
Personal DTI + credit; lowest rate.
DSCR
20% down · 8.5% · 30yr
- Down + closing
- —
- Monthly P&I
- —
- Monthly cashflow
- —
- DSCR
- —
- Eligible?
- —
No personal income docs; deal must DSCR.
Hard money
10% down · 12.0% · 12mo
- Down + closing
- —
- Monthly P&I
- —
- Monthly cashflow
- —
- DSCR
- —
- Eligible?
- —
Short-term bridge; refi at stabilization.
Rent comps 25 comps
| Address | Beds | Baths | Sqft | Rent | $/sqft | DOM | Units | Dist |
|---|---|---|---|---|---|---|---|---|
| 1228 6th Ave N Unit 1 Texas City, TX | 2.0 | 1.0 | 847 | $945 | $1.12 | 12d | 1 | 0.25mi |
| 1116 11th St N Texas City, TX | 2.0 | 1.0 | 1075 | $1,129 | $1.05 | 43d | 1 | 0.26mi |
| 1001 9th Ave N Texas City, TX | 2.0 | 1.0 | 814 | $1,250 | $1.54 | 43d | 1 | 0.31mi |
| 1028 5th Ave N Unit 1 Texas City, TX | 2.0 | 1.0 | 847 | $945 | $1.12 | 12d | 1 | 0.37mi |
| 626 8th Ave N Texas City, TX | 2.0 | 1.5 | 1000 | $1,275 | $1.27 | 17d | 2 | 0.56mi |
| 1112 1st Ave N Texas City, TX | 2.0 | 1.0 | 847 | $945 | $1.12 | 22d | 1 | 0.57mi |
| 1114 1st Ave N Texas City, TX | 2.0 | 1.0 | 847 | $945 | $1.12 | 22d | 1 | 0.57mi |
| 729 5th Ave N Texas City, TX | 2.0 | 1.0 | 675 | $826 | $1.22 | 43d | 1 | 0.57mi |
| 1919 13th Ave N Texas City, TX | 1.0–3.0 | 1.0–2.0 | 950 | $1,499 | $1.58 | 2d | 6 | 0.66mi |
| 701 22nd Ave N Texas City, TX | 3.0 | 2.0 | 1011 | $1,386 | $1.37 | 43d | 1 | 0.89mi |
| 2202 16th Ave N Texas City, TX | 2.0 | 1.5 | 860 | $975 | $1.13 | 11d | 4 | 0.94mi |
| 422 19th Ave N Texas City, TX | 2.0 | 1.0 | 900 | $1,400 | $1.56 | 43d | 1 | 0.97mi |
| 221 18th Ave N Texas City, TX | 3.0 | 1.0 | 1040 | $1,550 | $1.49 | 12d | 1 | 1.05mi |
| 813 Bay St N Texas City, TX | 2.0–3.0 | 1.0–1.5 | 1010 | $1,420 | $1.41 | 1d | 9 | 1.13mi |
| 24 1st St N Texas City, TX | 3.0 | 1.0 | 940 | $1,250 | $1.33 | 43d | 1 | 1.28mi |
| 2608 21st St N Texas City, TX | 3.0 | 2.0 | 974 | $1,400 | $1.44 | 43d | 1 | 1.31mi |
| 2701 13th Ave N Unit E-E6 Texas City, TX | 2.0 | 1.0 | 811 | $1,137 | $1.40 | 20d | 1 | 1.33mi |
| 2701 13th Ave N Unit K-K3 Texas City, TX | 2.0 | 1.0 | 811 | $1,099 | $1.36 | 20d | 1 | 1.33mi |
| 2701 13th Ave N Unit J-J3 Texas City, TX | 2.0 | 1.0 | 811 | $1,287 | $1.59 | 19d | 1 | 1.33mi |
| 2701 13th Ave N Unit C-C3 Texas City, TX | 2.0 | 1.0 | 811 | $1,189 | $1.47 | 20d | 1 | 1.33mi |
| 2701 13th Ave N Unit H-H3 Texas City, TX | 2.0 | 1.0 | 811 | $1,250 | $1.54 | 20d | 1 | 1.33mi |
| 2701 13th Ave N Unit C-C12 Texas City, TX | 2.0 | 1.0 | 811 | $1,222 | $1.51 | 20d | 1 | 1.33mi |
| 2701 13th Ave N Unit B-B6 Texas City, TX | 2.0 | 1.0 | 811 | $1,239 | $1.53 | 2d | 1 | 1.33mi |
| 2707 13th Ave N Texas City, TX | 2.0 | 1.0 | 811 | $1,257 | $1.55 | 43d | 1 | 1.34mi |
| 2602 21st St N Texas City, TX | 1.0–3.0 | 1.0–2.0 | 768 | $1,450 | $1.89 | 1d | 44 | 1.36mi |
Listing history 4 events
-
2026-06-18days on market $99,999 Active 3 DOM
-
2026-06-17days on market $99,999 Active 2 DOM
-
2026-06-16remarks 699-char remark
-
2026-06-16$99,999 Active 1 DOM
ⓘ Source: listings_history table (triggers on properties + properties_extension) + one-shot
backfill from property_details.listing_events for pre-trigger history.
Tax reassessment forecast TX · Resets to sale price
- Current annual tax
- $3,627 · $302/mo
- Projected year-2 tax
- $3,627 · $302/mo
- Expected delta
- $0/yr ($0/mo · 0.0%)
ⓘ Screening estimate from a state-policy table — verify with the county assessor before closing.
Climate risk First Street
- Flood 8/10 Severe FEMA zone X · 75% chance over 30 yrs
- Wildfire 1/10 Low
- Heat 9/10 Extreme 2 d/yr ≥108°F today · 9 d/yr by 30 yrs out
- Wind 10/10 Extreme 99% chance of damaging wind over 30 yrs
- Air quality 2/10 Low 2 unhealthy d/yr today · 2 by 30 yrs out
Nearby sold comps map
Loading sold comps map…
Walkable amenities ~0.75 mi
Loading nearby amenities…
Taxation est. · year 1
- Rental income
- $15,492
- − Mortgage interest
- −$5,601
- − Property taxes
- −$3,627
- − Insurance
- −$1,297
- − Repairs & maintenance
- −$1,239
- − Management
- −$1,239
- − Depreciation
- −$2,909
- Taxable loss
- −$422
- Est. tax savings @ 24.0%
- +$101
- After-tax cash flow
- $1,123/yr
For passive investors: Depreciation is non-cash, so a rental often shows a tax loss while cash-flowing — sheltering income. Rental losses are passive: they offset passive income freely, and up to $25,000/yr can offset ordinary (W-2) income if you actively participate and your MAGI is under $100k (phasing out to $0 by $150k); unused losses carry forward. On sale, claimed depreciation is recaptured at up to 25%, and gains may owe capital-gains tax (a 1031 exchange can defer both). Figures are a year-1 estimate at your 24.0% rate — not tax advice; consult a CPA.
Schools (NCES district)
- District
- Texas City ISD
- NCES district ID
- 4842510
- Math proficiency
- 28% ▼ -10.00%
- Reading proficiency
- 29% ▼ -4.00%
- Median HH income
- $44,875
- Composite
- 24.47/100
- National rank
- #7664
- State rank
- #655 of 826 in TX
Livability — Texas City
- Score
- 62/100
- State rank
- #907
- US rank
- #16268
Category grades
Schools grade is shown separately in the Schools card above.
Census & demographics
- Census place
- Texas City, TX
- County
- Galveston County · 357,330 people
- City population
- 49,936
- Metro
- Houston-The Woodlands-Sugar Land, TX
- Population (ZIP)
- 31,642
- Household income
- $65,801
- Rent vs Own
- Severe rent burden
- 1821.0
Population outlook (Galveston County) Hauer SSP2
- Today (2025)
- 390,640 people
- By 2030
- 425,226 · +8.9%
- By 2040
- 493,765 · +26.4%
- By 2050
- 559,698 · +43.3%
- By 2075
- 719,260 · +84.1%
- By 2100
- 819,628 · +109.8%
Race, ethnicity, and origin ACS 2023
- Neighborhood character
- Diverse neighborhood (Simpson 0.66)
- Race & ethnicity
- White 41% Hispanic / Latino 38% Two or more races 20% Black 17% Asian 2%
- Hispanic origin (detail)
- Mexican 33% Puerto Rican 1%
- Common ancestry
- Lithuanian 2% Slovak 1% Italian 1%
- Foreign-born
- 9% · Canada, Vietnam
- Languages at home
- 72% English-only · Spanish 26% Other Indo-European 1%
Political lean MEDSL · Galveston
- 2024 margin
- Strong R (+27.4) · D 35.7% · R 63.1% · Other 1.2%
- 2008→2024 swing
- -7.9pp toward R · 2008: -19.5pp · 2024: -27.4pp
- All cycles
- 2024: R+27.4 2020: R+22.6 2016: R+22.6 2012: R+26.9 2008: R+19.5
Not yet ingested
- Civics
- —
Market trends
- HPI YoY
- ▼ -58.35%
- Current HPI
- 244.5809
- Rent YoY
- ▲ 4.91%
- Metro
- Houston-The Woodlands-Sugar Land, TX
- State GDP YoY
- ▲ 3.95%
- F500 in state
- 110
Industry mix (Fortune 500 HQ in TX)
| Industry | F500 HQs | Revenue |
|---|---|---|
| Energy | 16 | $1,198B |
|
||
| Technology | 5 | $198B |
|
||
| Engineering / Construction | 4 | $72B |
|
||
| Energy Services | 3 | $60B |
|
||
| Utilities | 3 | $41B |
|
||
| Healthcare | 2 | $330B |
|
||
Price history
1 event — show timeline
- 2026-06-15 Listed $99,999 HARMLS
Property tax history
+14.8%/yrLatest (2025): $3,627 · +16.0% YoY. Source: county tax records.
Cash-flow waterfall
monthlySold comps — $/sqft
last 12 mo · ≤1 miLoading sold comps…