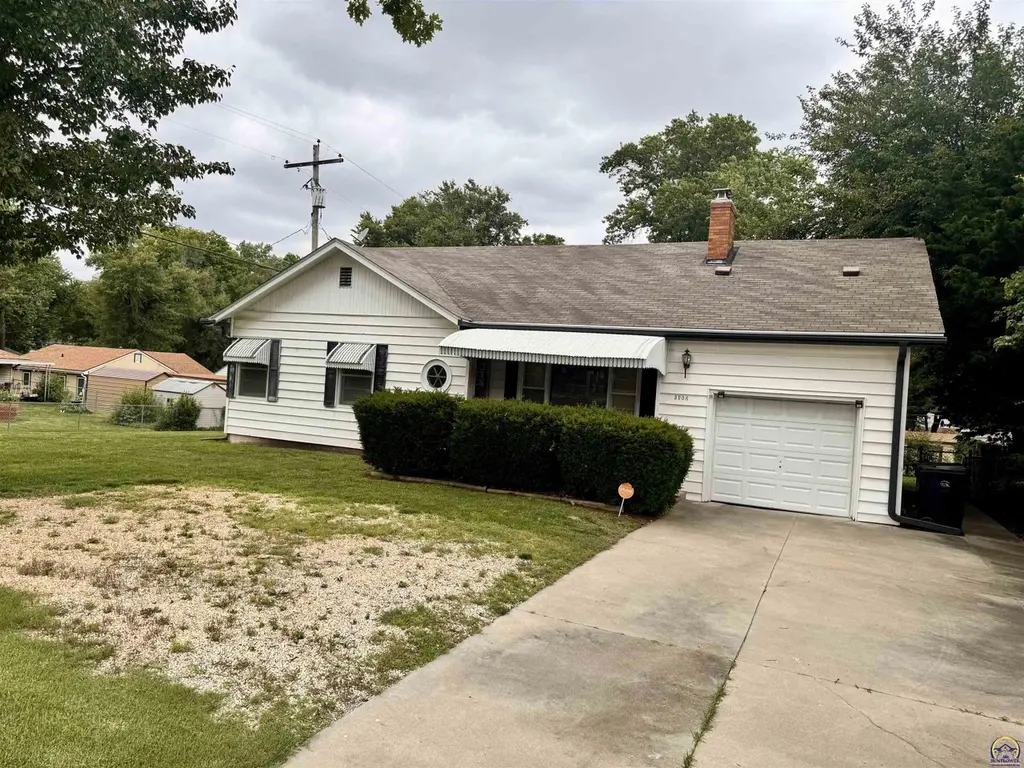
3206 SW 10th Ave · Topeka, KS
Flood risk 1/10 · Minimal
- FEMA flood zone
- X (unshaded)
- Chance of flooding over 30 yrs
- 0.0%
- Est. flood insurance / yr
- $473 – $860
Fire risk 1/10 · Minimal
- Est. fire insurance / yr
- $1,154 – $2,142
Heat risk 5/10 · Moderate
- Hot days now (above 107°F)
- 7 days/yr
- Hot days in 30 yrs
- 17 days/yr
Wind risk 2/10 · Minimal
- Chance of severe wind over 30 yrs
- —
Air-quality risk 2/10 · Minimal
- Unhealthy air days now
- 1 days/yr
- Unhealthy air days in 30 yrs
- 2 days/yr
Risk factors via First Street. Map © Google.
Why this score? — see what drove the D+ grade
The composite is a weighted blend of 9 inputs, each scored 0–100. Each bar is that input's sub-score; the figure is the points it added to the 100-point composite (weight × sub-score).
- Cash flow +14.0/30.0
- ARV discount +13.8/15.0
- DSCR +4.2/10.0
- 1% rule +3.7/10.0
- Rent growth +3.6/5.0
- Livability +3.5/5.0
- Condition / age +2.5/5.0
- Schools +1.7/10.0
- Appreciation +0.0/10.0
$187,500
🖨 Deal sheet 📄 Offer letter ✓ Due diligence
Listing remarks MLS
Check out this Smart Home by Vivint security system with key-less entry. You can control your outlets, thermostat, and garage door all from the touch of your phone! This spacious ranch has hard wood floors, extra large bedrooms, and has recently a large deck.
Key facts
- Hardwood floors
- 0.23 acre lot
- Garage
Tags
Property features AI
Exterior
- Parking: Attached garage (1 car)
- Utilities: Public water; Public sewer
- Home design: Single family residence; One and one-half stories; Vinyl siding; Located in the Monteith Place subdivision
- Construction: Vinyl siding construction
- Exterior features: Fenced yard; Composition roof
Interior
- Kitchen: Gas range; Refrigerator; Disposal
- Flooring: Hardwood; Vinyl; Ceramic tile
- Bathrooms: 2 full bathrooms
- Heating & cooling: Central air; Window unit(s)
- Interior features: Eat-in kitchen; Gas fireplace
- Laundry & utility: Laundry in basement; Gas water heater
Neighborhood map
What this means for you Summary
Snapshot
- This is a 3-bed/2.0-bath single-family listed at $188k.
Deal economics
- At list price, monthly cash flow is $25 ($294/yr) — positive.
- The deal already cash-flows at list — no discount required.
- To meet the 1% rule (rent ≥ 1% of price), the offer needs to be $164k (12.7% below list).
- Recommended offer: $164k (12.7% below list) — sets the bar for 1% rule.
- Cap rate 6.4% vs local median 4.3% in Topeka — top-decile yield for the area; either an underpriced asset or a hidden risk that comps aren't pricing in. Stress-test before assuming the spread holds.
Location & tenants
- Location reads 69/100 on livability (#195 in KS) — a middle-class / working-renter tenant base. Strengths: cost of living A+, housing A+, health & safety A+; Watch: employment C-, crime F, commute F.
- Topeka Public Schools (urban): math 17% / reading 23% proficiency, ranked #158 of 169 in KS (top 94%) — low school quality limits family demand, transient renter base, plan for 1-2y turnover; 69% free/reduced lunch — lower-income household profile, screen leases tightly.
- Zoned schools: Landon Middle School (math 15% / reading 27%, grade F, #142 of 219 statewide, top 65%, 457 students, 68% FRL); Topeka West High (math 13% / reading 20%, grade F, #244 of 327 statewide, top 75%, 1,085 students, 59% FRL) — zoned schools at 64% FRL track the district average.
- Market conditions: Rents rising fast (+4.4%/yr); 130 active listings in the ZIP; 3 comparable units currently listed for rent nearby; rentals at typical pace (median 21d on market — plan ~3-4 weeks tenant-placement turnaround); 219 units permitted in Shawnee County in 2024 (25 in 5+ unit buildings).
- This rent runs 32% of the median local income ($61k/yr) — at the standard rent-burdened threshold; future hikes will face affordability resistance.
Forward outlook
- Local home prices are declining (-3.0%/yr); year-one equity from $1k of loan paydown is wiped out by about $6k of value loss. Plan a longer hold.
- Shawnee County population projected to shrink 7% by 2050 — rents likely to lag national; underwrite the cash flow, not the appreciation.
Negotiation context
- Only 14 days on market — expect competitive offers; lowballing is unlikely to land.
- 2 sale attempts since 8y ago with the ask held roughly flat each time — persistent listings suggest the price (not the market) is what's stuck; bring a comps-based counter.
Risks & watch-outs
- Watch-outs: built in 1953 — expect roof / HVAC / electrical / plumbing capex.
- Climate carrying-cost: extreme-heat days projected 7→17/yr by 2055 (HVAC capex compounding) — expect insurance premiums to compound above CPI over the hold.
Questions for the listing agent
- Built in 1953 — when were the roof, HVAC, electrical panel, plumbing, and water heater last replaced?
- Is there a deadline driving the sale (1031 exchange, divorce, estate, relocation)? That informs how much negotiation room exists.
- Schools are D-rated, which usually means shorter tenancies and higher turnover. Who's the typical renter profile here, and what's been the actual vacancy rate?
- Crime grade is F in this area — have there been break-ins, vandalism, or insurance claims at this property in the last 3 years? What carrier currently insures it and at what premium?
- The area grade is low — what's the realistic commute time and amenity access for the typical tenant pool here? Any planned neighborhood developments (good or bad) we should know about?
- What's the average days-on-market for RENTAL listings here right now (not sales)? A rising rental-DOM trend means longer vacancies and softer asking-rent achievability than the comps imply.
- What's the recent tenant-quality profile in this submarket — average credit score on applications, eviction rate, late-payment / NSF rate, and stable-employment percentage? A property-management company in the area should have these aggregated.
- How much new for-sale + rental construction is in the pipeline within 1–3 miles? Heavy new supply typically softens prices + rents 12–24 months out; constrained supply supports both.
Investment metrics
- 1% rule
- 0.87% ✗
- Cap rate
- 6.45%
- Cash-on-cash
- 0.56%
- DSCR
- 1.02
- GRM
- 9.5
CMA / ARV
- ARV (on-the-fly)
- $218,079
- Comps found
- 1
Show comp detail 1 sale within ~0.75 mi
| Address | Dist | Beds/Ba | Sqft | Sold | Price | $/sf | Match |
|---|---|---|---|---|---|---|---|
| 2706 SW Lee Ct | 0.67mi | 3/2.0 | 1,549 (-13%) | 18mo | $190,000 | $123 | 32 |
Match score weights: distance 35% · size 25% · config 20% · recency 20%. Top-matched comps best support the ARV.
Projected returns pro-forma
-3.0% appreciation · 4.39% rent growth · sell at horizon
- IRR
- -13.9%
- Equity multiple
- 0.50×
- Total profit
- $-26,493
- Equity at exit
- $27,957
- IRR
- -3.0%
- Equity multiple
- 0.79×
- Total profit
- $-11,229
- Equity at exit
- $16,212
Cash invested: $52,500 (down + closing). Projections, not guarantees.
Landlord ↔ Tenant lean methodology
- Overall (STATE)
- 83 Strongly Landlord-Friendly
- State Kansas
- 83 Strongly Landlord-Friendly · R+10
- County
- — inherits STATE
- City
- — inherits STATE
ZIP-level market 66604
- Rents YoY
- 4.4%
- Active inventory
- 130
- Price-to-rent
- 9.5×
Monthly cashflow live
- Estimated rent
- $1,637 medium interval (Pro) →
- Mortgage (P&I)
- −$983
- Tax from tax record
- −$207 /mo · $2,484/yr
- Insurance
- −$78
- HOA
- −$0
- Vacancy / Maint / Mgmt
- −$344
- Net cashflow
- $25
Break-even live
UW: 25.0% down · 7.5% · 30yr · 1.5% tax · 5.0% vac · 8.0% maint · 8.0% mgmt
Financing live
Cash to close
- Down payment
- $46,875
- Closing costs
- $5,625
- Reserves months
- —
- Total cash needed
- —
Loan-product check · same deal, 3 products live
Conventional
25% down · 7.5% · 30yr
- Down + closing
- —
- Monthly P&I
- —
- Monthly cashflow
- —
- DSCR
- —
- Eligible?
- —
Personal DTI + credit; lowest rate.
DSCR
20% down · 8.5% · 30yr
- Down + closing
- —
- Monthly P&I
- —
- Monthly cashflow
- —
- DSCR
- —
- Eligible?
- —
No personal income docs; deal must DSCR.
Hard money
10% down · 12.0% · 12mo
- Down + closing
- —
- Monthly P&I
- —
- Monthly cashflow
- —
- DSCR
- —
- Eligible?
- —
Short-term bridge; refi at stabilization.
Rent comps 3 comps
| Address | Beds | Baths | Sqft | Rent | $/sqft | DOM | Units | Dist |
|---|---|---|---|---|---|---|---|---|
| 703 SW Parkview St Topeka, KS | 3.0 | 2.0 | 1922 | $1,995 | $1.04 | 21d | 1 | 0.38mi |
| 937 SW Jewell Ave Topeka, KS | 3.0 | 1.0 | 1297 | $1,295 | $1.00 | 21d | 1 | 0.87mi |
| 1275 SW Mulvane St Topeka, KS | 3.0 | 1.5 | 1791 | $1,350 | $0.75 | 21d | 1 | 1.18mi |
Listing history 12 events
-
2026-06-19status $187,500 Pending 14 DOM
-
2026-06-18days on market $187,500 Active 14 DOM
-
2026-06-17days on market $187,500 Active 13 DOM
-
2026-06-16days on market $187,500 Active 12 DOM
-
2026-06-15days on market $187,500 Active 11 DOM
-
2026-06-14days on market $187,500 Active 9 DOM
-
2026-06-13days on market $187,500 Active 8 DOM
-
2026-06-10days on market $187,500 Active 6 DOM
-
2026-06-09days on market $187,500 Active 5 DOM
-
2026-06-08days on market $187,500 Active 4 DOM
-
2026-06-07remarks 687-char remark
-
2026-06-07$187,500 Active 3 DOM
ⓘ Source: listings_history table (triggers on properties + properties_extension) + one-shot
backfill from property_details.listing_events for pre-trigger history.
Tax reassessment forecast KS · Resets to sale price
- Current annual tax
- $2,484 · $207/mo
- Projected year-2 tax
- $2,644 · $220/mo
- Expected delta
- +$159/yr (+$13/mo · 6.4%)
ⓘ Screening estimate from a state-policy table — verify with the county assessor before closing.
Climate risk First Street
- Flood 1/10 Low FEMA zone X (unshaded) · 0% chance over 30 yrs
- Wildfire 1/10 Low
- Heat 5/10 Major 7 d/yr ≥107°F today · 17 d/yr by 30 yrs out
- Wind 2/10 Low
- Air quality 2/10 Low 1 unhealthy d/yr today · 2 by 30 yrs out
Nearby sold comps map
Loading sold comps map…
Walkable amenities ~0.75 mi
Loading nearby amenities…
Taxation est. · year 1
- Rental income
- $19,640
- − Mortgage interest
- −$10,503
- − Property taxes
- −$2,484
- − Insurance
- −$938
- − Repairs & maintenance
- −$1,571
- − Management
- −$1,571
- − Depreciation
- −$5,455
- Taxable loss
- −$2,882
- Est. tax savings @ 24.0%
- +$692
- After-tax cash flow
- $986/yr
For passive investors: Depreciation is non-cash, so a rental often shows a tax loss while cash-flowing — sheltering income. Rental losses are passive: they offset passive income freely, and up to $25,000/yr can offset ordinary (W-2) income if you actively participate and your MAGI is under $100k (phasing out to $0 by $150k); unused losses carry forward. On sale, claimed depreciation is recaptured at up to 25%, and gains may owe capital-gains tax (a 1031 exchange can defer both). Figures are a year-1 estimate at your 24.0% rate — not tax advice; consult a CPA.
Schools (NCES district)
- District
- Topeka Public Schools
- NCES district ID
- 2012260
- Math proficiency
- 17% ▼ -8.00%
- Reading proficiency
- 23% ▼ -2.00%
- Median HH income
- $37,405
- Composite
- 16.69/100
- National rank
- #9167
- State rank
- #158 of 169 in KS
Livability — Topeka
- Score
- 69/100
- State rank
- #195
- US rank
- #8848
Category grades
Schools grade is shown separately in the Schools card above.
Census & demographics
- Census place
- Topeka, KS
- County
- Shawnee County · 118,130 people
- City population
- 118,130
- Metro
- Topeka, KS
- Population (ZIP)
- 23,006
- Household income
- $60,874
- Rent vs Own
- Severe rent burden
- 1192.0
Population outlook (Shawnee County) Hauer SSP2
- Today (2025)
- 179,277 people
- By 2030
- 177,762 · -0.8%
- By 2040
- 172,341 · -3.9%
- By 2050
- 166,330 · -7.2%
- By 2075
- 152,417 · -15.0%
- By 2100
- 134,782 · -24.8%
Race, ethnicity, and origin ACS 2023
- Neighborhood character
- Predominantly White (70%)
- Race & ethnicity
- White 70% Hispanic / Latino 15% Two or more races 11% Black 6% Asian 1%
- Hispanic origin (detail)
- Mexican 12%
- Common ancestry
- Slovak 2% Lithuanian 2% Romanian 1%
- Foreign-born
- 4% · Canada, China
- Languages at home
- 94% English-only · Spanish 4% Other Asian/Pacific 1% Other Indo-European 1%
Political lean MEDSL · Shawnee
- 2024 margin
- Toss-up / Even · D 49.3% · R 48.8% · Other 2.0%
- 2008→2024 swing
- +0.8pp no change · 2008: -0.3pp · 2024: 0.5pp
- All cycles
- 2024: D+0.5 2020: D+3.0 2016: R+2.8 2012: R+1.7 2008: R+0.3
Not yet ingested
- Civics
- —
Market trends
- HPI YoY
- ▼ -151.78%
- Current HPI
- 227.637
- Rent YoY
- ▲ 4.39%
- Metro
- Topeka, KS
- State GDP YoY
- —
- F500 in state
- 0
Price history
+88.4% since first listed6 events — show timeline
- 2026-06-04 Listed $187,500 Sunflower MLS as distributed by MLS GRID
- 2018-08-28 Sold (Public Records) — Public Records
- 2018-08-27 Sold (MLS) — Sunflower MLS as distributed by MLS GRID
- 2018-07-01 Listed $99,500 Sunflower MLS as distributed by MLS GRID
- 2009-08-27 Sold (Public Records) — Public Records
- 2001-10-26 Sold (Public Records) — Public Records
Property tax history
+3.0%/yrLatest (2025): $2,484 · +4.9% YoY. Source: county tax records.
Cash-flow waterfall
monthlySold comps — $/sqft
last 12 mo · ≤1 miLoading sold comps…