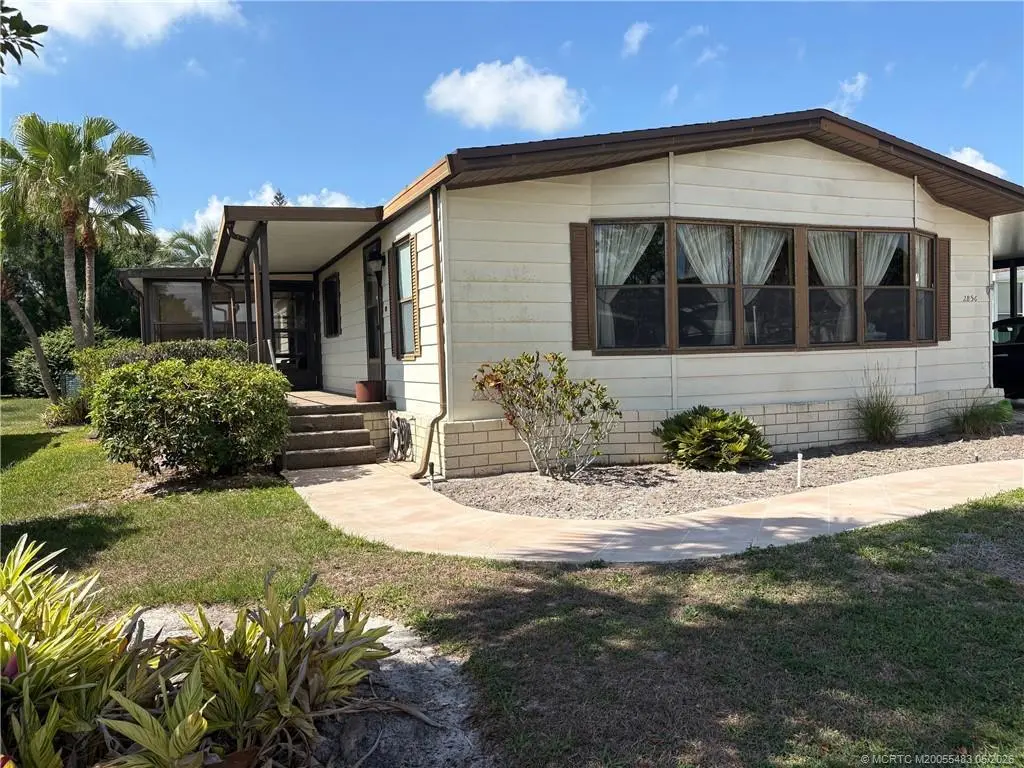
2856 SW Toronado Trl · Palm City, FL
Flood risk 1/10 · Minimal
- FEMA flood zone
- X (unshaded)
- Chance of flooding over 30 yrs
- 0.0%
- Est. flood insurance / yr
- $507 – $1,088
Fire risk 4/10 · Minor
- Est. fire insurance / yr
- $947 – $1,759
Heat risk 10/10 · Severe
- Hot days now (above 107°F)
- 7 days/yr
- Hot days in 30 yrs
- 25 days/yr
Wind risk 10/10 · Severe
- Chance of severe wind over 30 yrs
- 99.0%
Air-quality risk 2/10 · Minimal
- Unhealthy air days now
- 1 days/yr
- Unhealthy air days in 30 yrs
- 1 days/yr
Risk factors via First Street. Map © Google.
Why this score? — see what drove the B- grade
The composite is a weighted blend of 9 inputs, each scored 0–100. Each bar is that input's sub-score; the figure is the points it added to the 100-point composite (weight × sub-score).
- Cash flow +26.5/30.0
- ARV discount +10.5/15.0
- DSCR +9.0/10.0
- 1% rule +7.2/10.0
- Schools +4.5/10.0
- Livability +4.0/5.0
- Rent growth +3.2/5.0
- Condition / age +2.5/5.0
- Appreciation +0.0/10.0
$185,000
🖨 Deal sheet 📄 Offer letter ✓ Due diligence
Listing remarks MLS
BRAND NEW CARPETING IN HUGE LIVING RM W/ BUILT IN SHELVES & DINING RM. NEW VINYL IN FAMILY RM W/ MIRRORED WET BAR+SHELVES & KITCHEN WITH CENTER ISLAND AND LARGE PANTRY. NEWER ROOF & A/C. GLASS ENCL. FL RM. HUGE 12X16 WORKSHOP. FENCED BACKYARD W/ NATIVE LANDSCAPING. WELL MAINTAINED, FORMER MODEL. ON LOCKBOX INFO FROM COUNTY RECORDS NOT GUARANTEED TO BE ACCURATE.
Key facts
- Wet bar
- Island kitchen
- Workshop
Tags
Property features AI
Finance
- Other: Pets allowed with number limit
- HOA & community: Homeowners association with a $175 fee; Association covers management, common areas, cable TV, and reserve fund; Senior community; Community amenities include clubhouse, fitness center, bocce, pickleball, shuffleboard, tennis courts, pool, and on-site property manager
Exterior
- Parking: Attached carport (1 covered space, total 1 parking space); Has carport
- Security: Fenced
- Utilities: Public water (connected); Public sewer (connected); Electricity available; Cable available
- Home design: Single-story home; Resale manufactured home (Fuqua Prestige make); North-facing
- Construction: Aluminum siding; Composition/shingle roof
- Exterior features: Fenced yard; Community pool; Private road frontage
Interior
- Kitchen: Built-in oven; Cooktop; Dishwasher; Disposal; Refrigerator; Kitchen island; Breakfast area
- Bedrooms: Bedroom 2 on the main level; Stacked bedrooms configuration
- Flooring: Carpet; Vinyl
- Bathrooms: 2 full bathrooms; Dual sinks; Separate shower and bathtub
- Heating & cooling: Central heating (electric); Ceiling fans
- Interior features: Wet bar; Built-in features; Breakfast area; Bathtub; Closet cabinetry; Cathedral ceilings; Separate/formal dining room; Dual sinks; Kitchen island; Living/dining room; Separate shower; Stacked bedrooms; Walk-in closets; Metal single-hung windows
- Laundry & utility: Washer; Dryer; Utility room on the main level
Neighborhood map
What this means for you Summary
Snapshot
- This is a 2-bed/2.0-bath manufactured listed at $185k.
Deal economics
- At list price, monthly cash flow is $488 ($6k/yr) — positive.
- The deal already cash-flows at list — no discount required.
- Meets the 1% rule at list price ($2k rent vs $185k).
- Recommended offer: $179k (3.0% below list) — sets the bar for market timing.
- Cap rate 9.5% vs local median 2.6% in Palm City — top-decile yield for the area; either an underpriced asset or a hidden risk that comps aren't pricing in. Stress-test before assuming the spread holds.
Location & tenants
- Location reads 79/100 on livability (#140 in FL, #2,113 nationally) — a middle-class / working-renter tenant base. Strengths: schools A+, crime A+, employment A+; Watch: amenities F, commute F, cost of living F.
- Martin (suburban): math 52% / reading 53% proficiency, ranked #24 of 73 in FL (top 33%) — acceptable for families but not a draw, mixed tenant base, ~2y average lease.
- Market conditions: Rents rising (+2.7%/yr); 588 active listings in the ZIP; 3 comparable units currently listed for rent nearby; rentals at typical pace (median 24d on market — plan ~3-4 weeks tenant-placement turnaround); solid renter incomes; 737 units permitted in Martin County in 2024 (167 in 5+ unit buildings).
- This rent runs 35% of the median local income ($78k/yr) — at the standard rent-burdened threshold; future hikes will face affordability resistance.
Forward outlook
- Local home prices are declining (-3.0%/yr); year-one equity from $1k of loan paydown is wiped out by about $6k of value loss. Plan a longer hold.
- Martin County population projected at +19% by 2050 — long-run rental-demand tailwind backs the buy-and-hold thesis.
Negotiation context
- It's been on market 47 days — a 3% lower offer ($179k) is reasonable based on typical stale-listing flexibility.
- 3 sale attempts since 30y ago; this cycle's ask has dropped $32k (15%) from the opening price — seller is motivated, your offer sets the floor, not the list.
- Current owner paid $58k; list at $185k implies a 219% gain — meaningful room to come down on a strong offer.
Risks & watch-outs
- Climate carrying-cost: severe wind risk, 99% chance of damaging wind over 30y; extreme-heat days projected 7→25/yr by 2055 (HVAC capex compounding) — expect insurance premiums to compound above CPI over the hold.
Questions for the listing agent
- It's been on market 47 days. Have you received any prior offers? Is the seller open to a 3% concession, seller financing, or rate buy-down credit?
- What does the HOA fee cover, when was the last increase, and are there any pending special assessments or reserve-fund shortfalls?
- Is there a deadline driving the sale (1031 exchange, divorce, estate, relocation)? That informs how much negotiation room exists.
- Schools are A-rated — typically a magnet for longer-tenancy family renters. What's the average tenant stay here, and is there a school-zone premium baked into asking?
- What's the average days-on-market for RENTAL listings here right now (not sales)? A rising rental-DOM trend means longer vacancies and softer asking-rent achievability than the comps imply.
- What's the recent tenant-quality profile in this submarket — average credit score on applications, eviction rate, late-payment / NSF rate, and stable-employment percentage? A property-management company in the area should have these aggregated.
- How much new for-sale + rental construction is in the pipeline within 1–3 miles? Heavy new supply typically softens prices + rents 12–24 months out; constrained supply supports both.
Investment metrics
- 1% rule
- 1.22% ✓
- Cap rate
- 9.46%
- Cash-on-cash
- 11.30%
- DSCR
- 1.50
- GRM
- 6.8
CMA / ARV
- ARV (median comp)
- $198,315
- List price
- $185,000
- Delta
- -6.71%
- Verdict
- FAIR
- Comps
- 18 within 1.0 mi
Show comp detail 12 sales within ~0.75 mi
| Address | Dist | Beds/Ba | Sqft | Sold | Price | $/sf | Match |
|---|---|---|---|---|---|---|---|
| 2800 SW Toronado Trl | 0.05mi | 2/2.0 | 1,461 (-4%) | 6mo | $222,000 | $152 | 86 |
| 2791 SW Pontiac Pl | 0.14mi | 2/2.0 | 1,468 (-4%) | 2mo | $98,000 | $67 | 86 |
| 2857 SW Toronado Trl | 0.03mi | 2/2.0 | 1,460 (-4%) | 7mo | $215,000 | $147 | 86 |
| 2779 SW Olds Pl | 0.20mi | 3/2.0 (+1) | 1,574 (+3%) | 2mo | $215,000 | $137 | 78 |
| 2764 SW Olds Pl | 0.17mi | 3/2.0 (+1) | 1,512 (-1%) | 12mo | $246,000 | $163 | 76 |
| 2709 SW Olds Pl | 0.23mi | 2/2.0 | 1,418 (-7%) | 10mo | $180,000 | $127 | 70 |
| 2889 SW Pontiac Pl | 0.14mi | 2/2.0 | 1,440 (-5%) | 18mo | $160,000 | $111 | 69 |
| 2855 SW Monarch Trl | 0.03mi | 2/2.0 | 1,406 (-8%) | 23mo | $225,000 | $160 | 66 |
| 2833 SW Pontiac Pl | 0.14mi | 2/2.0 | 1,342 (-12%) | 11mo | $232,000 | $173 | 64 |
| 2585 SW Marquis Ter | 0.33mi | 2/2.0 | 1,294 (-15%) | 1mo | $213,500 | $165 | 58 |
| 2594 SW Pontiac Pl | 0.26mi | 2/2.0 | 1,396 (-8%) | 23mo | $235,000 | $168 | 55 |
| 8913 SW Chevy Cir | 0.53mi | 2/2.0 | 1,642 (+8%) | 10mo | $208,000 | $127 | 54 |
Match score weights: distance 35% · size 25% · config 20% · recency 20%. Top-matched comps best support the ARV.
Projected returns pro-forma
-3.0% appreciation · 2.71% rent growth · sell at horizon
- IRR
- 0.2%
- Equity multiple
- 1.01×
- Total profit
- $476
- Equity at exit
- $27,584
- IRR
- 9.6%
- Equity multiple
- 1.73×
- Total profit
- $37,918
- Equity at exit
- $15,995
Cash invested: $51,800 (down + closing). Projections, not guarantees.
Landlord ↔ Tenant lean methodology
- Overall (STATE)
- 87 Strongly Landlord-Friendly
- State Florida
- 87 Strongly Landlord-Friendly · R+3
- County
- — inherits STATE
- City
- — inherits STATE
ZIP-level market 34997
- Rents YoY
- 2.7%
- Active inventory
- 588
- Price-to-rent
- 6.8×
Monthly cashflow live
- Estimated rent
- $2,256 medium interval (Pro) →
- Mortgage (P&I)
- −$970
- Tax from tax record
- −$72 /mo · $863/yr
- Insurance
- −$77
- HOA
- −$175
- Vacancy / Maint / Mgmt
- −$474
- Net cashflow
- $488
Break-even live
UW: 25.0% down · 7.5% · 30yr · 1.5% tax · 5.0% vac · 8.0% maint · 8.0% mgmt
Financing live
Cash to close
- Down payment
- $46,250
- Closing costs
- $5,550
- Reserves months
- —
- Total cash needed
- —
Loan-product check · same deal, 3 products live
Conventional
25% down · 7.5% · 30yr
- Down + closing
- —
- Monthly P&I
- —
- Monthly cashflow
- —
- DSCR
- —
- Eligible?
- —
Personal DTI + credit; lowest rate.
DSCR
20% down · 8.5% · 30yr
- Down + closing
- —
- Monthly P&I
- —
- Monthly cashflow
- —
- DSCR
- —
- Eligible?
- —
No personal income docs; deal must DSCR.
Hard money
10% down · 12.0% · 12mo
- Down + closing
- —
- Monthly P&I
- —
- Monthly cashflow
- —
- DSCR
- —
- Eligible?
- —
Short-term bridge; refi at stabilization.
Rent comps 3 comps
| Address | Beds | Baths | Sqft | Rent | $/sqft | DOM | Units | Dist |
|---|---|---|---|---|---|---|---|---|
| 9491 SW Merlin Ct Stuart, FL | 3.0 | 2.5 | 1614 | $2,300 | $1.43 | 23d | 1 | 0.16mi |
| 3171 SW Otter Ln Stuart, FL | 2.0 | 2.5 | 1627 | $2,295 | $1.41 | 23d | 1 | 0.24mi |
| 8913 SW Chevy Cir Stuart, FL | 2.0 | 2.0 | 1642 | $2,500 | $1.52 | 23d | 1 | 0.52mi |
HOA detail
- Monthly dues
- $175 · $2,100/yr
- Likely covers
- landscaping
Listing history 24 events
-
2026-06-17status $185,000 Pending 47 DOM
-
2026-06-17days on market $185,000 Active 47 DOM
-
2026-06-16days on market $185,000 Active 46 DOM
-
2026-06-15price $185,000 Active 45 DOM
-
2026-06-15days on market $217,000 Active 45 DOM
-
2026-06-14days on market $217,000 Active 43 DOM
-
2026-06-13days on market $217,000 Active 42 DOM
-
2026-06-10days on market $217,000 Active 40 DOM
-
2026-06-09days on market $217,000 Active 39 DOM
-
2026-06-08days on market $217,000 Active 38 DOM
-
2026-06-07days on market $217,000 Active 37 DOM
-
2026-06-03days on market $217,000 Active 33 DOM
-
2026-06-02days on market $217,000 Active 32 DOM
-
2026-06-01days on market $217,000 Active 31 DOM
-
2026-05-31days on market $217,000 Active 30 DOM
-
2026-05-31days on market $217,000 Active 29 DOM
-
2026-05-01$217,000 Active 462-char remark
-
1999-10-04soldstatus $58,000
-
1999-09-30soldstatus $58,000 381-char remark
Show marketing remark (381 chars)
BRAND NEW CARPETING IN HUGE LIVING RM W/ BUILT IN SHELVES & DINING RM. NEW VINYL IN FAMILY RM W/ MIRRORED WET BAR+SHELVES & KITCHEN WITH CENTER ISLAND AND LARGE PANTRY. NEWER ROOF & A/C. GLASS ENCL. FL RM. HUGE 12X16 WORKSHOP. FENCED BACKYARD W/ NATIVE LANDSCAPING. WELL MAINTAINED, FORMER MODEL. ON LOCKBOX INFO FROM COUNTY RECORDS NOT GUARANTEED TO BE ACCURATE.
-
1999-06-30$59,900 381-char remark
Show marketing remark (381 chars)
BRAND NEW CARPETING IN HUGE LIVING RM W/ BUILT IN SHELVES & DINING RM. NEW VINYL IN FAMILY RM W/ MIRRORED WET BAR+SHELVES & KITCHEN WITH CENTER ISLAND AND LARGE PANTRY. NEWER ROOF & A/C. GLASS ENCL. FL RM. HUGE 12X16 WORKSHOP. FENCED BACKYARD W/ NATIVE LANDSCAPING. WELL MAINTAINED, FORMER MODEL. ON LOCKBOX INFO FROM COUNTY RECORDS NOT GUARANTEED TO BE ACCURATE.
-
1998-04-15soldstatus $53,400
-
1998-01-19historical
-
1996-01-19$62,500
-
1991-12-16soldstatus $61,000
ⓘ Source: listings_history table (triggers on properties + properties_extension) + one-shot
backfill from property_details.listing_events for pre-trigger history.
Tax reassessment forecast FL · Resets to sale price
- Current annual tax
- $863 · $72/mo
- Projected year-2 tax
- $1,536 · $128/mo
- Expected delta
- +$673/yr (+$56/mo · 78.0%)
ⓘ Screening estimate from a state-policy table — verify with the county assessor before closing.
Climate risk First Street
- Flood 1/10 Low FEMA zone X (unshaded) · 0% chance over 30 yrs
- Wildfire 4/10 Moderate
- Heat 10/10 Extreme 7 d/yr ≥107°F today · 25 d/yr by 30 yrs out
- Wind 10/10 Extreme 99% chance of damaging wind over 30 yrs
- Air quality 2/10 Low 1 unhealthy d/yr today · 1 by 30 yrs out
Nearby sold comps map
Loading sold comps map…
Walkable amenities ~0.75 mi
Loading nearby amenities…
Taxation est. · year 1
- Rental income
- $27,067
- − Mortgage interest
- −$10,363
- − Property taxes
- −$863
- − Insurance
- −$925
- − Repairs & maintenance
- −$2,165
- − Management
- −$2,165
- − HOA
- −$2,100
- − Depreciation
- −$5,382
- Taxable income
- $3,104
- Est. tax owed @ 24.0%
- −$745
- After-tax cash flow
- $5,108/yr
For passive investors: Depreciation is non-cash, so a rental often shows a tax loss while cash-flowing — sheltering income. Rental losses are passive: they offset passive income freely, and up to $25,000/yr can offset ordinary (W-2) income if you actively participate and your MAGI is under $100k (phasing out to $0 by $150k); unused losses carry forward. On sale, claimed depreciation is recaptured at up to 25%, and gains may owe capital-gains tax (a 1031 exchange can defer both). Figures are a year-1 estimate at your 24.0% rate — not tax advice; consult a CPA.
Schools (NCES district)
- District
- Martin
- NCES district ID
- 1201290
- Math proficiency
- 52% ▼ -14.00%
- Reading proficiency
- 53% ▼ -4.00%
- Median HH income
- $52,482
- Composite
- 45.1/100
- National rank
- #2690
- State rank
- #24 of 73 in FL
Livability — Palm City
- Score
- 79/100
- State rank
- #140
- US rank
- #2113
Category grades
Schools grade is shown separately in the Schools card above.
Census & demographics
- County
- Martin County · 165,223 people
- City population
- 30,592
- Metro
- Port St. Lucie, FL
- Population (ZIP)
- 47,075
- Household income
- $78,136
- Rent vs Own
- Severe rent burden
- 1323.0
Population outlook (Martin County) Hauer SSP2
- Today (2025)
- 172,383 people
- By 2030
- 180,192 · +4.5%
- By 2040
- 194,114 · +12.6%
- By 2050
- 204,992 · +18.9%
- By 2075
- 229,641 · +33.2%
- By 2100
- 232,146 · +34.7%
Race, ethnicity, and origin ACS 2023
- Neighborhood character
- Predominantly White (74%)
- Race & ethnicity
- White 74% Hispanic / Latino 19% Two or more races 9% Black 3% Asian 1%
- Hispanic origin (detail)
- Mexican 4% Puerto Rican 2% Cuban 3%
- Common ancestry
- Romanian 3% Lithuanian 3% Slovak 2%
- Foreign-born
- 14% · Canada, Jamaica, China
- Languages at home
- 81% English-only · Spanish 14% French/Haitian/Cajun 2% Other Indo-European 1%
Political lean MEDSL · Martin
- 2024 margin
- Solid R (+31.1) · D 34.1% · R 65.2%
- 2008→2024 swing
- -17.5pp toward R · 2008: -13.6pp · 2024: -31.1pp
- All cycles
- 2024: R+31.1 2020: R+24.6 2016: R+26.9 2012: R+22.9 2008: R+13.6
Not yet ingested
- Civics
- —
Market trends
- HPI YoY
- ▼ -319.78%
- Current HPI
- 336.7717
- Rent YoY
- ▲ 2.71%
- Metro
- Port St. Lucie, FL
- State GDP YoY
- ▲ 3.28%
- F500 in state
- 36
Industry mix (Fortune 500 HQ in FL)
| Industry | F500 HQs | Revenue |
|---|---|---|
| Industrial Technology | 2 | $29B |
|
||
| Insurance | 2 | $17B |
|
||
| Retail | 1 | $60B |
|
||
| Technology Distribution | 1 | $58B |
|
||
| Homebuilding | 1 | $35B |
|
||
| Technology Manufacturing | 1 | $35B |
|
||
Price history
+203.3% since first listed10 events — show timeline
- 2026-06-17 Pending — MCRTC
- 2026-06-15 Price Changed $185,000 MCRTC
- 2026-05-01 Listed $217,000 MCRTC
- 1999-10-04 Sold (Public Records) $58,000 Public Records
- 1999-09-30 Sold (MLS) $58,000 MCRTC
- 1999-06-30 Listed $59,900 MCRTC
- 1998-04-15 Sold (Public Records) $53,400 Public Records
- 1998-01-19 Listing Removed — MCRTC
- 1996-01-19 Listed $62,500 MCRTC
- 1991-12-16 Sold (Public Records) $61,000 Public Records
Property tax history
+4.0%/yrLatest (2025): $863 · +2.1% YoY. Source: county tax records.
Cash-flow waterfall
monthlySold comps — $/sqft
last 12 mo · ≤1 miLoading sold comps…