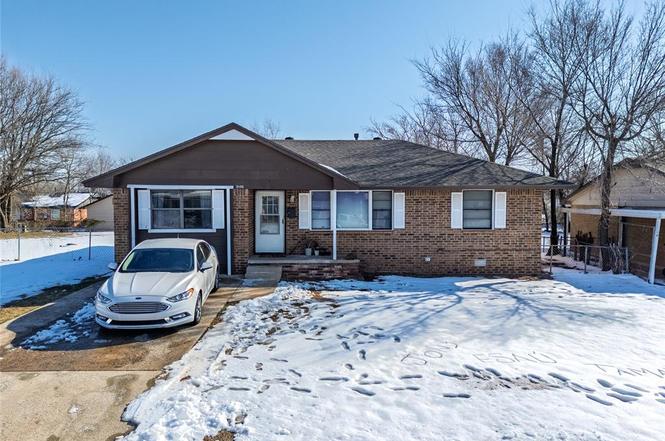
5100 S Karen Dr · Oklahoma City, OK
Flood risk 1/10 · Minimal
- FEMA flood zone
- X (unshaded)
- Chance of flooding over 30 yrs
- 0.0%
- Est. flood insurance / yr
- $507 – $1,088
Fire risk 1/10 · Minimal
- Est. fire insurance / yr
- $2,463 – $4,575
Heat risk 6/10 · Moderate
- Hot days now (above 107°F)
- 7 days/yr
- Hot days in 30 yrs
- 19 days/yr
Wind risk 2/10 · Minimal
- Chance of severe wind over 30 yrs
- 4.0%
Air-quality risk 2/10 · Minimal
- Unhealthy air days now
- 1 days/yr
- Unhealthy air days in 30 yrs
- 3 days/yr
Risk factors via First Street. Map © Google.
Why this score? — see what drove the D- grade
The composite is a weighted blend of 9 inputs, each scored 0–100. Each bar is that input's sub-score; the figure is the points it added to the 100-point composite (weight × sub-score).
- Cash flow +16.1/30.0
- DSCR +5.0/10.0
- Livability +4.0/5.0
- 1% rule +3.8/10.0
- Rent growth +3.7/5.0
- Condition / age +2.5/5.0
- Schools +1.2/10.0
- ARV discount +0.0/15.0
- Appreciation +0.0/10.0
$149,000
🖨 Deal sheet (PDF) 📄 Offer letter ✓ Due diligence
Listing remarks MLS
5100 S Karen includes the lot next door. Brick home with a converted garage located in a steady neighborhood. This three bedroom one bath home has been a rental for many years. It’s now time for a new owner. This home has the original real wood floors and neutral paint colors. The kitchen has vinyl countertops and white painted cabinets. The vacant lot next-door is for sale and can be purchased together with this property for a 5% discount. Schedule a time to tour today. Call with any questions.
Key facts
- Generous lot
- Backyard access
- Room for toys
Tags
Property features AI
Finance
- Other: Homestead exempt; Interior lot; Located in Roberts South Highland Sec 2
- Financial info: Loan qualifying available; Not assumable
- HOA & community: No mandatory association dues
Exterior
- Home design: Single family residence; One story; Residential property
- Construction: Brick construction; Composition roof; Built (existing)
- Exterior features: Storage
Interior
- Bedrooms: 3 bedrooms
- Bathrooms: 1 full bathroom
- Interior features: One living area; No fireplace; Conventional foundation
Neighborhood map
What this means for you Summary
Snapshot
- This is a 3-bed/1.0-bath single-family listed at $149k.
Deal economics
- At list price, monthly cash flow is $77 ($921/yr) — positive.
- The deal already cash-flows at list — no discount required.
- To meet the 1% rule (rent ≥ 1% of price), the offer needs to be $130k (12.5% below list).
- Recommended offer: $130k (12.5% below list) — sets the bar for 1% rule.
- Cap rate 6.9% vs local median 3.7% in Oklahoma City — top-decile yield for the area; either an underpriced asset or a hidden risk that comps aren't pricing in. Stress-test before assuming the spread holds.
Location & tenants
- Location reads 80/100 on livability (#3 in OK, #1,635 nationally) — a professional / high-income tenant draw. Strengths: amenities A+, commute A+, cost of living A+; Watch: crime F.
- Midwest City-Del City (suburban): math 10% / reading 17% proficiency, ranked #231 of 270 in OK (top 86%) — low school quality limits family demand, transient renter base, plan for 1-2y turnover.
- Zoned schools: Highland Park Es (math 2% / reading 2%); Del City Ms (math 4% / reading 11%, grade F, #306 of 345 statewide, top 90%, 925 students, 0% FRL); Del City Hs (math 5% / reading 15%, grade F, #361 of 447 statewide, top 94%, 1,158 students, 0% FRL) — zoned schools average 0% FRL vs 57% district-wide (57 pts lower); this property's tenant base skews higher-income than the district average.
- Market conditions: Rents rising fast (+4.8%/yr); 93 active listings in the ZIP; 40 comparable units currently listed for rent nearby; rentals at typical pace (median 22d on market — plan ~3-4 weeks tenant-placement turnaround); 5,365 units permitted in Oklahoma County in 2024 (569 in 5+ unit buildings).
Forward outlook
- Local home prices are declining (-3.0%/yr); year-one equity from $1k of loan paydown is wiped out by about $4k of value loss. Plan a longer hold.
- Oklahoma County population projected at +41% by 2050 — long-run rental-demand tailwind backs the buy-and-hold thesis.
Negotiation context
- It's been on market 139 days — a 12% lower offer ($131k) is reasonable based on typical stale-listing flexibility.
- 4 sale attempts since 9y ago; this cycle's ask has dropped $15k (9%) from the opening price — seller is motivated, your offer sets the floor, not the list.
- Current owner paid $119k; 25% above their basis — modest negotiation headroom, anchor on the comps not their cost.
Risks & watch-outs
- Climate carrying-cost: extreme-heat days projected 7→19/yr by 2055 (HVAC capex compounding) — expect insurance premiums to compound above CPI over the hold.
Questions for the listing agent
- It's been on market 139 days. Have you received any prior offers? Is the seller open to a 12% concession, seller financing, or rate buy-down credit?
- Built in 1960 — when were the roof, HVAC, electrical panel, plumbing, and water heater last replaced?
- Why hasn't it sold? Are there any deal-killer items the seller is aware of (foundation, flood, title, zoning, code violations)?
- Is there a deadline driving the sale (1031 exchange, divorce, estate, relocation)? That informs how much negotiation room exists.
- Schools are F-rated, which usually means shorter tenancies and higher turnover. Who's the typical renter profile here, and what's been the actual vacancy rate?
- Crime grade is F in this area — have there been break-ins, vandalism, or insurance claims at this property in the last 3 years? What carrier currently insures it and at what premium?
- The area grade is low — what's the realistic commute time and amenity access for the typical tenant pool here? Any planned neighborhood developments (good or bad) we should know about?
- What's the average days-on-market for RENTAL listings here right now (not sales)? A rising rental-DOM trend means longer vacancies and softer asking-rent achievability than the comps imply.
- What's the recent tenant-quality profile in this submarket — average credit score on applications, eviction rate, late-payment / NSF rate, and stable-employment percentage? A property-management company in the area should have these aggregated.
- How much new for-sale + rental construction is in the pipeline within 1–3 miles? Heavy new supply typically softens prices + rents 12–24 months out; constrained supply supports both.
Investment metrics
- 1% rule
- 0.88% ✗
- Cap rate
- 6.91%
- Cash-on-cash
- 2.21%
- DSCR
- 1.10
- GRM
- 9.5
CMA / ARV
- ARV (on-the-fly)
- $126,252
- Comps found
- 12
Show comp detail 12 sales within ~0.75 mi
| Address | Dist | Beds/Ba | Sqft | Sold | Price | $/sf | Match |
|---|---|---|---|---|---|---|---|
| 5101 S Karen St | 0.03mi | 3/1.5 | 941 (-6%) | 3mo | $75,000 | $80 | 84 |
| 5404 S Huddleston St | 0.20mi | 3/2.0 | 963 (-4%) | 1mo | $81,500 | $85 | 80 |
| 4126 Jones Blvd | 0.34mi | 3/1.0 | 1,026 (+2%) | 4mo | $115,000 | $112 | 77 |
| 4317 SE 55th St | 0.32mi | 2/1.0 (-1) | 910 (-9%) | 3mo | $75,000 | $82 | 62 |
| 5104 Gaines St | 0.54mi | 3/1.5 | 1,052 (+5%) | 4mo | $172,500 | $164 | 61 |
| 3608 SE 57th Cir | 0.62mi | 3/2.0 | 1,036 (+3%) | 4mo | $130,900 | $126 | 58 |
| 5113 Creekwood Ter | 0.72mi | 3/1.5 | 1,039 (+4%) | 2mo | $72,000 | $69 | 57 |
| 4721 SE 45th St | 0.62mi | 3/1.5 | 1,060 (+6%) | 3mo | $150,000 | $142 | 57 |
| 3432 Parker Dr | 0.66mi | 3/1.0 | 937 (-6%) | 3mo | $140,500 | $150 | 56 |
| 4321 Epperly Dr | 0.67mi | 3/2.0 | 1,075 (+7%) | 1mo | $155,000 | $144 | 52 |
| 4308 S Wofford Ave | 0.68mi | 3/1.5 | 888 (-11%) | 2mo | $150,000 | $169 | 46 |
| 3217 SE 56th St | 0.74mi | 3/1.5 | 1,134 (+13%) | 2mo | $110,000 | $97 | 40 |
Match score weights: distance 35% · size 25% · config 20% · recency 20%. Top-matched comps best support the ARV.
Projected returns pro-forma
-3.0% appreciation · 4.76% rent growth · sell at horizon
- IRR
- -11.0%
- Equity multiple
- 0.59×
- Total profit
- $-16,933
- Equity at exit
- $22,216
- IRR
- 0.5%
- Equity multiple
- 1.03×
- Total profit
- $1,436
- Equity at exit
- $12,883
Cash invested: $41,720 (down + closing). Projections, not guarantees.
Landlord ↔ Tenant lean methodology
- Overall (STATE)
- 83 Strongly Landlord-Friendly
- State Oklahoma
- 83 Strongly Landlord-Friendly · R+20
- County
- — inherits STATE
- City
- — inherits STATE
ZIP-level market 73135
- Home prices YoY
- -8.0%
- Rents YoY
- 4.8%
- Active inventory
- 93
- Price-to-rent
- 9.5×
Monthly cashflow live
- Estimated rent
- $1,304 high interval (Pro) →
- Mortgage (P&I)
- −$781
- Tax from tax record
- −$110 /mo · $1,321/yr
- Insurance
- −$62
- HOA
- −$0
- Vacancy / Maint / Mgmt
- −$274
- Net cashflow
- $77
Break-even live
Sensitivity live
| Price | -10% $161 | -5% $119 | +0% $77 | +5% $35 | +10% $-8 |
|---|---|---|---|---|---|
| Rent | -10% $-26 | -5% $25 | +0% $77 | +5% $128 | +10% $180 |
| Rate | -1.0pp $152 | -0.5pp $115 | base $77 | +0.5pp $38 | +1.0pp $-1 |
UW: 25.0% down · 7.5% · 30yr · 1.5% tax · 5.0% vac · 8.0% maint · 8.0% mgmt
Financing live
Cash to close
- Down payment
- $37,250
- Closing costs
- $4,470
- Reserves months
- —
- Total cash needed
- —
Loan-product check · same deal, 3 products live
Conventional
25% down · 7.5% · 30yr
- Down + closing
- —
- Monthly P&I
- —
- Monthly cashflow
- —
- DSCR
- —
- Eligible?
- —
Personal DTI + credit; lowest rate.
DSCR
20% down · 8.5% · 30yr
- Down + closing
- —
- Monthly P&I
- —
- Monthly cashflow
- —
- DSCR
- —
- Eligible?
- —
No personal income docs; deal must DSCR.
Hard money
10% down · 12.0% · 12mo
- Down + closing
- —
- Monthly P&I
- —
- Monthly cashflow
- —
- DSCR
- —
- Eligible?
- —
Short-term bridge; refi at stabilization.
Rent comps 40 comps
| Address | Beds | Baths | Sqft | Rent | $/sqft | DOM | Units | Dist |
|---|---|---|---|---|---|---|---|---|
| 4917 S Karen St Oklahoma City, OK | 3.0 | 1.5 | 960 | $1,100 | $1.15 | 25d | 1 | 0.08mi |
| 4900 S Dimple Dr Oklahoma City, OK | 3.0 | 1.5 | 1463 | $1,025 | $0.70 | 4d | 1 | 0.12mi |
| 4220 SE 49th St Oklahoma City, OK | 3.0 | 2.0 | 1223 | $1,175 | $0.96 | 25d | 1 | 0.12mi |
| 4101 SE 48th St Oklahoma City, OK | 3.0 | 1.0 | 974 | $1,245 | $1.28 | 17d | 1 | 0.14mi |
| 4016 SE 47th St Oklahoma City, OK | 3.0 | 1.5 | 1245 | $1,199 | $0.96 | 6d | 1 | 0.16mi |
| 4008 SE 47th St Oklahoma City, OK | 3.0 | 1.5 | 1082 | $1,145 | $1.06 | 4d | 1 | 0.17mi |
| 4217 SE 48th Ter Oklahoma City, OK | 3.0 | 1.5 | 1043 | $1,295 | $1.24 | 25d | 1 | 0.18mi |
| 4215 SE 53rd St Oklahoma City, OK | 1.0–2.0 | 1.0 | 769 | $915 | $1.19 | 25d | 1 | 0.18mi |
| 4309 SE 48th Ter Oklahoma City, OK | 3.0 | 2.0 | 1458 | $1,525 | $1.05 | 3d | 1 | 0.23mi |
| 3916 SE 46th St Oklahoma City, OK | 3.0 | 1.5 | 1220 | $1,295 | $1.06 | 25d | 1 | 0.26mi |
| 4900 Sunny Ct Oklahoma City, OK | 3.0 | 2.0 | 1281 | $1,600 | $1.25 | 4d | 1 | 0.28mi |
| 5537 S Sunnylane Rd Oklahoma City, OK | 1.0–2.0 | 1.0–1.5 | 840 | $850 | $1.01 | 4d | 11 | 0.32mi |
| 4104 SE 45th Ter Oklahoma City, OK | 4.0 | 1.5 | 1111 | $1,275 | $1.15 | 3d | 1 | 0.35mi |
| 4004 SE 45th Ter Oklahoma City, OK | 3.0 | 1.0 | 1006 | $995 | $0.99 | 25d | 1 | 0.35mi |
| 4700 Clendon Way Oklahoma City, OK | 3.0 | 2.0 | 1434 | $1,450 | $1.01 | 16d | 1 | 0.36mi |
| 3741 SE 48th Pl Oklahoma City, OK | 3.0 | 2.0 | 1370 | $1,225 | $0.89 | 4d | 1 | 0.37mi |
| 3925 SE 59th St Oklahoma City, OK | 2.0 | 1.5 | 993 | $1,211 | $1.22 | 23d | 1 | 0.55mi |
| 4721 SE 46th St Oklahoma City, OK | 3.0 | 2.0 | 1002 | $1,275 | $1.27 | 13d | 1 | 0.58mi |
| 3451 SE 44th St Oklahoma City, OK | 1.0–3.0 | 1.0–2.0 | 974 | $950 | $0.98 | 13d | 4 | 0.58mi |
| 3451 SE 44th St Unit 269 Del City, OK | 2.0 | 1.0 | 924 | $850 | $0.92 | 4d | 1 | 0.58mi |
| 5609 Evanbrook Ter Oklahoma City, OK | 3.0 | 2.0 | 1175 | $1,395 | $1.19 | 25d | 1 | 0.60mi |
| 5609 Evanbrook Ter Oklahoma City, OK | 3.0 | 2.0 | 1175 | $1,395 | $1.19 | 3d | 1 | 0.60mi |
| 3409 Parker Dr Oklahoma City, OK | 3.0 | 1.0 | 918 | $1,250 | $1.36 | 5d | 1 | 0.63mi |
| 5316 S Briarwood Dr Oklahoma City, OK | 3.0 | 2.0 | 980 | $1,149 | $1.17 | 25d | 1 | 0.63mi |
| 5024 Brookdale St Oklahoma City, OK | 3.0 | 1.5 | 1039 | $1,550 | $1.49 | 23d | 1 | 0.66mi |
| 3424 Parker Dr Oklahoma City, OK | 3.0 | 1.0 | 1125 | $450 | $0.40 | 45d | 1 | 0.68mi |
| 4825 Eric Dr Oklahoma City, OK | 3.0 | 2.0 | 1488 | $1,695 | $1.14 | 16d | 1 | 0.68mi |
| 4500 Cherry Hill Ln Oklahoma City, OK | 2.0 | 1.0 | 850 | $820 | $0.96 | 25d | 1 | 0.69mi |
| 5305 Brookdale St Oklahoma City, OK | 3.0 | 2.0 | 1205 | $1,195 | $0.99 | 13d | 1 | 0.70mi |
| 5012 Creekwood Ter Oklahoma City, OK | 3.0 | 1.5 | 1250 | $1,395 | $1.12 | 45d | 1 | 0.72mi |
| 4600 Loch Ln Oklahoma City, OK | 2.0 | 1.0 | 834 | $1,195 | $1.43 | 22d | 1 | 0.74mi |
| 5216 Foster Dr Oklahoma City, OK | 3.0 | 1.5 | 894 | $995 | $1.11 | 45d | 1 | 0.77mi |
| 3205 SE 55th St Oklahoma City, OK | 3.0 | 1.5 | 1119 | $1,300 | $1.16 | 45d | 1 | 0.77mi |
| 4116 Overland Dr Oklahoma City, OK | 3.0 | 2.0 | 1363 | $1,500 | $1.10 | 3d | 1 | 0.78mi |
| 3305 Neighbors Ln Oklahoma City, OK | 3.0 | 1.0 | 945 | $1,250 | $1.32 | 4d | 1 | 0.78mi |
| 4702 Loch Ln Unit 4309 Oklahoma City, OK | 2.0 | 1.0 | 950 | $1,200 | $1.26 | 6d | 1 | 0.79mi |
| 3005 SE 51st St Oklahoma City, OK | 2.0 | 1.0 | 842 | $995 | $1.18 | 45d | 1 | 0.83mi |
| 4328 Edinburg Way Del City, OK | 3.0 | 2.0 | 1145 | $1,499 | $1.31 | 25d | 1 | 0.86mi |
| 4700 SE 42nd St Oklahoma City, OK | 3.0 | 2.0 | 1130 | $1,400 | $1.24 | 25d | 1 | 0.87mi |
| 3224 Lazy Ln Oklahoma City, OK | 3.0 | 2.0 | 1440 | $1,300 | $0.90 | 25d | 1 | 0.87mi |
Listing history 35 events
-
2026-06-21days on market $149,000 Active 139 DOM
-
2026-06-18days on market $149,000 Active 136 DOM
-
2026-06-17days on market $149,000 Active 135 DOM
-
2026-06-16days on market $149,000 Active 134 DOM
-
2026-06-15days on market $149,000 Active 133 DOM
-
2026-06-13days on market $149,000 Active 131 DOM
-
2026-06-13days on market $149,000 Active 130 DOM
-
2026-06-09days on market $149,000 Active 127 DOM
-
2026-06-08days on market $149,000 Active 126 DOM
-
2026-06-07days on market $149,000 Active 125 DOM
-
2026-06-05days on market $149,000 Active 122 DOM
-
2026-06-03days on market $149,000 Active 121 DOM
-
2026-06-02days on market $149,000 Active 120 DOM
-
2026-06-01days on market $149,000 Active 119 DOM
-
2026-05-31days on market $149,000 Active 118 DOM
-
2026-05-22price $149,000
-
2026-02-25price $159,900
-
2026-02-02$164,000 Active
-
2023-12-05soldstatus $119,000
-
2023-11-30soldstatus $119,000 Closed 510-char remark
Show marketing remark (510 chars)
5100 S Karen includes the lot next door. Brick home with a converted garage located in a steady neighborhood. This three bedroom one bath home has been a rental for many years. It’s now time for a new owner. This home has the original real wood floors and neutral paint colors. The kitchen has vinyl countertops and white painted cabinets. The vacant lot next-door is for sale and can be purchased together with this property for a 5% discount. Schedule a time to tour today. Call with any questions.
-
2023-10-25status Pending 510-char remark
Show marketing remark (510 chars)
5100 S Karen includes the lot next door. Brick home with a converted garage located in a steady neighborhood. This three bedroom one bath home has been a rental for many years. It’s now time for a new owner. This home has the original real wood floors and neutral paint colors. The kitchen has vinyl countertops and white painted cabinets. The vacant lot next-door is for sale and can be purchased together with this property for a 5% discount. Schedule a time to tour today. Call with any questions.
-
2023-10-22price $109,900 510-char remark
Show marketing remark (510 chars)
5100 S Karen includes the lot next door. Brick home with a converted garage located in a steady neighborhood. This three bedroom one bath home has been a rental for many years. It’s now time for a new owner. This home has the original real wood floors and neutral paint colors. The kitchen has vinyl countertops and white painted cabinets. The vacant lot next-door is for sale and can be purchased together with this property for a 5% discount. Schedule a time to tour today. Call with any questions.
-
2023-10-10price $119,900 510-char remark
Show marketing remark (510 chars)
5100 S Karen includes the lot next door. Brick home with a converted garage located in a steady neighborhood. This three bedroom one bath home has been a rental for many years. It’s now time for a new owner. This home has the original real wood floors and neutral paint colors. The kitchen has vinyl countertops and white painted cabinets. The vacant lot next-door is for sale and can be purchased together with this property for a 5% discount. Schedule a time to tour today. Call with any questions.
-
2023-09-26price $134,900 510-char remark
Show marketing remark (510 chars)
5100 S Karen includes the lot next door. Brick home with a converted garage located in a steady neighborhood. This three bedroom one bath home has been a rental for many years. It’s now time for a new owner. This home has the original real wood floors and neutral paint colors. The kitchen has vinyl countertops and white painted cabinets. The vacant lot next-door is for sale and can be purchased together with this property for a 5% discount. Schedule a time to tour today. Call with any questions.
-
2023-09-13$149,900 Active 510-char remark
Show marketing remark (510 chars)
5100 S Karen includes the lot next door. Brick home with a converted garage located in a steady neighborhood. This three bedroom one bath home has been a rental for many years. It’s now time for a new owner. This home has the original real wood floors and neutral paint colors. The kitchen has vinyl countertops and white painted cabinets. The vacant lot next-door is for sale and can be purchased together with this property for a 5% discount. Schedule a time to tour today. Call with any questions.
-
2018-06-18soldstatus $68,509 Sold 720-char remark
Show marketing remark (720 chars)
This is for a portfolio of 8 individual houses for a combined price of $595,000, and all 8 are to be SOLD TOGETHER…Seller WILL NOT BREAK UP PACKAGE of 8. Superb performing portfolio of single family homes. Many are updated with new roofs, HVAC, Hot water tanks, and numerous other upgrades. Homes stay 100% occupied and 7 out of 8 are on Section 8 (see attached breakdowns). This is a great package of solid rental home in OKC with one of the nation’s lowest unemployment rates. 3440 Cobblestone MLS814975, 10405 N McKinley MLS 814982, 3409 SE 55th MLS 814977, 508 NE 63rd MLS 814985, 9208 NE 46th MLS 814987, 3209 Fonshill MLS 815155, 5100 S Karen MLS 815180, 720 NE 81st MLS 815173
-
2018-06-14soldstatus $526,000
-
2018-04-18status Pending 720-char remark
Show marketing remark (720 chars)
This is for a portfolio of 8 individual houses for a combined price of $595,000, and all 8 are to be SOLD TOGETHER…Seller WILL NOT BREAK UP PACKAGE of 8. Superb performing portfolio of single family homes. Many are updated with new roofs, HVAC, Hot water tanks, and numerous other upgrades. Homes stay 100% occupied and 7 out of 8 are on Section 8 (see attached breakdowns). This is a great package of solid rental home in OKC with one of the nation’s lowest unemployment rates. 3440 Cobblestone MLS814975, 10405 N McKinley MLS 814982, 3409 SE 55th MLS 814977, 508 NE 63rd MLS 814985, 9208 NE 46th MLS 814987, 3209 Fonshill MLS 815155, 5100 S Karen MLS 815180, 720 NE 81st MLS 815173
-
2018-04-10$77,640 Active 720-char remark
Show marketing remark (720 chars)
This is for a portfolio of 8 individual houses for a combined price of $595,000, and all 8 are to be SOLD TOGETHER…Seller WILL NOT BREAK UP PACKAGE of 8. Superb performing portfolio of single family homes. Many are updated with new roofs, HVAC, Hot water tanks, and numerous other upgrades. Homes stay 100% occupied and 7 out of 8 are on Section 8 (see attached breakdowns). This is a great package of solid rental home in OKC with one of the nation’s lowest unemployment rates. 3440 Cobblestone MLS814975, 10405 N McKinley MLS 814982, 3409 SE 55th MLS 814977, 508 NE 63rd MLS 814985, 9208 NE 46th MLS 814987, 3209 Fonshill MLS 815155, 5100 S Karen MLS 815180, 720 NE 81st MLS 815173
-
2017-09-28soldstatus $60,000
-
2017-09-26soldstatus $60,000 Sold
-
2017-09-06status Pending
-
2017-08-31price $65,000
-
2017-07-01$69,900 Active
-
1985-05-01soldstatus $4,000
ⓘ Source: listings_history table (triggers on properties + properties_extension) + one-shot
backfill from property_details.listing_events for pre-trigger history.
Tax reassessment forecast OK · Resets to sale price
- Current annual tax
- $1,321 · $110/mo
- Projected year-2 tax
- $1,341 · $112/mo
- Expected delta
- +$20/yr (+$2/mo · 1.5%)
ⓘ Screening estimate from a state-policy table — verify with the county assessor before closing.
Climate risk First Street
- Flood 1/10 Low FEMA zone X (unshaded) · 0% chance over 30 yrs
- Wildfire 1/10 Low
- Heat 6/10 Major 7 d/yr ≥107°F today · 19 d/yr by 30 yrs out
- Wind 2/10 Low 4% chance of damaging wind over 30 yrs
- Air quality 2/10 Low 1 unhealthy d/yr today · 3 by 30 yrs out
Nearby sold comps map
Loading sold comps map…
Walkable amenities ~0.75 mi
Loading nearby amenities…
Taxation est. · year 1
- Rental income
- $15,650
- − Mortgage interest
- −$8,346
- − Property taxes
- −$1,321
- − Insurance
- −$745
- − Repairs & maintenance
- −$1,252
- − Management
- −$1,252
- − Depreciation
- −$4,335
- Taxable loss
- −$1,601
- Est. tax savings @ 24.0%
- +$384
- After-tax cash flow
- $1,305/yr
For passive investors: Depreciation is non-cash, so a rental often shows a tax loss while cash-flowing — sheltering income. Rental losses are passive: they offset passive income freely, and up to $25,000/yr can offset ordinary (W-2) income if you actively participate and your MAGI is under $100k (phasing out to $0 by $150k); unused losses carry forward. On sale, claimed depreciation is recaptured at up to 25%, and gains may owe capital-gains tax (a 1031 exchange can defer both). Figures are a year-1 estimate at your 24.0% rate — not tax advice; consult a CPA.
Schools (NCES district)
- District
- Midwest City-Del City
- NCES district ID
- 4019950
- Math proficiency
- 10% ▼ -11.00%
- Reading proficiency
- 17% ▼ -8.00%
- Median HH income
- $45,724
- Composite
- 12.09/100
- National rank
- #9658
- State rank
- #231 of 270 in OK
Livability — Oklahoma City
- Score
- 80/100
- State rank
- #3
- US rank
- #1635
Category grades
Schools grade is shown separately in the Schools card above.
Census & demographics
- Census place
- Oklahoma City, OK
- County
- Oklahoma County · 771,644 people
- City population
- 498,656
- Metro
- Oklahoma City, OK
- Population (ZIP)
- 22,022
- Household income
- $63,478
- Rent vs Own
- Severe rent burden
- 1083.0
Population outlook (Oklahoma County) Hauer SSP2
- Today (2025)
- 911,875 people
- By 2030
- 982,413 · +7.7%
- By 2040
- 1,130,468 · +24.0%
- By 2050
- 1,288,422 · +41.3%
- By 2075
- 1,711,482 · +87.7%
- By 2100
- 2,088,448 · +129.0%
Race, ethnicity, and origin ACS 2023
- Neighborhood character
- Highly diverse neighborhood (Simpson 0.73)
- Race & ethnicity
- White 41% Black 25% Hispanic / Latino 19% Two or more races 15% Asian 6% Native American 2%
- Hispanic origin (detail)
- Mexican 15%
- Common ancestry
- Italian 1% Lithuanian 1% Slovak 1%
- Foreign-born
- 9% · Canada, Vietnam
- Languages at home
- 83% English-only · Spanish 11% Vietnamese 3% Other Asian/Pacific 1%
Political lean MEDSL · Oklahoma
- 2024 margin
- Toss-up / Even · D 48.0% · R 49.7% · Other 2.3%
- 2008→2024 swing
- +15.1pp toward D · 2008: -16.8pp · 2024: -1.7pp
- All cycles
- 2024: R+1.7 2020: R+1.1 2016: R+10.5 2012: R+16.7 2008: R+16.8
Not yet ingested
- Civics
- —
Market trends
- HPI YoY
- ▼ -20.17%
- Current HPI
- 232.4241
- Rent YoY
- ▲ 4.76%
- Metro
- Oklahoma City, OK
- State GDP YoY
- ▲ 1.55%
- F500 in state
- 6
Industry mix (Fortune 500 HQ in OK)
| Industry | F500 HQs | Revenue |
|---|---|---|
| Energy | 3 | $48B |
|
||
Price history
+3625.0% since first listed20 events — show timeline
- 2026-05-22 Price Changed $149,000 MLSOK
- 2026-02-25 Price Changed $159,900 MLSOK
- 2026-02-02 Listed $164,000 MLSOK
- 2023-12-05 Sold (Public Records) $119,000 Public Records
- 2023-11-30 Sold (MLS) $119,000 MLSOK
- 2023-10-25 Pending — MLSOK
- 2023-10-22 Price Changed $109,900 MLSOK
- 2023-10-10 Price Changed $119,900 MLSOK
- 2023-09-26 Price Changed $134,900 MLSOK
- 2023-09-13 Listed $149,900 MLSOK
- 2018-06-18 Sold (MLS) $68,509 MLSOK
- 2018-06-14 Sold (Public Records) $526,000 Public Records
- 2018-04-18 Pending — MLSOK
- 2018-04-10 Listed $77,640 MLSOK
- 2017-09-28 Sold (Public Records) $60,000 Public Records
- 2017-09-26 Sold (MLS) $60,000 MLSOK
- 2017-09-06 Pending — MLSOK
- 2017-08-31 Price Changed $65,000 MLSOK
- 2017-07-01 Listed $69,900 MLSOK
- 1985-05-01 Sold (Public Records) $4,000 Public Records
Property tax history
+4.6%/yrLatest (2025): $1,321 · +1.6% YoY. Source: county tax records.
Cash-flow waterfall
monthlySold comps — $/sqft
last 12 mo · ≤1 miLoading sold comps…