7880 54th Ave N #106 · West Lealman, FL
Flood risk 7/10 · Major
- FEMA flood zone
- X (shaded)
- Chance of flooding over 30 yrs
- 0.9%
- Est. flood insurance / yr
- $507 – $1,088
Fire risk 1/10 · Minimal
- Est. fire insurance / yr
- $947 – $1,759
Heat risk 10/10 · Severe
- Hot days now (above 107°F)
- 7 days/yr
- Hot days in 30 yrs
- 24 days/yr
Wind risk 10/10 · Severe
- Chance of severe wind over 30 yrs
- 99.0%
Air-quality risk 4/10 · Minor
- Unhealthy air days now
- 4 days/yr
- Unhealthy air days in 30 yrs
- 4 days/yr
Risk factors via First Street. Map © Google.
Why this score? — see what drove the C- grade
The composite is a weighted blend of 9 inputs, each scored 0–100. Each bar is that input's sub-score; the figure is the points it added to the 100-point composite (weight × sub-score).
- Cash flow +22.8/30.0
- 1% rule +8.5/10.0
- DSCR +7.3/10.0
- Schools +4.3/10.0
- Livability +4.0/5.0
- Rent growth +2.7/5.0
- Condition / age +2.5/5.0
- ARV discount +0.0/15.0
- Appreciation +0.0/10.0
$137,900
🖨 Deal sheet 📄 Offer letter ✓ Due diligence
Listing remarks
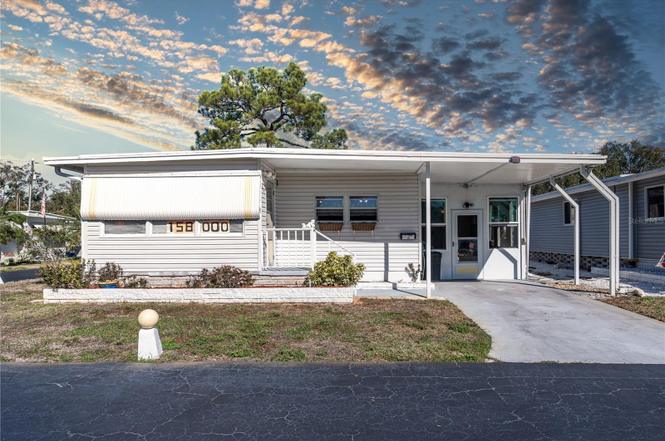
Move-In Ready Mobile Home in a Well-Maintained Community Welcome to this well-kept mobile home in excellent condition, located in a quiet, nicely maintained community in St. Petersburg. The home has been cared for and offers a comfortable, functional layout ideal for full-time living or a seasonal residence. The seller is willing to freshly paint the interior and replace the brick backyard area with grass, creating a cleaner, more inviting outdoor space for relaxing or entertaining. This flexibility allows the buyer to enjoy a refreshed look without the hassle of renovations. Enjoy the benefits of a peaceful neighborhood setting while remaining close to shopping, dining, beaches, and maj
Key facts
- Brick backyard area
- Move in ready
- Parking
Tags
Property features AI
Finance
- Other: Furnished; Condo land included
- Financial info: Total monthly fees $272, total annual fees $3,264
- HOA & community: Monthly association fee of $272 (association: Karen Imus); Association fees required; Community has street lights; Senior community; Pets allowed (cats and dogs, breed restrictions, size limit up to 45 lbs)
Exterior
- Parking: Covered parking; Carport with 1 space
- Security: Smoke detector(s)
- Utilities: Public water; Public sewer; Cable available and connected; Electricity connected; Phone available; Sewer connected; Water connected; Underground utilities; Sprinkler recycled
- Home design: Residential mobile home (double wide); Suncoast model; One story; Faces south; Entry on one level
- Construction: Vinyl siding with frame construction; Other roof; Slab foundation; Built as a double wide mobile home
- Exterior features: Covered, enclosed patio/porch (Florida room); Awnings; Private mailbox; Rain gutters; Sliding doors; Chain link fencing; Shed(s); Corner lot; Paved lot/road; Near public transit; Flood zone (flood insurance required)
Interior
- Kitchen: Dishwasher; Disposal; Microwave; Range; Refrigerator
- Bedrooms: 2 bedrooms
- Flooring: Carpet; Ceramic tile; Vinyl
- Bathrooms: 1 full bath; 1 half bath
- Heating & cooling: Central heating (electric); Central air conditioning
- Interior features: Ceiling fans; Thermostat; Walk-in closet(s); Window treatments; Smoke detector(s)
- Laundry & utility: Washer; Dryer; Laundry located outside
Neighborhood map
What this means for you Summary
Snapshot
- This is a 2-bed/2.0-bath manufactured listed at $138k.
Deal economics
- At list price, monthly cash flow is $173 ($2k/yr) — positive.
- The deal already cash-flows at list — no discount required.
- Meets the 1% rule at list price ($2k rent vs $138k).
- Recommended offer: $121k (12.0% below list) — sets the bar for market timing.
- Cap rate 8.4% vs local median 1.8% in West Lealman — top-decile yield for the area; either an underpriced asset or a hidden risk that comps aren't pricing in. Stress-test before assuming the spread holds.
Location & tenants
- Location reads 81/100 on livability (#84 in FL, #1,396 nationally) — a professional / high-income tenant draw. Strengths: commute A+, cost of living A+, housing A+; Watch: employment D+, amenities F.
- Pinellas (suburban): math 51% / reading 51% proficiency, ranked #31 of 73 in FL (top 42%) — acceptable for families but not a draw, mixed tenant base, ~2y average lease.
- Zoned schools: Seventy-Fourth St. Elementary (math 30% / reading 22%, grade F, #2,015 of 2,144 statewide, top 94%, 444 students, 72% FRL); Dixie M. Hollins High School (math 30% / reading 40%, grade F, #379 of 667 statewide, top 58%, 1,822 students, 56% FRL) — zoned schools average 64% FRL vs 48% district-wide (16 pts higher); higher-poverty schools than district average — tighter screening recommended.
- Zoned-school proficiency averages 30% at this address vs 51% district-wide (-20 pts) — the specific schools serving this property underperform the Pinellas average; the district grade overstates school quality for this exact location.
- Market conditions: Rents flat; 309 active listings in the ZIP; 33 comparable units currently listed for rent nearby; rentals at typical pace (median 22d on market — plan ~3-4 weeks tenant-placement turnaround); 2,676 units permitted in Pinellas County in 2024 (1,422 in 5+ unit buildings).
Forward outlook
- Local home prices are declining (-3.0%/yr); year-one equity from $953 of loan paydown is wiped out by about $4k of value loss. Plan a longer hold.
- Pinellas County population projected at +14% by 2050 — modest demand growth; plan on rents tracking national, not racing it.
Negotiation context
- It's been on market 146 days — a 12% lower offer ($121k) is reasonable based on typical stale-listing flexibility.
- 4 sale attempts; this cycle's ask has dropped $20k (13%) from the opening price — seller is motivated, your offer sets the floor, not the list.
- Current owner paid $93k; 48% above their basis — modest negotiation headroom, anchor on the comps not their cost.
Risks & watch-outs
- Watch-outs: flood insurance adds $66/mo.
- Climate carrying-cost: major flood risk; severe wind risk, 99% chance of damaging wind over 30y; extreme-heat days projected 7→24/yr by 2055 (HVAC capex compounding) — expect insurance premiums to compound above CPI over the hold.
Questions for the listing agent
- It's been on market 146 days. Have you received any prior offers? Is the seller open to a 12% concession, seller financing, or rate buy-down credit?
- Built in 1970 — when were the roof, HVAC, electrical panel, plumbing, and water heater last replaced?
- What's the actual annual flood-insurance premium (NFIP or private), and is the property in a SFHA with mandatory coverage?
- What does the HOA fee cover, when was the last increase, and are there any pending special assessments or reserve-fund shortfalls?
- Why hasn't it sold? Are there any deal-killer items the seller is aware of (foundation, flood, title, zoning, code violations)?
- Is there a deadline driving the sale (1031 exchange, divorce, estate, relocation)? That informs how much negotiation room exists.
- What's the average days-on-market for RENTAL listings here right now (not sales)? A rising rental-DOM trend means longer vacancies and softer asking-rent achievability than the comps imply.
- What's the recent tenant-quality profile in this submarket — average credit score on applications, eviction rate, late-payment / NSF rate, and stable-employment percentage? A property-management company in the area should have these aggregated.
- How much new for-sale + rental construction is in the pipeline within 1–3 miles? Heavy new supply typically softens prices + rents 12–24 months out; constrained supply supports both.
Investment metrics
- 1% rule
- 1.35% ✓
- Cap rate
- 8.38%
- Cash-on-cash
- 7.46%
- DSCR
- 1.33
- GRM
- 6.2
CMA / ARV
- ARV (on-the-fly)
- $111,672
- Comps found
- 4
Show comp detail 4 sales within ~0.75 mi
| Address | Dist | Beds/Ba | Sqft | Sold | Price | $/sf | Match |
|---|---|---|---|---|---|---|---|
| 5254 Yellow Pine St N | 0.05mi | 3/1.5 (+1) | 1,056 (-6%) | 11mo | $149,000 | $141 | 70 |
| 7777 46th Ave N #36 | 0.39mi | 2/2.0 | 960 (-15%) | 1mo | $50,000 | $52 | 56 |
| 7777 46th Ave N #33 | 0.39mi | 2/2.0 | 960 (-15%) | 6mo | $95,000 | $99 | 52 |
| 5131 81st St N | 0.33mi | 2/2.0 | 960 (-15%) | 20mo | $85,000 | $89 | 43 |
Match score weights: distance 35% · size 25% · config 20% · recency 20%. Top-matched comps best support the ARV.
Projected returns pro-forma
-3.0% appreciation · 0.99% rent growth · sell at horizon
- IRR
- -10.8%
- Equity multiple
- 0.62×
- Total profit
- $-14,743
- Equity at exit
- $20,561
- IRR
- -5.5%
- Equity multiple
- 0.69×
- Total profit
- $-12,159
- Equity at exit
- $11,923
Cash invested: $38,612 (down + closing). Projections, not guarantees.
Landlord ↔ Tenant lean methodology
- Overall (STATE)
- 87 Strongly Landlord-Friendly
- State Florida
- 87 Strongly Landlord-Friendly · R+3
- County
- — inherits STATE
- City
- — inherits STATE
ZIP-level market 33709
- Rents YoY
- 1.0%
- Active inventory
- 309
- Price-to-rent
- 6.2×
Monthly cashflow live
- Estimated rent
- $1,857 high interval (Pro) →
- Mortgage (P&I)
- −$723
- Tax from tax record
- −$175 /mo · $2,095/yr
- Insurance
- −$57
- Flood insurance flood zone
- −$66 /mo · $798/yr
- HOA
- −$272
- Vacancy / Maint / Mgmt
- −$390
- Net cashflow
- $173
Break-even live
UW: 25.0% down · 7.5% · 30yr · 1.5% tax · 5.0% vac · 8.0% maint · 8.0% mgmt
Financing live
Cash to close
- Down payment
- $34,475
- Closing costs
- $4,137
- Reserves months
- —
- Total cash needed
- —
Loan-product check · same deal, 3 products live
Conventional
25% down · 7.5% · 30yr
- Down + closing
- —
- Monthly P&I
- —
- Monthly cashflow
- —
- DSCR
- —
- Eligible?
- —
Personal DTI + credit; lowest rate.
DSCR
20% down · 8.5% · 30yr
- Down + closing
- —
- Monthly P&I
- —
- Monthly cashflow
- —
- DSCR
- —
- Eligible?
- —
No personal income docs; deal must DSCR.
Hard money
10% down · 12.0% · 12mo
- Down + closing
- —
- Monthly P&I
- —
- Monthly cashflow
- —
- DSCR
- —
- Eligible?
- —
Short-term bridge; refi at stabilization.
Rent comps 33 comps
| Address | Beds | Baths | Sqft | Rent | $/sqft | DOM | Units | Dist |
|---|---|---|---|---|---|---|---|---|
| 5521 80th St N #312 Saint Petersburg, FL | 1.0 | 1.0 | 1055 | $1,500 | $1.42 | 4d | 1 | 0.22mi |
| 5357 81st St N #14 Saint Petersburg, FL | 2.0 | 2.0 | 1110 | $1,550 | $1.40 | 24d | 1 | 0.25mi |
| 5287 81st St N #26 Saint Petersburg, FL | 2.0 | 2.0 | 1010 | $1,500 | $1.49 | 4d | 1 | 0.26mi |
| 5217 81st St N #22 Saint Petersburg, FL | 2.0 | 1.0 | 1010 | $1,700 | $1.68 | 24d | 1 | 0.27mi |
| 5530 80th St N Unit C204 Saint Petersburg, FL | 1.0 | 1.0 | 880 | $1,450 | $1.65 | 24d | 1 | 0.31mi |
| 5725 80th St N #210 Saint Petersburg, FL | 2.0 | 2.0 | 1125 | $1,900 | $1.69 | 24d | 1 | 0.35mi |
| 4653 78th Ln N St Petersburg, FL | 3.0 | 2.0 | 1312 | $2,695 | $2.05 | 24d | 1 | 0.39mi |
| 5257 81st Ln N #6 Saint Petersburg, FL | 1.0 | 1.0 | 745 | $1,375 | $1.85 | 24d | 1 | 0.40mi |
| 5750 80th St N St Petersburg, FL | 1.0–2.0 | 1.0–1.5 | 987 | $1,800 | $1.82 | 24d | 2 | 0.40mi |
| 8002 48th Ave N Saint Petersburg, FL | 1.0 | 1.0 | 1050 | $2,000 | $1.90 | 3d | 1 | 0.41mi |
| 5980 80th St N #205 St Petersburg, FL | 2.0 | 2.0 | 1100 | $1,950 | $1.77 | 4d | 1 | 0.45mi |
| 7249 Parkside Villas Dr N Saint Petersburg, FL | 2.0 | 2.0 | 956 | $1,950 | $2.04 | 24d | 1 | 0.46mi |
| 7238 55th Ave N Saint Petersburg, FL | 2.0 | 2.0 | 1085 | $1,899 | $1.75 | 18d | 1 | 0.48mi |
| 4930 72nd St N Saint Petersburg, FL | 2.0 | 1.0 | 1352 | $1,950 | $1.44 | 4d | 1 | 0.49mi |
| 7140 55th Ave N Saint Petersburg, FL | 3.0 | 2.0 | 1085 | $2,000 | $1.84 | 22d | 1 | 0.56mi |
| 4801 71st St N Saint Petersburg, FL | 2.0 | 1.0 | 726 | $1,900 | $2.62 | 4d | 1 | 0.65mi |
| 4801 71st St N St Petersburg, FL | 2.0 | 1.0 | 726 | $1,900 | $2.62 | 18d | 1 | 0.65mi |
| 5410 70th Way N Saint Petersburg, FL | 3.0 | 1.0 | 1160 | $2,100 | $1.81 | 4d | 1 | 0.66mi |
| 5410 70th Way N Saint Petersburg, FL | 3.0 | 1.0 | 1354 | $2,100 | $1.55 | 3d | 1 | 0.66mi |
| 4711 Sunnydale Ln N Unit A St. Petersburg, FL | 2.0 | 1.0 | 800 | $1,750 | $2.19 | 24d | 1 | 0.80mi |
| 5136 68th St N Unit C St. Petersburg, FL | 2.0 | 1.0 | 957 | $1,700 | $1.78 | 4d | 1 | 0.81mi |
| 5136 68th St N Unit B St. Petersburg, FL | 3.0 | 1.0 | 1302 | $1,900 | $1.46 | 4d | 1 | 0.81mi |
| 6366 71st St N Pinellas Park, FL | 2.0 | 2.0 | 970 | $2,200 | $2.27 | 24d | 1 | 0.85mi |
| 6468 Bonnie Bay Cir N Pinellas Park, FL | 2.0 | 2.0 | 970 | $1,800 | $1.86 | 14d | 1 | 0.85mi |
| 4701 68th St N Saint Petersburg, FL | 1.0 | 1.0 | 700 | $1,099 | $1.57 | 24d | 1 | 0.90mi |
| 6398 Woodland Blvd Unit 1366035P Pinellas Park, FL | 3.0 | 2.0 | 1367 | $5,922 | $4.33 | 17d | 1 | 0.91mi |
| 3855 39th Ave N St Petersburg, FL | 2.0 | 2.5 | 1100 | $1,850 | $1.68 | 22d | 1 | 0.94mi |
| 4390 68th St N Saint Petersburg, FL | 3.0 | 1.0 | 864 | $1,950 | $2.26 | 24d | 1 | 0.95mi |
| 3451 79th St N Saint Petersburg, FL | 2.0 | 2.0 | 1150 | $2,500 | $2.17 | 24d | 1 | 1.16mi |
| 6522 54th Ave N Saint Petersburg, FL | 1.0–3.0 | 1.0–2.0 | 892 | $1,600 | $1.79 | 2d | 10 | 1.16mi |
| 3501 Boca Ciega Dr N Saint Petersburg, FL | 2.0 | 2.0 | 1144 | $3,400 | $2.97 | 4d | 1 | 1.18mi |
| 6524 54th Ave N Unit 2 St. Petersburg, FL | 2.0 | 1.0 | 840 | $1,360 | $1.62 | 24d | 1 | 1.18mi |
| 9071 47th Ave N St. Petersburg, FL | 2.0 | 2.0 | 1100 | $2,000 | $1.82 | 24d | 1 | 1.31mi |
HOA detail
- Monthly dues
- $272 · $3,264/yr
Listing history 26 events
-
2026-06-18days on market $137,900 Active 146 DOM
-
2026-06-17days on market $137,900 Active 145 DOM
-
2026-06-16days on market $137,900 Active 144 DOM
-
2026-06-15days on market $137,900 Active 143 DOM
-
2026-06-13days on market $137,900 Active 141 DOM
-
2026-06-09days on market $137,900 Active 137 DOM
-
2026-06-08days on market $137,900 Active 136 DOM
-
2026-06-07days on market $137,900 Active 135 DOM
-
2026-06-04days on market $137,900 Active 132 DOM
-
2026-06-03days on market $137,900 Active 131 DOM
-
2026-06-01days on market $137,900 Active 129 DOM
-
2026-05-31days on market $137,900 Active 128 DOM
-
2026-05-20price $137,900
-
2026-04-02status Active
-
2026-03-31historical
-
2026-03-26price $139,900
-
2026-01-22$157,900 Active
-
2025-11-21historical
-
2025-08-16price $159,900
-
2025-06-22status Active
-
2025-06-19historical
-
2025-03-10price $169,999
-
2025-01-23$174,000 Active
-
2006-10-01soldstatus $93,000
-
2001-04-01soldstatus $51,000
-
1993-08-01soldstatus $29,000
ⓘ Source: listings_history table (triggers on properties + properties_extension) + one-shot
backfill from property_details.listing_events for pre-trigger history.
Tax reassessment forecast FL · Resets to sale price
- Current annual tax
- $2,095 · $175/mo
- Projected year-2 tax
- $2,095 · $175/mo
- Expected delta
- $0/yr ($0/mo · 0.0%)
ⓘ Screening estimate from a state-policy table — verify with the county assessor before closing.
Climate risk First Street
- Flood 7/10 Severe FEMA zone X (shaded) · 90% chance over 30 yrs
- Wildfire 1/10 Low
- Heat 10/10 Extreme 7 d/yr ≥107°F today · 24 d/yr by 30 yrs out
- Wind 10/10 Extreme 99% chance of damaging wind over 30 yrs
- Air quality 4/10 Moderate 4 unhealthy d/yr today · 4 by 30 yrs out
Nearby sold comps map
Loading sold comps map…
Walkable amenities ~0.75 mi
Loading nearby amenities…
Taxation est. · year 1
- Rental income
- $22,286
- − Mortgage interest
- −$7,725
- − Property taxes
- −$2,095
- − Insurance
- −$1,487
- − Repairs & maintenance
- −$1,783
- − Management
- −$1,783
- − HOA
- −$3,264
- − Depreciation
- −$4,012
- Taxable income
- $138
- Est. tax owed @ 24.0%
- −$33
- After-tax cash flow
- $2,049/yr
For passive investors: Depreciation is non-cash, so a rental often shows a tax loss while cash-flowing — sheltering income. Rental losses are passive: they offset passive income freely, and up to $25,000/yr can offset ordinary (W-2) income if you actively participate and your MAGI is under $100k (phasing out to $0 by $150k); unused losses carry forward. On sale, claimed depreciation is recaptured at up to 25%, and gains may owe capital-gains tax (a 1031 exchange can defer both). Figures are a year-1 estimate at your 24.0% rate — not tax advice; consult a CPA.
Schools (NCES district)
- District
- Pinellas
- NCES district ID
- 1201560
- Math proficiency
- 51% ▼ -5.00%
- Reading proficiency
- 51% ▼ -3.00%
- Median HH income
- $46,270
- Composite
- 43.27/100
- National rank
- #3046
- State rank
- #31 of 73 in FL
Livability — West Lealman
- Score
- 81/100
- State rank
- #84
- US rank
- #1396
Category grades
Schools grade is shown separately in the Schools card above.
Census & demographics
- Census place
- West Lealman, FL
- County
- Pinellas County · 939,478 people
- City population
- 25,371
- Metro
- Tampa-St. Petersburg-Clearwater, FL
- Population (ZIP)
- 25,050
- Household income
- $53,501
- Rent vs Own
- Severe rent burden
- 712.0
Population outlook (Pinellas County) Hauer SSP2
- Today (2025)
- 1,027,532 people
- By 2030
- 1,063,586 · +3.5%
- By 2040
- 1,125,020 · +9.5%
- By 2050
- 1,168,637 · +13.7%
- By 2075
- 1,265,188 · +23.1%
- By 2100
- 1,260,357 · +22.7%
Race, ethnicity, and origin ACS 2023
- Neighborhood character
- Predominantly White (73%)
- Race & ethnicity
- White 73% Hispanic / Latino 11% Two or more races 10% Black 5% Asian 5%
- Hispanic origin (detail)
- Mexican 2% Puerto Rican 3% Cuban 2% Dominican 1%
- Common ancestry
- Lithuanian 3% Romanian 3% Slovak 2%
- Foreign-born
- 14% · Canada, Vietnam, Jamaica
- Languages at home
- 84% English-only · Spanish 9% Other Indo-European 2% Vietnamese 2%
Political lean MEDSL · Pinellas
- 2024 margin
- Lean R (+5.2) · D 46.9% · R 52.1%
- 2008→2024 swing
- -13.5pp toward R · 2008: 8.3pp · 2024: -5.2pp
- All cycles
- 2024: R+5.2 2020: D+0.2 2016: R+1.1 2012: D+5.6 2008: D+8.3
Not yet ingested
- Civics
- —
Market trends
- HPI YoY
- ▼ -416.74%
- Current HPI
- 391.368
- Rent YoY
- ▲ 0.99%
- Metro
- Tampa-St. Petersburg-Clearwater, FL
- State GDP YoY
- ▲ 3.28%
- F500 in state
- 36
Industry mix (Fortune 500 HQ in FL)
| Industry | F500 HQs | Revenue |
|---|---|---|
| Industrial Technology | 2 | $29B |
|
||
| Insurance | 2 | $17B |
|
||
| Retail | 1 | $60B |
|
||
| Technology Distribution | 1 | $58B |
|
||
| Homebuilding | 1 | $35B |
|
||
| Technology Manufacturing | 1 | $35B |
|
||
Price history
+375.5% since first listed14 events — show timeline
- 2026-05-20 Price Changed $137,900 Stellar MLS as Distributed by MLS Grid
- 2026-04-02 Relisted — Stellar MLS as Distributed by MLS Grid
- 2026-03-31 Listing Removed — Stellar MLS as Distributed by MLS Grid
- 2026-03-26 Price Changed $139,900 Stellar MLS as Distributed by MLS Grid
- 2026-01-22 Listed $157,900 Stellar MLS as Distributed by MLS Grid
- 2025-11-21 Listing Removed — Stellar MLS as Distributed by MLS Grid
- 2025-08-16 Price Changed $159,900 Stellar MLS as Distributed by MLS Grid
- 2025-06-22 Relisted — Stellar MLS as Distributed by MLS Grid
- 2025-06-19 Listing Removed — Stellar MLS as Distributed by MLS Grid
- 2025-03-10 Price Changed $169,999 Stellar MLS as Distributed by MLS Grid
- 2025-01-23 Listed $174,000 Stellar MLS as Distributed by MLS Grid
- 2006-10-01 Sold (Public Records) $93,000 Public Records
- 2001-04-01 Sold (Public Records) $51,000 Public Records
- 1993-08-01 Sold (Public Records) $29,000 Public Records
Property tax history
+6.8%/yrLatest (2025): $2,095 · -1.1% YoY. Source: county tax records.
Cash-flow waterfall
monthlySold comps — $/sqft
last 12 mo · ≤1 miLoading sold comps…