9435 Gulf Shore Ter · Ellenton, FL
Flood risk No data
- FEMA flood zone
- —
- Chance of flooding over 30 yrs
- —
- Est. flood insurance / yr
- —
Fire risk No data
- Est. fire insurance / yr
- —
Heat risk No data
- Hot days now (above threshold)
- —
- Hot days in 30 yrs
- —
Wind risk No data
- Chance of severe wind over 30 yrs
- —
Air-quality risk No data
- Unhealthy air days now
- —
- Unhealthy air days in 30 yrs
- —
Risk factors via First Street. Map © Google.
Why this score? — see what drove the D+ grade
The composite is a weighted blend of 9 inputs, each scored 0–100. Each bar is that input's sub-score; the figure is the points it added to the 100-point composite (weight × sub-score).
- Cash flow +17.9/30.0
- ARV discount +7.5/15.0
- 1% rule +5.7/10.0
- DSCR +5.6/10.0
- Schools +4.4/10.0
- Livability +3.8/5.0
- Condition / age +2.5/5.0
- Rent growth +2.3/5.0
- Appreciation +0.0/10.0
$286,000
🖨 Deal sheet 📄 Offer letter ✓ Due diligence
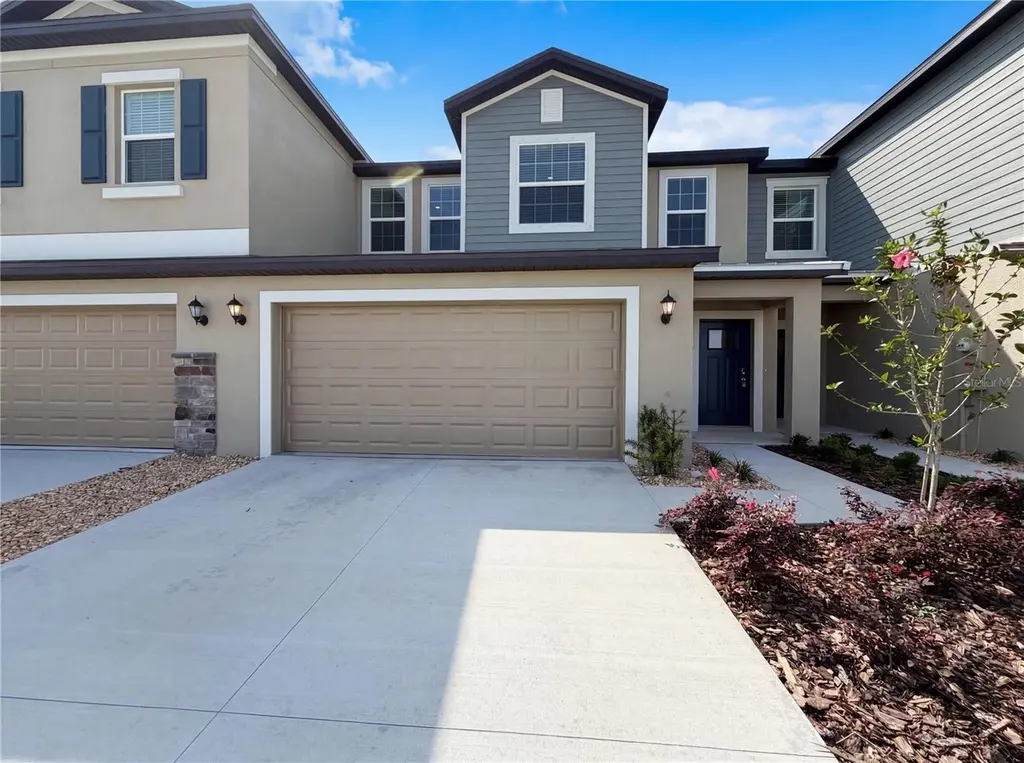
Listing remarks
Introducing 9435 Gulf Shore Ter, a residence designed for practical daily living with a focus on straightforward utility. The kitchen is equipped with all stainless steel appliances, providing a consistent aesthetic for daily use. The primary bathroom features double sinks, adding to its functional design. T This property is a perfect blend of comfort and style, making it a must-see. Included 100-Day Home Warranty with buyer activation
Key facts
- $274 HOA
- 2 garage spots
- Built 2025
Property features AI
Finance
- Other: MPUD zoning; Property listed as part of community Parrish Lakes Phase IIB1 and I; Lot about 0.07 acres
- Financial info: Total monthly fees (combined): $274.36; Total annual fees (combined): $3,292.32; Lease restrictions apply
- HOA & community: Has HOA (monthly fee $135); Additional quarterly association fee ($418.08); Association approval required; Pets allowed
Exterior
- Parking: Driveway; Attached 2-car garage
- Security: Owned security system
- Utilities: Public water; Public sewer; Electricity available; Natural gas available
- Home design: Residential townhouse; Two levels; East-facing entry
- Construction: Block and stucco construction; Shingle roof; Slab foundation
- Exterior features: Other exterior features; Paved road access
Interior
- Kitchen: Range
- Bedrooms: 4 bedrooms
- Flooring: Carpet
- Bathrooms: 2 full baths; 1 half bath
- Heating & cooling: Central heating; Central air conditioning
- Interior features: Living room and dining room combo; Stone counters
- Laundry & utility: Laundry area (other)
Neighborhood map
What this means for you Summary
Snapshot
- This is a 4-bed/2.5-bath land listed at $286k.
Deal economics
- At list price, monthly cash flow is $239 ($3k/yr) — positive.
- The deal already cash-flows at list — no discount required.
- Meets the 1% rule at list price ($3k rent vs $286k).
- Recommended offer: $269k (6.0% below list) — sets the bar for market timing.
- Cap rate 7.3% vs local median 4.5% in Ellenton — top-decile yield for the area; either an underpriced asset or a hidden risk that comps aren't pricing in. Stress-test before assuming the spread holds.
Location & tenants
- Location reads 76/100 on livability (#232 in FL, #3,666 nationally) — a middle-class / working-renter tenant base. Strengths: cost of living A+, housing A+, health & safety A+; Watch: schools D+, amenities F, commute F.
- Manatee (suburban): math 54% / reading 50% proficiency, ranked #26 of 73 in FL (top 36%) — acceptable for families but not a draw, mixed tenant base, ~2y average lease.
- Market conditions: Rents soft (-0.9%/yr); 2170 active listings in the ZIP; 22 comparable units currently listed for rent nearby; rentals at typical pace (median 16d on market — plan ~3-4 weeks tenant-placement turnaround); high-income renter base; 7,472 units permitted in Manatee County in 2024 (1,782 in 5+ unit buildings).
- This rent runs 32% of the median local income ($114k/yr) — at the standard rent-burdened threshold; future hikes will face affordability resistance.
Forward outlook
- Local home prices are declining (-3.0%/yr); year-one equity from $2k of loan paydown is wiped out by about $9k of value loss. Plan a longer hold.
- Manatee County population projected at +43% by 2050 — long-run rental-demand tailwind backs the buy-and-hold thesis.
Negotiation context
- It's been on market 90 days — a 6% lower offer ($269k) is reasonable based on typical stale-listing flexibility.
Questions for the listing agent
- It's been on market 90 days. Have you received any prior offers? Is the seller open to a 6% concession, seller financing, or rate buy-down credit?
- What does the HOA fee cover, when was the last increase, and are there any pending special assessments or reserve-fund shortfalls?
- Why hasn't it sold? Are there any deal-killer items the seller is aware of (foundation, flood, title, zoning, code violations)?
- Is there a deadline driving the sale (1031 exchange, divorce, estate, relocation)? That informs how much negotiation room exists.
- Schools are D-rated, which usually means shorter tenancies and higher turnover. Who's the typical renter profile here, and what's been the actual vacancy rate?
- The area grade is low — what's the realistic commute time and amenity access for the typical tenant pool here? Any planned neighborhood developments (good or bad) we should know about?
- What's the average days-on-market for RENTAL listings here right now (not sales)? A rising rental-DOM trend means longer vacancies and softer asking-rent achievability than the comps imply.
- What's the recent tenant-quality profile in this submarket — average credit score on applications, eviction rate, late-payment / NSF rate, and stable-employment percentage? A property-management company in the area should have these aggregated.
- How much new for-sale + rental construction is in the pipeline within 1–3 miles? Heavy new supply typically softens prices + rents 12–24 months out; constrained supply supports both.
Investment metrics
- 1% rule
- 1.07% ✓
- Cap rate
- 7.30%
- Cash-on-cash
- 3.59%
- DSCR
- 1.16
- GRM
- 7.8
CMA / ARV
No comps found within radius.
Projected returns pro-forma
-3.0% appreciation · 0.0% rent growth · sell at horizon
- IRR
- -14.4%
- Equity multiple
- 0.50×
- Total profit
- $-39,876
- Equity at exit
- $42,644
- IRR
- -12.1%
- Equity multiple
- 0.39×
- Total profit
- $-48,967
- Equity at exit
- $24,728
Cash invested: $80,080 (down + closing). Projections, not guarantees.
Landlord ↔ Tenant lean methodology
- Overall (STATE)
- 87 Strongly Landlord-Friendly
- State Florida
- 87 Strongly Landlord-Friendly · R+3
- County
- — inherits STATE
- City
- — inherits STATE
ZIP-level market 34219
- Home prices YoY
- -23.7%
- Rents YoY
- -0.9%
- Active inventory
- 2170
- Price-to-rent
- 7.8×
Monthly cashflow live
- Estimated rent
- $3,050 high interval (Pro) →
- Mortgage (P&I)
- −$1,500
- Tax from tax record
- −$277 /mo · $3,322/yr
- Insurance
- −$119
- HOA
- −$274
- Vacancy / Maint / Mgmt
- −$640
- Net cashflow
- $239
Break-even live
UW: 25.0% down · 7.5% · 30yr · 1.5% tax · 5.0% vac · 8.0% maint · 8.0% mgmt
Financing live
Cash to close
- Down payment
- $71,500
- Closing costs
- $8,580
- Reserves months
- —
- Total cash needed
- —
Loan-product check · same deal, 3 products live
Conventional
25% down · 7.5% · 30yr
- Down + closing
- —
- Monthly P&I
- —
- Monthly cashflow
- —
- DSCR
- —
- Eligible?
- —
Personal DTI + credit; lowest rate.
DSCR
20% down · 8.5% · 30yr
- Down + closing
- —
- Monthly P&I
- —
- Monthly cashflow
- —
- DSCR
- —
- Eligible?
- —
No personal income docs; deal must DSCR.
Hard money
10% down · 12.0% · 12mo
- Down + closing
- —
- Monthly P&I
- —
- Monthly cashflow
- —
- DSCR
- —
- Eligible?
- —
Short-term bridge; refi at stabilization.
Rent comps 22 comps
| Address | Beds | Baths | Sqft | Rent | $/sqft | DOM | Units | Dist |
|---|---|---|---|---|---|---|---|---|
| 9009 Moccasin Wallow Rd Parrish, FL | 3.0–4.0 | 2.5 | 1581 | $2,304 | $1.46 | 1d | 32 | 0.18mi |
| 9276 Bonita Mar Dr Parrish, FL | 4.0 | 2.5 | 2466 | $4,250 | $1.72 | 23d | 1 | 0.26mi |
| 8541 Bella Mar Trl Parrish, FL | 5.0 | 3.0 | 2389 | $2,800 | $1.17 | 10d | 1 | 0.27mi |
| 8505 Bella Mar Trl Parrish, FL | 4.0 | 2.5 | 1870 | $2,750 | $1.47 | 16d | 1 | 0.28mi |
| 9224 Bonita Mar Dr Parrish, FL | 3.0 | 2.5 | 1799 | $2,290 | $1.27 | 23d | 1 | 0.32mi |
| 9207 Bonita Mar Dr Parrish, FL | 3.0 | 2.5 | 1666 | $2,275 | $1.37 | 23d | 1 | 0.34mi |
| 9432 Bella Mar Trl Parrish, FL | 4.0 | 2.5 | 2045 | $2,699 | $1.32 | 16d | 1 | 0.46mi |
| 9262 Gulf Haven Dr Palmetto, FL | 3.0 | 2.5 | 2043 | $2,750 | $1.35 | 14d | 1 | 0.57mi |
| 7566 Sea Oak Ct Palmetto, FL | 3.0 | 2.5 | 1807 | $2,700 | $1.49 | 21d | 1 | 0.68mi |
| 7562 Sea Oak Ct Palmetto, FL | 3.0 | 2.0 | 1433 | $2,400 | $1.67 | 21d | 1 | 0.69mi |
| 10120 Abrazo DR Palmetto, FL | 1.0–3.0 | 1.0–2.5 | 1122 | $2,675 | $2.38 | 2d | 24 | 0.76mi |
| 9962 Last Light Gln Parrish, FL | 4.0 | 2.0 | 1740 | $2,495 | $1.43 | 3d | 1 | 0.81mi |
| 10225 Daybreak Gln Parrish, FL | 4.0 | 3.0 | 1978 | $2,600 | $1.31 | 3d | 1 | 1.04mi |
| 7122 87th Ln E Palmetto, FL | 4.0 | 2.0 | 1593 | $2,750 | $1.73 | 23d | 1 | 1.08mi |
| 10455 Wet Marsh Cv Parrish, FL | 3.0 | 2.0 | 1635 | $2,650 | $1.62 | 10d | 1 | 1.09mi |
| 8326 Abalone Loop Parrish, FL | 4.0 | 3.0 | 2711 | $3,650 | $1.35 | 3d | 1 | 1.15mi |
| 8330 Abalone Loop Parrish, FL | 3.0 | 2.5 | 2473 | $2,900 | $1.17 | 16d | 1 | 1.16mi |
| 10416 High Noon Trl Parrish, FL | 3.0 | 2.0 | 1412 | $2,400 | $1.70 | 3d | 1 | 1.16mi |
| 8614 Mercator Ct Parrish, FL | 4.0 | 2.5 | 2910 | $3,300 | $1.13 | 23d | 1 | 1.18mi |
| 9544 Sandy Bluffs Cir Parrish, FL | 5.0 | 3.0 | 2557 | $2,950 | $1.15 | 3d | 1 | 1.19mi |
| 11612 Armada Way Parrish, FL | 4.0 | 2.0 | 2112 | $3,400 | $1.61 | 20d | 1 | 1.42mi |
| 11628 Moonsail Dr Parrish, FL | 3.0 | 2.0 | 2144 | $3,500 | $1.63 | 21d | 1 | 1.46mi |
HOA detail
- Monthly dues
- $274 · $3,288/yr
Listing history 22 events
-
2026-06-18status $286,000 Pending 90 DOM
-
2026-06-18days on market $286,000 Active 90 DOM
-
2026-06-17days on market $286,000 Active 89 DOM
-
2026-06-16days on market $286,000 Active 88 DOM
-
2026-06-15days on market $286,000 Active 87 DOM
-
2026-06-13days on market $286,000 Active 85 DOM
-
2026-06-13days on market $286,000 Active 84 DOM
-
2026-06-10days on market $286,000 Active 82 DOM
-
2026-06-09days on market $286,000 Active 81 DOM
-
2026-06-08days on market $286,000 Active 80 DOM
-
2026-06-08days on market $286,000 Active 79 DOM
-
2026-06-03days on market $286,000 Active 75 DOM
-
2026-06-02days on market $286,000 Active 74 DOM
-
2026-06-01days on market $286,000 Active 73 DOM
-
2026-05-31days on market $286,000 Active 72 DOM
-
2026-05-21price $286,000
-
2026-05-07price $291,000
-
2026-04-23price $300,000
-
2026-04-02price $310,000
-
2026-03-24soldstatus $277,000
-
2026-03-20$315,000 Active
-
2025-08-04soldstatus $2,003,000
ⓘ Source: listings_history table (triggers on properties + properties_extension) + one-shot
backfill from property_details.listing_events for pre-trigger history.
Tax reassessment forecast FL · Resets to sale price
- Current annual tax
- $3,322 · $277/mo
- Projected year-2 tax
- $3,322 · $277/mo
- Expected delta
- $0/yr ($0/mo · 0.0%)
ⓘ Screening estimate from a state-policy table — verify with the county assessor before closing.
Nearby sold comps map
Loading sold comps map…
Walkable amenities ~0.75 mi
Loading nearby amenities…
Taxation est. · year 1
- Rental income
- $36,594
- − Mortgage interest
- −$16,020
- − Property taxes
- −$3,322
- − Insurance
- −$1,430
- − Repairs & maintenance
- −$2,928
- − Management
- −$2,928
- − HOA
- −$3,288
- − Depreciation
- −$8,320
- Taxable loss
- −$1,642
- Est. tax savings @ 24.0%
- +$394
- After-tax cash flow
- $3,265/yr
For passive investors: Depreciation is non-cash, so a rental often shows a tax loss while cash-flowing — sheltering income. Rental losses are passive: they offset passive income freely, and up to $25,000/yr can offset ordinary (W-2) income if you actively participate and your MAGI is under $100k (phasing out to $0 by $150k); unused losses carry forward. On sale, claimed depreciation is recaptured at up to 25%, and gains may owe capital-gains tax (a 1031 exchange can defer both). Figures are a year-1 estimate at your 24.0% rate — not tax advice; consult a CPA.
Schools (NCES district)
- District
- Manatee
- NCES district ID
- 1201230
- Math proficiency
- 54% ▼ -6.00%
- Reading proficiency
- 50% ▼ -2.00%
- Median HH income
- $49,607
- Composite
- 44.43/100
- National rank
- #2806
- State rank
- #26 of 73 in FL
Livability — Ellenton
- Score
- 76/100
- State rank
- #232
- US rank
- #3666
Category grades
Schools grade is shown separately in the Schools card above.
Census & demographics
- County
- Manatee County · 416,364 people
- City population
- 33,319
- Metro
- North Port-Sarasota-Bradenton, FL
- Population (ZIP)
- 33,296
- Household income
- $113,773
- Rent vs Own
- Severe rent burden
- 219.0
Population outlook (Manatee County) Hauer SSP2
- Today (2025)
- 447,342 people
- By 2030
- 488,911 · +9.3%
- By 2040
- 567,934 · +27.0%
- By 2050
- 637,995 · +42.6%
- By 2075
- 781,970 · +74.8%
- By 2100
- 848,272 · +89.6%
Race, ethnicity, and origin ACS 2023
- Neighborhood character
- Predominantly White (75%)
- Race & ethnicity
- White 75% Hispanic / Latino 11% Two or more races 8% Black 8% Asian 2%
- Hispanic origin (detail)
- Mexican 2% Puerto Rican 3%
- Common ancestry
- Romanian 4% Hispanic 2% Russian 2%
- Foreign-born
- 10% · Canada, Dominican Republic, Jamaica
- Languages at home
- 88% English-only · Spanish 7% French/Haitian/Cajun 2% Other Asian/Pacific 1%
Political lean MEDSL · Manatee
- 2024 margin
- Strong R (+23.5) · D 37.9% · R 61.4%
- 2008→2024 swing
- -16.5pp toward R · 2008: -7.0pp · 2024: -23.5pp
- All cycles
- 2024: R+23.5 2020: R+16.1 2016: R+17.1 2012: R+12.5 2008: R+7.0
Not yet ingested
- Civics
- —
Market trends
- HPI YoY
- ▼ -84.45%
- Current HPI
- 271.7131
- Rent YoY
- ▼ -0.95%
- Metro
- North Port-Sarasota-Bradenton, FL
- State GDP YoY
- ▲ 3.28%
- F500 in state
- 36
Industry mix (Fortune 500 HQ in FL)
| Industry | F500 HQs | Revenue |
|---|---|---|
| Industrial Technology | 2 | $29B |
|
||
| Insurance | 2 | $17B |
|
||
| Retail | 1 | $60B |
|
||
| Technology Distribution | 1 | $58B |
|
||
| Homebuilding | 1 | $35B |
|
||
| Technology Manufacturing | 1 | $35B |
|
||
Price history
-85.7% since first listed7 events — show timeline
- 2026-05-21 Price Changed $286,000 Stellar MLS as Distributed by MLS Grid
- 2026-05-07 Price Changed $291,000 Stellar MLS as Distributed by MLS Grid
- 2026-04-23 Price Changed $300,000 Stellar MLS as Distributed by MLS Grid
- 2026-04-02 Price Changed $310,000 Stellar MLS as Distributed by MLS Grid
- 2026-03-24 Sold (Public Records) $277,000 Public Records
- 2026-03-20 Listed $315,000 Stellar MLS as Distributed by MLS Grid
- 2025-08-04 Sold (Public Records) $2,003,000 Public Records
Cash-flow waterfall
monthlySold comps — $/sqft
last 12 mo · ≤1 miLoading sold comps…