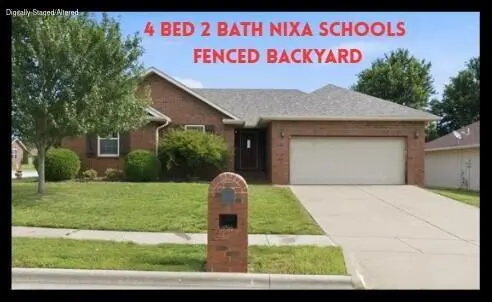
889 W Crestwood St · Nixa, MO
Flood risk 1/10 · Minimal
- FEMA flood zone
- X (unshaded)
- Chance of flooding over 30 yrs
- 0.0%
- Est. flood insurance / yr
- $473 – $860
Fire risk 4/10 · Minor
- Est. fire insurance / yr
- $1,054 – $1,958
Heat risk 5/10 · Moderate
- Hot days now (above 104°F)
- 7 days/yr
- Hot days in 30 yrs
- 19 days/yr
Wind risk 2/10 · Minimal
- Chance of severe wind over 30 yrs
- 0.0%
Air-quality risk 1/10 · Minimal
- Unhealthy air days now
- 0 days/yr
- Unhealthy air days in 30 yrs
- 0 days/yr
Risk factors via First Street. Map © Google.
Why this score? — see what drove the D grade
The composite is a weighted blend of 9 inputs, each scored 0–100. Each bar is that input's sub-score; the figure is the points it added to the 100-point composite (weight × sub-score).
- Cash flow +12.2/30.0
- ARV discount +7.5/15.0
- Schools +5.6/10.0
- Rent growth +3.9/5.0
- Livability +3.7/5.0
- DSCR +3.6/10.0
- 1% rule +2.6/10.0
- Condition / age +2.5/5.0
- Appreciation +0.0/10.0
$290,000
🖨 Deal sheet (PDF) 📄 Offer letter ✓ Due diligence
Listing remarks MLS
Hurry on over to see this fantastic new listing in Jack's Place, one of Nixa's favorite subdivisions! It's pretty darn hard to find a FOUR bedroom home, let alone one with a BRAND NEW ROOF, for under $300,000 in Nixa! Not to mention it's in the popular Mathews/Inman school district and the list of features and updates you'll appreciate here goes on and on. Situated on a privacy fenced corner lot and boasting over 1,600 square feet, you'll love the open kitchen/dining/living floorplan that features gorgeous hardwoods that run throughout (except the kitchen and baths). The living room also features a gas fireplace flanked by windows overlooking the backyard that flood the space with natural light. The C-shaped kitchen features a lot of work space with abundant cabinetry and counterspace, including a peninsula with bar seating. A new stainless steel sink and newer stainless appliances are lovely additions and the fridge STAYS! Just off the kitchen is the laundry room, which is special in its own right. Featuring a nice pantry closet and a ton of built-ins surrounding the stackable washer/dryer (which also STAY!). Across the home you'll find all four bedrooms, including the master bedroom with a large walk-in closet and en suite bathroom. Here you'll find a dual vanity, stand alone walk-in shower and a jetted tub! The back yard is manageably sized and features a very spacious deck for relaxing, entertaining or just watching the kiddos or furbabies running about. Come fall in love with your new home and be closed and settled in just in time for the new school year to begin!
Key facts
- Dual sinks
- Walk-in closet
- Gas fireplace
Tags
Property features AI
Finance
- Other: Subdivision: Jack's Place; Corner lot dimensions approximately 75 x 50.4 (0.26 acres)
Exterior
- Parking: 2-car garage; Driveway; Garage faces front
- Security: Smoke detectors
- Utilities: Public water; Public sewer
- Home design: Single-family residence; One story
- Construction: Vinyl siding; Brick/mortar foundation; Composition roof; Built with above-grade finished living area
- Exterior features: Front porch; Deck; Privacy wood fencing; Corner lot; Asphalt city street with public maintenance
Interior
- Kitchen: Dishwasher; Microwave; Refrigerator; Ice maker; Disposal; Gas water heater
- Bedrooms: Bedrooms with walk-in closet(s)
- Flooring: Hardwood floors; Tile floors
- Bathrooms: 2 full bathrooms
- Heating & cooling: Central air conditioning; Ceiling fans; Natural gas heating with forced air; Gas fireplace
- Interior features: Tray ceilings; Cathedral ceilings; Walk-in closets; Insulated double-pane windows with blinds and window coverings; Gas fireplace
- Laundry & utility: Washer and dryer included; Laundry located on main level
Neighborhood map
What this means for you Summary
Snapshot
- This is a 4-bed/2.0-bath other listed at $290k.
Deal economics
- At list price, monthly cash flow is $-57 ($-686/yr) — negative.
- To cash-flow at today's rent, offer at most $280k (3.5% below list).
- To meet the 1% rule (rent ≥ 1% of price), the offer needs to be $219k (24.3% below list).
- Recommended offer: $219k (24.3% below list) — sets the bar for 1% rule.
- Cap rate 6.1% vs local median 3.6% in Nixa — top-decile yield for the area; either an underpriced asset or a hidden risk that comps aren't pricing in. Stress-test before assuming the spread holds.
Location & tenants
- Location reads 74/100 on livability (#68 in MO, #4,558 nationally) — a middle-class / working-renter tenant base. Strengths: crime A+, cost of living A+, housing A+; Watch: amenities F, commute F, health & safety F.
- Nixa Public Schools (suburban): math 66% / reading 65% proficiency, ranked #6 of 324 in MO (top 2%) — acceptable for families but not a draw, mixed tenant base, ~2y average lease.
- Zoned schools: John Thomas School of Discover (math 70% / reading 68%, grade A-, #40 of 1,115 statewide, top 4%, 487 students, 19% FRL); Nixa Junior High (math 70% / reading 61%, grade A-, #3 of 391 statewide, top 1%, 1,067 students, 29% FRL); Nixa High (math 70% / reading 77%, grade B+, #6 of 521 statewide, top 1%, 1,957 students, 24% FRL) — zoned schools at 24% FRL track the district average.
- Market conditions: Rents rising fast (+5.7%/yr); 400 active listings in the ZIP; 8 comparable units currently listed for rent nearby; rentals at typical pace (median 16d on market — plan ~3-4 weeks tenant-placement turnaround); solid renter incomes; 537 units permitted in Christian County in 2024 (0 in 5+ unit buildings).
- This rent runs 30% of the median local income ($87k/yr) — at the standard rent-burdened threshold; future hikes will face affordability resistance.
Forward outlook
- Local home prices are declining (-3.0%/yr); year-one equity from $2k of loan paydown is wiped out by about $9k of value loss. Plan a longer hold.
- Christian County population projected at +24% by 2050 — long-run rental-demand tailwind backs the buy-and-hold thesis.
Negotiation context
- Only 8 days on market — expect competitive offers; lowballing is unlikely to land.
- 6 sale attempts since 9y ago with the ask held roughly flat each time — persistent listings suggest the price (not the market) is what's stuck; bring a comps-based counter.
Risks & watch-outs
- Climate carrying-cost: extreme-heat days projected 7→19/yr by 2055 (HVAC capex compounding) — expect insurance premiums to compound above CPI over the hold.
Questions for the listing agent
- What do current leases actually rent for vs. the listed asking? Can we see a recent rent roll and the last 12 months of T-12 income?
- Is there a deadline driving the sale (1031 exchange, divorce, estate, relocation)? That informs how much negotiation room exists.
- Schools are B-rated — typically a magnet for longer-tenancy family renters. What's the average tenant stay here, and is there a school-zone premium baked into asking?
- The area grade is low — what's the realistic commute time and amenity access for the typical tenant pool here? Any planned neighborhood developments (good or bad) we should know about?
- What's the average days-on-market for RENTAL listings here right now (not sales)? A rising rental-DOM trend means longer vacancies and softer asking-rent achievability than the comps imply.
- What's the recent tenant-quality profile in this submarket — average credit score on applications, eviction rate, late-payment / NSF rate, and stable-employment percentage? A property-management company in the area should have these aggregated.
- How much new for-sale + rental construction is in the pipeline within 1–3 miles? Heavy new supply typically softens prices + rents 12–24 months out; constrained supply supports both.
Investment metrics
- 1% rule
- 0.76% ✗
- Cap rate
- 6.06%
- Cash-on-cash
- -0.84%
- DSCR
- 0.96
- GRM
- 11.0
CMA / ARV
No comps found within radius.
Projected returns pro-forma
-3.0% appreciation · 5.67% rent growth · sell at horizon
- IRR
- -15.1%
- Equity multiple
- 0.45×
- Total profit
- $-44,679
- Equity at exit
- $43,240
- IRR
- -3.0%
- Equity multiple
- 0.78×
- Total profit
- $-17,762
- Equity at exit
- $25,074
Cash invested: $81,200 (down + closing). Projections, not guarantees.
Landlord ↔ Tenant lean methodology
- Overall (STATE)
- 81 Strongly Landlord-Friendly
- State Missouri
- 81 Strongly Landlord-Friendly · R+10
- County
- — inherits STATE
- City
- — inherits STATE
ZIP-level market 65714
- Home prices YoY
- -25.0%
- Rents YoY
- 5.7%
- Active inventory
- 400
- Price-to-rent
- 11.0×
Monthly cashflow live
- Estimated rent
- $2,194 high interval (Pro) →
- Mortgage (P&I)
- −$1,521
- Tax from tax record
- −$149 /mo · $1,784/yr
- Insurance
- −$121
- HOA
- −$0
- Vacancy / Maint / Mgmt
- −$461
- Net cashflow
- $-57
Break-even live
Sensitivity live
| Price | -10% $107 | -5% $25 | +0% $-57 | +5% $-139 | +10% $-221 |
|---|---|---|---|---|---|
| Rent | -10% $-230 | -5% $-144 | +0% $-57 | +5% $30 | +10% $116 |
| Rate | -1.0pp $89 | -0.5pp $17 | base $-57 | +0.5pp $-132 | +1.0pp $-209 |
UW: 25.0% down · 7.5% · 30yr · 1.5% tax · 5.0% vac · 8.0% maint · 8.0% mgmt
Financing live
Cash to close
- Down payment
- $72,500
- Closing costs
- $8,700
- Reserves months
- —
- Total cash needed
- —
Loan-product check · same deal, 3 products live
Conventional
25% down · 7.5% · 30yr
- Down + closing
- —
- Monthly P&I
- —
- Monthly cashflow
- —
- DSCR
- —
- Eligible?
- —
Personal DTI + credit; lowest rate.
DSCR
20% down · 8.5% · 30yr
- Down + closing
- —
- Monthly P&I
- —
- Monthly cashflow
- —
- DSCR
- —
- Eligible?
- —
No personal income docs; deal must DSCR.
Hard money
10% down · 12.0% · 12mo
- Down + closing
- —
- Monthly P&I
- —
- Monthly cashflow
- —
- DSCR
- —
- Eligible?
- —
Short-term bridge; refi at stabilization.
Rent comps 8 comps
| Address | Beds | Baths | Sqft | Rent | $/sqft | DOM | Units | Dist |
|---|---|---|---|---|---|---|---|---|
| 922 S Pindall Ln Nixa, MO | 3.0 | 2.0 | 1608 | $2,195 | $1.37 | 15d | 1 | 0.51mi |
| 926 S Pindall Ln Nixa, MO | 4.0 | 2.0 | 1861 | $2,495 | $1.34 | 15d | 1 | 0.52mi |
| 930 S Pindall Ln Nixa, MO | 3.0 | 2.0 | 1608 | $2,195 | $1.37 | 15d | 1 | 0.53mi |
| 652 W Brook Hollow Rd Nixa, MO | 3.0 | 2.0 | 1608 | $2,195 | $1.37 | 15d | 1 | 0.58mi |
| 504 W Woodbine Rd Nixa, MO | 3.0 | 2.0 | 1327 | $1,625 | $1.22 | 15d | 1 | 1.01mi |
| 320 S Market St Unit 320 Nixa, MO | 3.0 | 2.0 | 1600 | $1,625 | $1.02 | 25d | 1 | 1.39mi |
| 250 E Rosedale Rd Nixa, MO | 3.0 | 2.0 | 2250 | $2,300 | $1.02 | 15d | 1 | 1.48mi |
| 657 E Kings Carriage Blvd Nixa, MO | 3.0 | 2.0 | 1424 | $1,795 | $1.26 | 25d | 1 | 1.49mi |
Listing history 7 events
-
2026-06-22days on market $290,000 Active 8 DOM
-
2026-06-18days on market $290,000 Active 5 DOM
-
2026-06-17days on market $290,000 Active 4 DOM
-
2026-06-16days on market $290,000 Active 3 DOM
-
2026-06-15days on market $290,000 Active 2 DOM
-
2026-06-14remarks 699-char remark
-
2026-06-14$290,000 Active 1 DOM
ⓘ Source: listings_history table (triggers on properties + properties_extension) + one-shot
backfill from property_details.listing_events for pre-trigger history.
Tax reassessment forecast MO · Resets to sale price
- Current annual tax
- $1,784 · $149/mo
- Projected year-2 tax
- $2,813 · $234/mo
- Expected delta
- +$1,029/yr (+$86/mo · 57.7%)
ⓘ Screening estimate from a state-policy table — verify with the county assessor before closing.
Climate risk First Street
- Flood 1/10 Low FEMA zone X (unshaded) · 0% chance over 30 yrs
- Wildfire 4/10 Moderate
- Heat 5/10 Major 7 d/yr ≥104°F today · 19 d/yr by 30 yrs out
- Wind 2/10 Low 0% chance of damaging wind over 30 yrs
- Air quality 1/10 Low 0 unhealthy d/yr today · 0 by 30 yrs out
Nearby sold comps map
Loading sold comps map…
Walkable amenities ~0.75 mi
Loading nearby amenities…
Taxation est. · year 1
- Rental income
- $26,326
- − Mortgage interest
- −$16,245
- − Property taxes
- −$1,784
- − Insurance
- −$1,450
- − Repairs & maintenance
- −$2,106
- − Management
- −$2,106
- − Depreciation
- −$8,436
- Taxable loss
- −$5,801
- Est. tax savings @ 24.0%
- +$1,392
- After-tax cash flow
- $707/yr
For passive investors: Depreciation is non-cash, so a rental often shows a tax loss while cash-flowing — sheltering income. Rental losses are passive: they offset passive income freely, and up to $25,000/yr can offset ordinary (W-2) income if you actively participate and your MAGI is under $100k (phasing out to $0 by $150k); unused losses carry forward. On sale, claimed depreciation is recaptured at up to 25%, and gains may owe capital-gains tax (a 1031 exchange can defer both). Figures are a year-1 estimate at your 24.0% rate — not tax advice; consult a CPA.
Schools (NCES district)
- District
- Nixa Public Schools
- NCES district ID
- 2922530
- Math proficiency
- 66% ▲ 8.00%
- Reading proficiency
- 65% ▲ 4.00%
- Median HH income
- $54,073
- Composite
- 56.04/100
- National rank
- #1186
- State rank
- #6 of 324 in MO
Livability — Nixa
- Score
- 74/100
- State rank
- #68
- US rank
- #4558
Category grades
Schools grade is shown separately in the Schools card above.
Census & demographics
- Census place
- Nixa, MO
- County
- Christian County · 70,465 people
- City population
- 37,013
- Metro
- Springfield, MO
- Population (ZIP)
- 37,013
- Household income
- $86,765
- Rent vs Own
- Severe rent burden
- 769.0
Population outlook (Christian County) Hauer SSP2
- Today (2025)
- 95,071 people
- By 2030
- 100,379 · +5.6%
- By 2040
- 109,902 · +15.6%
- By 2050
- 117,487 · +23.6%
- By 2075
- 130,738 · +37.5%
- By 2100
- 131,730 · +38.6%
Race, ethnicity, and origin ACS 2023
- Neighborhood character
- Predominantly White (89%)
- Race & ethnicity
- White 89% Two or more races 4% Hispanic / Latino 4% Asian 2% Black 1%
- Common ancestry
- Italian 3% Slovak 3% Lithuanian 2%
- Foreign-born
- 4% · Canada, Vietnam
- Languages at home
- 94% English-only · Spanish 3% Russian/Polish/Slavic 2% Vietnamese 1%
Political lean MEDSL · Christian
- 2024 margin
- Solid R (+52.2) · D 23.3% · R 75.6% · Other 1.1%
- 2008→2024 swing
- -16.4pp toward R · 2008: -35.8pp · 2024: -52.2pp
- All cycles
- 2024: R+52.2 2020: R+50.8 2016: R+54.2 2012: R+46.5 2008: R+35.8
Not yet ingested
- Civics
- —
Market trends
- HPI YoY
- ▼ -71.42%
- Current HPI
- 213.8371
- Rent YoY
- ▲ 5.67%
- Metro
- Springfield, MO
- State GDP YoY
- ▲ 1.84%
- F500 in state
- 20
Industry mix (Fortune 500 HQ in MO)
| Industry | F500 HQs | Revenue |
|---|---|---|
| Healthcare | 1 | $163B |
|
||
| Insurance | 1 | $21B |
|
||
| Industrial Technology | 1 | $17B |
|
||
| Retail | 1 | $16B |
|
||
| Industrial Distribution | 1 | $10B |
|
||
| Utilities | 1 | $9B |
|
||
Price history
+81.4% since first listed16 events — show timeline
- 2026-06-13 Listed $290,000 SOMO
- 2024-08-14 Rental Removed $1,895 APPFOLIO
- 2024-07-29 Sold (Public Records) — Public Records
- 2024-07-26 Sold (MLS) — SOMO
- 2024-07-25 Listed for Rent $1,895 APPFOLIO
- 2024-06-26 Pending — SOMO
- 2024-06-25 Relisted — SOMO
- 2024-06-24 Pending — SOMO
- 2024-06-19 Listed $275,000 SOMO
- 2018-10-19 Sold (Public Records) — Public Records
- 2018-10-16 Sold (MLS) — SOMO
- 2018-08-26 Listed $174,000 SOMO
- 2017-05-30 Sold (Public Records) — Public Records
- 2017-05-26 Sold (MLS) — SOMO
- 2017-03-03 Listed $159,900 SOMO
- 2012-02-01 Sold (Public Records) — Public Records
Property tax history
+3.0%/yrLatest (2025): $1,784 · +8.0% YoY. Source: county tax records.
Cash-flow waterfall
monthlySold comps — $/sqft
last 12 mo · ≤1 miLoading sold comps…