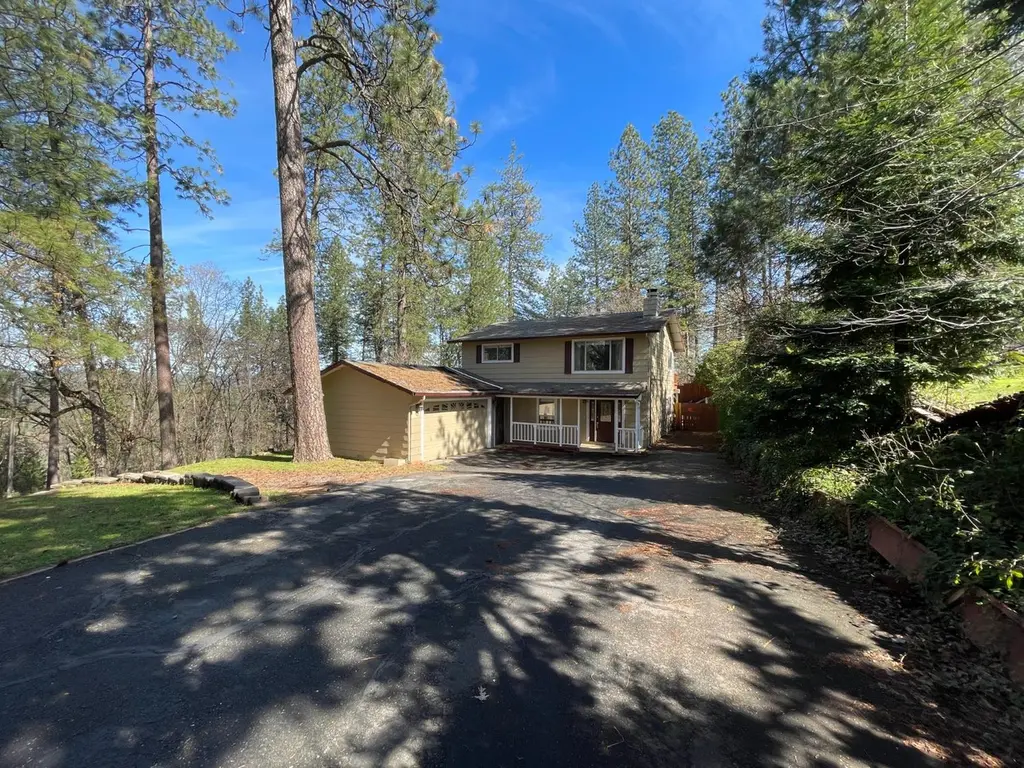
2760 Sunrise Dr · Meadow Vista, CA
Flood risk 1/10 · Minimal
- FEMA flood zone
- X (unshaded)
- Chance of flooding over 30 yrs
- 0.0%
- Est. flood insurance / yr
- $507 – $1,088
Fire risk 8/10 · Major
- Est. fire insurance / yr
- $659 – $1,223
Heat risk 5/10 · Moderate
- Hot days now (above 98°F)
- 7 days/yr
- Hot days in 30 yrs
- 15 days/yr
Wind risk 1/10 · Minimal
- Chance of severe wind over 30 yrs
- —
Air-quality risk 10/10 · Severe
- Unhealthy air days now
- 36 days/yr
- Unhealthy air days in 30 yrs
- 41 days/yr
Risk factors via First Street. Map © Google.
Why this score? — see what drove the C+ grade
The composite is a weighted blend of 9 inputs, each scored 0–100. Each bar is that input's sub-score; the figure is the points it added to the 100-point composite (weight × sub-score).
- Cash flow +21.4/30.0
- ARV discount +15.0/15.0
- DSCR +6.8/10.0
- 1% rule +5.2/10.0
- Schools +4.9/10.0
- Livability +3.0/5.0
- Rent growth +2.5/5.0
- Condition / age +2.5/5.0
- Appreciation +0.0/10.0
$482,500
🖨 Deal sheet 📄 Offer letter ✓ Due diligence
Listing remarks
Welcome to 2760 Sunrise Dr in the peaceful foothill community of Meadow Vista. This spacious 3-bedroom, 2-bath home offers approximately 1,980 square feet of living space on a generously sized lot, providing plenty of room to relax and enjoy the surrounding natural setting. The property features a built-in swimming poolperfect for entertaining, cooling off during warm summer days, or simply enjoying the quiet outdoor space. Inside, the home offers a comfortable layout with ample living space and great potential for personalization. The expansive lot provides opportunities for gardening, recreation, or additional outdoor improvements. Conveniently located just minutes from Interstate 80, thi
Key facts
- Generously sized lot
- 0.91 acre lot
- 2 garage spots
Tags
Property features AI
Finance
- Other: Private built-in pool on lot (fenced, pool cover); No private spa; Lot shape regular with dimensions 206 x 195 x 206 x 194; Lot approximately 0.91 acre
- HOA & community: No homeowners association
Exterior
- Parking: Attached and detached garage (garage faces side); 2 garage spaces; Paved driveway
- Utilities: 220-volt electric service; Public water; Septic system; Irrigation: other
- Home design: Single-family detached residence; Two stories; Entry from street level; Composition roof
- Construction: Built in 1978; Composition roof
- Exterior features: Balcony; Garden; Storage structure on property
Interior
- Kitchen: Built-in electric oven; Electric cooktop; Dishwasher; Microwave; Hood over range; Compactor; Tile countertops
- Bedrooms: 3 bedrooms (main and upper levels indicated; master on upper level)
- Flooring: Concrete; Tile; Wood
- Bathrooms: 2 full bathrooms; Master bath with shower stall and window; Other baths with tub/shower over and windows
- Heating & cooling: Central heating; Wood stove; Central air conditioning; Ceiling fans
- Interior features: Two-story layout; Front porch; Uncovered deck; Uncovered patio; Living room fireplace; Family room fireplace
- Laundry & utility: Laundry closet with hookups inside; Inside laundry room/area
Neighborhood map
What this means for you Summary
Snapshot
- This is a 4-bed/2.0-bath single-family listed at $482k.
Deal economics
- At list price, monthly cash flow is $718 ($9k/yr) — positive.
- The deal already cash-flows at list — no discount required.
- Meets the 1% rule at list price ($5k rent vs $482k).
- Recommended offer: $454k (6.0% below list) — sets the bar for market timing.
- Cap rate 8.1% vs local median 1.8% in Meadow Vista — top-decile yield for the area; either an underpriced asset or a hidden risk that comps aren't pricing in. Stress-test before assuming the spread holds.
Location & tenants
- Location reads 60/100 on livability (#609 in CA) — a middle-class / working-renter tenant base. Strengths: employment A+, crime A, schools B; Watch: amenities F, commute F, cost of living F.
- Placer Union High (suburban): math 39% / reading 72% proficiency, ranked #98 of 517 in CA (top 19%) — acceptable for families but not a draw, mixed tenant base, ~2y average lease.
- Market conditions: 69 active listings in the ZIP; 1 comparable units currently listed for rent nearby; 3,535 units permitted in Placer County in 2024 (689 in 5+ unit buildings).
Forward outlook
- Local home prices are declining (-3.0%/yr); year-one equity from $3k of loan paydown is wiped out by about $14k of value loss. Plan a longer hold.
- Placer County population projected at +20% by 2050 — long-run rental-demand tailwind backs the buy-and-hold thesis.
Negotiation context
- It's been on market 86 days — a 6% lower offer ($454k) is reasonable based on typical stale-listing flexibility.
Risks & watch-outs
- Climate carrying-cost: severe wildfire risk; extreme-heat days projected 7→15/yr by 2055 (HVAC capex compounding) — expect insurance premiums to compound above CPI over the hold.
Questions for the listing agent
- It's been on market 86 days. Have you received any prior offers? Is the seller open to a 6% concession, seller financing, or rate buy-down credit?
- Built in 1978 — when were the roof, HVAC, electrical panel, plumbing, and water heater last replaced?
- Why hasn't it sold? Are there any deal-killer items the seller is aware of (foundation, flood, title, zoning, code violations)?
- Is there a deadline driving the sale (1031 exchange, divorce, estate, relocation)? That informs how much negotiation room exists.
- Schools are B-rated — typically a magnet for longer-tenancy family renters. What's the average tenant stay here, and is there a school-zone premium baked into asking?
- What's the average days-on-market for RENTAL listings here right now (not sales)? A rising rental-DOM trend means longer vacancies and softer asking-rent achievability than the comps imply.
- What's the recent tenant-quality profile in this submarket — average credit score on applications, eviction rate, late-payment / NSF rate, and stable-employment percentage? A property-management company in the area should have these aggregated.
- How much new for-sale + rental construction is in the pipeline within 1–3 miles? Heavy new supply typically softens prices + rents 12–24 months out; constrained supply supports both.
Investment metrics
- 1% rule
- 1.02% ✓
- Cap rate
- 8.08%
- Cash-on-cash
- 6.38%
- DSCR
- 1.28
- GRM
- 8.2
CMA / ARV
- ARV (on-the-fly)
- $667,260
- Comps found
- 7
Show comp detail 7 sales within ~0.75 mi
| Address | Dist | Beds/Ba | Sqft | Sold | Price | $/sf | Match |
|---|---|---|---|---|---|---|---|
| 3221 Tenderfoot Ln | 0.61mi | 3/2.0 (-1) | 2,092 (+6%) | 1mo | $692,500 | $331 | 56 |
| 2652 Volley Ln | 0.42mi | 4/3.0 | 2,194 (+11%) | 3mo | $740,000 | $337 | 56 |
| 1989 Van Giesen Dr | 0.56mi | 4/2.0 | 1,781 (-10%) | 3mo | $645,000 | $362 | 54 |
| 3190 Meadow Vista Rd | 0.57mi | 3/2.5 (-1) | 1,920 (-3%) | 20mo | $585,000 | $305 | 45 |
| 2690 Volley Rd | 0.34mi | 3/2.0 (-1) | 1,728 (-13%) | 18mo | $624,500 | $361 | 43 |
| 2682 Volley Ln | 0.46mi | 3/2.0 (-1) | 1,826 (-8%) | 24mo | $468,000 | $256 | 41 |
| 2415 Los Robles Rd | 0.57mi | 4/2.5 | 2,141 (+8%) | 23mo | $766,500 | $358 | 39 |
Match score weights: distance 35% · size 25% · config 20% · recency 20%. Top-matched comps best support the ARV.
Projected returns pro-forma
-3.0% appreciation · 3.0% rent growth · sell at horizon
- IRR
- -6.5%
- Equity multiple
- 0.76×
- Total profit
- $-32,501
- Equity at exit
- $71,942
- IRR
- 3.1%
- Equity multiple
- 1.23×
- Total profit
- $30,422
- Equity at exit
- $41,718
Cash invested: $135,100 (down + closing). Projections, not guarantees.
Landlord ↔ Tenant lean methodology
- Overall (STATE)
- 18 Strongly Tenant-Friendly
- State California
- 18 Strongly Tenant-Friendly · D+13
- County
- — inherits STATE
- City
- — inherits STATE
ZIP-level market 95722
- Active inventory
- 69
- Price-to-rent
- 8.2×
Monthly cashflow live
- Estimated rent
- $4,900 medium interval (Pro) →
- Mortgage (P&I)
- −$2,530
- Tax from tax record
- −$422 /mo · $5,061/yr
- Insurance
- −$201
- HOA
- −$0
- Vacancy / Maint / Mgmt
- −$1,029
- Net cashflow
- $718
Break-even live
UW: 25.0% down · 7.5% · 30yr · 1.5% tax · 5.0% vac · 8.0% maint · 8.0% mgmt
Financing live
Cash to close
- Down payment
- $120,625
- Closing costs
- $14,475
- Reserves months
- —
- Total cash needed
- —
Loan-product check · same deal, 3 products live
Conventional
25% down · 7.5% · 30yr
- Down + closing
- —
- Monthly P&I
- —
- Monthly cashflow
- —
- DSCR
- —
- Eligible?
- —
Personal DTI + credit; lowest rate.
DSCR
20% down · 8.5% · 30yr
- Down + closing
- —
- Monthly P&I
- —
- Monthly cashflow
- —
- DSCR
- —
- Eligible?
- —
No personal income docs; deal must DSCR.
Hard money
10% down · 12.0% · 12mo
- Down + closing
- —
- Monthly P&I
- —
- Monthly cashflow
- —
- DSCR
- —
- Eligible?
- —
Short-term bridge; refi at stabilization.
Rent comps 1 comps
| Address | Beds | Baths | Sqft | Rent | $/sqft | DOM | Units | Dist |
|---|---|---|---|---|---|---|---|---|
| 2645 N Lakewood Dr Meadow Vista, CA | 4.0 | 3.0 | 2400 | $4,900 | $2.04 | 3d | 1 | 0.74mi |
Listing history 16 events
-
2026-06-15status $482,500 Pending 86 DOM
-
2026-06-15days on market $482,500 Active 86 DOM
-
2026-06-13days on market $482,500 Active 84 DOM
-
2026-06-13days on market $482,500 Active 83 DOM
-
2026-06-09days on market $482,500 Active 80 DOM
-
2026-06-08days on market $482,500 Active 79 DOM
-
2026-06-07pricedays on market $482,500 Active 78 DOM
-
2026-06-03days on market $507,000 Active 74 DOM
-
2026-06-02days on market $507,000 Active 73 DOM
-
2026-06-01days on market $507,000 Active 72 DOM
-
2026-05-31days on market $507,000 Active 71 DOM
-
2022-06-03soldstatus $650,000
-
2006-08-15soldstatus $550,000
-
2003-08-29soldstatus $412,000
-
1998-08-03soldstatus $225,000
-
1978-12-07soldstatus $75,000
ⓘ Source: listings_history table (triggers on properties + properties_extension) + one-shot
backfill from property_details.listing_events for pre-trigger history.
Tax reassessment forecast CA · Resets to sale price
- Current annual tax
- $5,061 · $422/mo
- Projected year-2 tax
- $5,061 · $422/mo
- Expected delta
- $0/yr ($0/mo · 0.0%)
ⓘ Screening estimate from a state-policy table — verify with the county assessor before closing.
Climate risk First Street
- Flood 1/10 Low FEMA zone X (unshaded) · 0% chance over 30 yrs
- Wildfire 8/10 Severe
- Heat 5/10 Major 7 d/yr ≥98°F today · 15 d/yr by 30 yrs out
- Wind 1/10 Low
- Air quality 10/10 Extreme 36 unhealthy d/yr today · 41 by 30 yrs out
Nearby sold comps map
Loading sold comps map…
Walkable amenities ~0.75 mi
Loading nearby amenities…
Taxation est. · year 1
- Rental income
- $58,800
- − Mortgage interest
- −$27,028
- − Property taxes
- −$5,061
- − Insurance
- −$2,412
- − Repairs & maintenance
- −$4,704
- − Management
- −$4,704
- − Depreciation
- −$14,036
- Taxable income
- $854
- Est. tax owed @ 24.0%
- −$205
- After-tax cash flow
- $8,410/yr
For passive investors: Depreciation is non-cash, so a rental often shows a tax loss while cash-flowing — sheltering income. Rental losses are passive: they offset passive income freely, and up to $25,000/yr can offset ordinary (W-2) income if you actively participate and your MAGI is under $100k (phasing out to $0 by $150k); unused losses carry forward. On sale, claimed depreciation is recaptured at up to 25%, and gains may owe capital-gains tax (a 1031 exchange can defer both). Figures are a year-1 estimate at your 24.0% rate — not tax advice; consult a CPA.
Schools (NCES district)
- District
- Placer Union High
- NCES district ID
- 0630750
- Math proficiency
- 39% ▲ 1.00%
- Reading proficiency
- 72% ▲ 3.00%
- Median HH income
- $69,119
- Composite
- 49.04/100
- National rank
- #2060
- State rank
- #98 of 517 in CA
Livability — Meadow Vista
- Score
- 60/100
- State rank
- #609
- US rank
- #19437
Category grades
Schools grade is shown separately in the Schools card above.
Census & demographics
- Census place
- Meadow Vista, CA
- City population
- 4,439
- Population (ZIP)
- 4,439
Population outlook (Placer County) Hauer SSP2
- Today (2025)
- 422,709 people
- By 2030
- 444,249 · +5.1%
- By 2040
- 480,192 · +13.6%
- By 2050
- 506,390 · +19.8%
- By 2075
- 550,219 · +30.2%
- By 2100
- 547,760 · +29.6%
Race, ethnicity, and origin ACS 2023
- Neighborhood character
- Predominantly White (83%)
- Race & ethnicity
- White 83% Two or more races 10% Hispanic / Latino 10% Asian 2% Pacific Islander 1%
- Hispanic origin (detail)
- Mexican 3% Cuban 5%
- Common ancestry
- Slovak 4% Italian 4% Russian 3%
- Foreign-born
- 6% · Canada
- Languages at home
- 92% English-only · Spanish 3% Korean 1% Russian/Polish/Slavic 1%
Political lean MEDSL · Placer
- 2024 margin
- Lean R (+8.5) · D 44.3% · R 52.8% · Other 2.9%
- 2008→2024 swing
- +2.8pp toward D · 2008: -11.3pp · 2024: -8.5pp
- All cycles
- 2024: R+8.5 2020: R+6.7 2016: R+11.3 2012: R+20.1 2008: R+11.3
Not yet ingested
- Civics
- —
Market trends
- HPI YoY
- ▼ -333.45%
- Current HPI
- 242.048
- Rent YoY
- —
- Metro
- —
- State GDP YoY
- ▲ 3.21%
- F500 in state
- 116
Industry mix (Fortune 500 HQ in CA)
| Industry | F500 HQs | Revenue |
|---|---|---|
| Technology | 27 | $1,492B |
|
||
| Financial Services | 3 | $174B |
|
||
| Retail | 3 | $44B |
|
||
| Insurance | 3 | $26B |
|
||
| Media / Entertainment | 2 | $115B |
|
||
| Pharmaceuticals / Biotech | 2 | $62B |
|
||
Price history
+766.7% since first listed5 events — show timeline
- 2022-06-03 Sold (Public Records) $650,000 Public Records
- 2006-08-15 Sold (Public Records) $550,000 Public Records
- 2003-08-29 Sold (Public Records) $412,000 Public Records
- 1998-08-03 Sold (Public Records) $225,000 Public Records
- 1978-12-07 Sold (Public Records) $75,000 Public Records
Property tax history
+0.4%/yrLatest (2025): $5,061 · +3.4% YoY. Source: county tax records.
Cash-flow waterfall
monthlySold comps — $/sqft
last 12 mo · ≤1 miLoading sold comps…