 Duplex
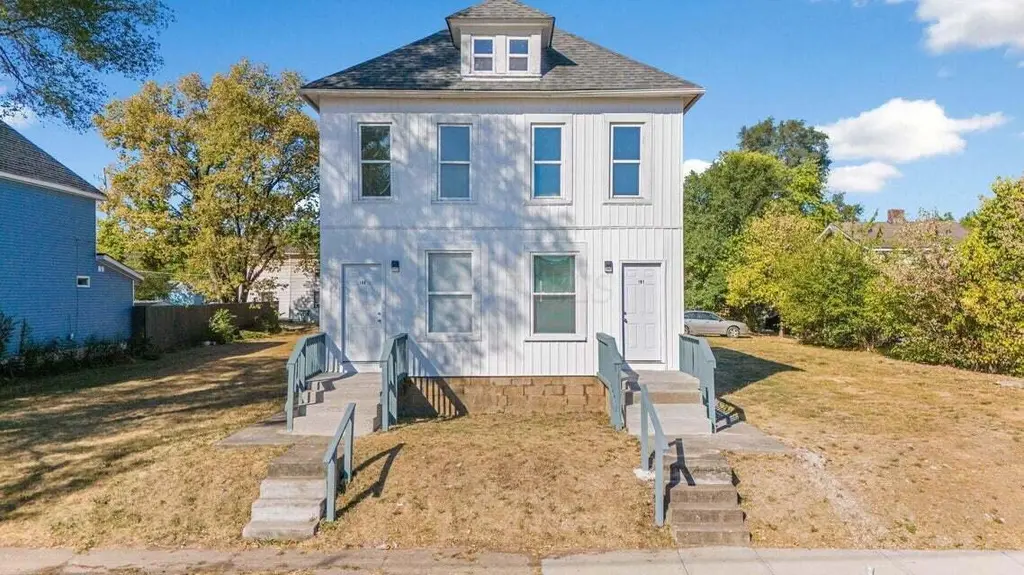
189-191 N Central Ave · Columbus, OH
Flood risk 1/10 · Minimal
- FEMA flood zone
- X
- Chance of flooding over 30 yrs
- 0.0%
- Est. flood insurance / yr
- $473 – $860
Fire risk 1/10 · Minimal
- Est. fire insurance / yr
- $713 – $1,323
Heat risk 4/10 · Minor
- Hot days now (above 100°F)
- 7 days/yr
- Hot days in 30 yrs
- 18 days/yr
Wind risk 2/10 · Minimal
- Chance of severe wind over 30 yrs
- 1.0%
Air-quality risk 3/10 · Minor
- Unhealthy air days now
- 2 days/yr
- Unhealthy air days in 30 yrs
- 4 days/yr
Risk factors via First Street. Map © Google.
Why this score? — see what drove the C- grade
The composite is a weighted blend of 9 inputs, each scored 0–100. Each bar is that input's sub-score; the figure is the points it added to the 100-point composite (weight × sub-score).
- Cash flow +20.4/30.0
- Appreciation +10.0/10.0
- DSCR +6.5/10.0
- 1% rule +4.5/10.0
- Livability +4.0/5.0
- Rent growth +2.5/5.0
- Condition / age +2.5/5.0
- Schools +1.7/10.0
- ARV discount +0.0/15.0
$289,900
🖨 Deal sheet 📄 Offer letter ✓ Due diligence
Multi-family units
County records classify this as Multi-Family (2-4 Unit). Listing-text estimate: 2 units. confirmed
Listing remarks MLS
This updated Franklinton duplex delivers comfortable modern living in a neighborhood known for its growth and character. Fully renovated in 2024, the layout offers practical flow and inviting spaces that work well for tenants or an owner occupant. Bedrooms are nicely sized, and the overall footprint feels bright and functional. With strong rental history and a location close to downtown conveniences, this duplex makes a compelling addition to any portfolio. Both units are occupied, please do not disturb tenants. Curb offers only.
Key facts
- 4,356 sq ft lot
- Built 1900
- Listed 57 days
Neighborhood map
What this means for you Summary
Snapshot
- This is a 2 × 2-bed/?-bath units multifamily listed at $290k.
Deal economics
- At list price, monthly cash flow is $375 ($5k/yr) — positive. Per door: $188/mo.
- The deal already cash-flows at list — no discount required.
- To meet the 1% rule (rent ≥ 1% of price), the offer needs to be $276k (4.6% below list).
- Recommended offer: $276k (4.6% below list) — sets the bar for 1% rule.
- Cap rate 7.8% vs local median 3.8% in Columbus — top-decile yield for the area; either an underpriced asset or a hidden risk that comps aren't pricing in. Stress-test before assuming the spread holds.
Location & tenants
- Location reads 81/100 on livability (#97 in OH, #1,491 nationally) — a professional / high-income tenant draw. Strengths: commute A+, cost of living A+, housing A+; Watch: employment C-, crime F.
- Columbus City School District (urban): math 15% / reading 26% proficiency, ranked #626 of 656 in OH (top 95%) — low school quality limits family demand, transient renter base, plan for 1-2y turnover; 72% free/reduced lunch — lower-income household profile, screen leases tightly.
- Market conditions: 50 active listings in the ZIP; 39 comparable units currently listed for rent nearby; rentals at typical pace (median 20d on market — plan ~3-4 weeks tenant-placement turnaround); lower-income renter base — watch delinquency; 8,139 units permitted in Franklin County in 2024 (5,940 in 5+ unit buildings).
- At $2,765/mo this rent would consume 103% of the median local household income ($32k/yr) (locally 126% of renters already pay >50% of income on rent) — very limited rent-growth headroom before tenants either downsize or default.
Forward outlook
- In year one you build about $31k of equity ($2k loan paydown + $29k appreciation (10.0% local appreciation)).
- Franklin County population projected at +34% by 2050 — long-run rental-demand tailwind backs the buy-and-hold thesis.
- At projected returns (10.0% appreciation + 3.0% rent growth), your $81k cash investment doubles in ~3 years — after that, you're playing with house money.
- By year 2, paydown + projected appreciation supports a ~$50k cash-out refi (75% LTV) — recoverable capital for the next deal without selling this one.
Negotiation context
- It's been on market 57 days — a 3% lower offer ($281k) is reasonable based on typical stale-listing flexibility.
- 4 sale attempts since 13y ago with the ask held roughly flat each time — persistent listings suggest the price (not the market) is what's stuck; bring a comps-based counter.
- Current owner paid $70k; list at $290k implies a 314% gain — meaningful room to come down on a strong offer.
Risks & watch-outs
- Watch-outs: built in 1900 — expect roof / HVAC / electrical / plumbing capex.
Questions for the listing agent
- It's been on market 57 days. Have you received any prior offers? Is the seller open to a 5% concession, seller financing, or rate buy-down credit?
- Can we see the unit-by-unit rent roll, current vacancy, and any below-market leases? What's the average tenancy length?
- What capital expenditures (roof, boiler, parking lot, exteriors) have been made in the last 5 years, and what's planned in the next 2?
- Built in 1900 — when were the roof, HVAC, electrical panel, plumbing, and water heater last replaced?
- Is there a deadline driving the sale (1031 exchange, divorce, estate, relocation)? That informs how much negotiation room exists.
- Crime grade is F in this area — have there been break-ins, vandalism, or insurance claims at this property in the last 3 years? What carrier currently insures it and at what premium?
- What's the average days-on-market for RENTAL listings here right now (not sales)? A rising rental-DOM trend means longer vacancies and softer asking-rent achievability than the comps imply.
- What's the recent tenant-quality profile in this submarket — average credit score on applications, eviction rate, late-payment / NSF rate, and stable-employment percentage? A property-management company in the area should have these aggregated.
- How much new apartment / multifamily construction is in the pipeline within 1–3 miles? Heavy new supply (>2% of stock underway) typically softens rents 12–24 months out; light construction supports rent growth.
Investment metrics
- 1% rule
- 0.95% ✗
- Cap rate
- 7.85%
- Cash-on-cash
- 5.55%
- DSCR
- 1.25
- GRM
- 8.7
CMA / ARV
- ARV (median comp)
- $231,493
- List price
- $289,900
- Delta
- 25.23%
- Verdict
- OVERPRICED
- Comps
- 20 within 1.0 mi
Show comp detail 3 sales within ~0.75 mi
| Address | Dist | Beds/Ba | Sqft | Sold | Price | $/sf | Match |
|---|---|---|---|---|---|---|---|
| 1340-1342 W State St | 0.42mi | 4/— | 1,488 (-4%) | 8mo | $235,000 | $158 | 67 |
| 40 Wisconsin Ave | 0.37mi | 3/— (-1) | 1,592 (+3%) | 12mo | $110,000 | $69 | 64 |
| 266-288 S Yale Ave | 0.75mi | 4/— | 1,560 (+0%) | 20mo | $270,000 | $173 | 48 |
Match score weights: distance 35% · size 25% · config 20% · recency 20%. Top-matched comps best support the ARV.
Projected returns pro-forma
10.0% appreciation · 3.0% rent growth · sell at horizon
- IRR
- 28.3%
- Equity multiple
- 3.24×
- Total profit
- $181,717
- Equity at exit
- $261,165
- IRR
- 24.6%
- Equity multiple
- 7.36×
- Total profit
- $516,171
- Equity at exit
- $563,212
Cash invested: $81,172 (down + closing). Projections, not guarantees.
Landlord ↔ Tenant lean methodology
- Overall (STATE)
- 73 Landlord-Friendly
- State Ohio
- 73 Landlord-Friendly · R+6
- County
- — inherits STATE
- City
- — inherits STATE
ZIP-level market 43222
- Active inventory
- 50
- Price-to-rent
- 17.5×
Monthly cashflow live
- Estimated rent
- $2,765 high interval (Pro) →
- Mortgage (P&I)
- −$1,520
- Tax from tax record
- −$168 /mo · $2,015/yr
- Insurance
- −$121
- HOA
- −$0
- Vacancy / Maint / Mgmt
- −$581
- Net cashflow
- $375
Break-even live
2-unit breakdown (identical units grouped — click to expand)
| Units | Beds | Baths | Est. rent |
|---|---|---|---|
| 2× units | 2 | — | $2,764 |
| #1 | 2 | — | $1,382 |
| #2 | 2 | — | $1,382 |
| Total (2 units) | $2,765 | ||
UW: 25.0% down · 7.5% · 30yr · 1.5% tax · 5.0% vac · 8.0% maint · 8.0% mgmt
Financing live
Cash to close
- Down payment
- $72,475
- Closing costs
- $8,697
- Reserves months
- —
- Total cash needed
- —
Loan-product check · same deal, 3 products live
Conventional
25% down · 7.5% · 30yr
- Down + closing
- —
- Monthly P&I
- —
- Monthly cashflow
- —
- DSCR
- —
- Eligible?
- —
Personal DTI + credit; lowest rate.
DSCR
20% down · 8.5% · 30yr
- Down + closing
- —
- Monthly P&I
- —
- Monthly cashflow
- —
- DSCR
- —
- Eligible?
- —
No personal income docs; deal must DSCR.
Hard money
10% down · 12.0% · 12mo
- Down + closing
- —
- Monthly P&I
- —
- Monthly cashflow
- —
- DSCR
- —
- Eligible?
- —
Short-term bridge; refi at stabilization.
Rent comps 39 comps
| Address | Beds | Baths | Sqft | Rent | $/sqft | DOM | Units | Dist |
|---|---|---|---|---|---|---|---|---|
| 137 N Guilford Ave Columbus, OH | 4.0 | 2.0 | 1456 | $1,850 | $1.27 | 44d | 1 | 0.14mi |
| 228 Schultz Ave Unit 1407033P Columbus, OH | 5.0 | 1.5 | 1991 | $5,806 | $2.92 | 8d | 1 | 0.21mi |
| 228 Schultz Ave Unit 1407024P Columbus, OH | 4.0 | 1.5 | 1991 | $6,208 | $3.12 | 15d | 1 | 0.21mi |
| 51 N Princeton Ave Columbus, OH | 3.0 | 1.0 | 1188 | $1,175 | $0.99 | 24d | 1 | 0.26mi |
| 58 Stevens Ave Columbus, OH | 3.0 | 1.0 | 1176 | $1,250 | $1.06 | 44d | 1 | 0.26mi |
| 162 Wisconsin Ave Columbus, OH | 4.0 | 2.5 | 1930 | $1,900 | $0.98 | 44d | 1 | 0.30mi |
| 32 Schultz Ave Columbus, OH | 3.0 | 1.0 | 1218 | $1,250 | $1.03 | 21d | 1 | 0.33mi |
| 85 N Yale Ave Columbus, OH | 3.0 | 1.0 | 1215 | $1,100 | $0.91 | 8d | 1 | 0.37mi |
| 85 N Yale Ave Columbus, OH | 3.0 | 1.0 | 1215 | $1,100 | $0.91 | 20d | 1 | 0.37mi |
| 120 S Central Ave Columbus, OH | 1.0–3.0 | 1.0–2.0 | 944 | $1,295 | $1.37 | 15d | 12 | 0.47mi |
| 76 Rodgers Ave Columbus, OH | 3.0 | 1.5 | 1422 | $1,695 | $1.19 | 24d | 1 | 0.61mi |
| 189 W Park Ave Unit 189 Columbus, OH | 3.0 | 2.0 | 1276 | $1,395 | $1.09 | 8d | 1 | 0.61mi |
| 153 S Cypress Ave Columbus, OH | 3.0 | 1.0 | 1472 | $1,650 | $1.12 | 8d | 1 | 0.69mi |
| 135-137 Dakota Ave Unit 135 Columbus, OH | 3.0 | 1.5 | 2200 | $1,800 | $0.82 | 44d | 1 | 0.71mi |
| 158 Dakota Ave Columbus, OH | 4.0 | 2.0 | 1800 | $2,045 | $1.14 | 8d | 1 | 0.76mi |
| 125 Avondale Ave Columbus, OH | 3.0 | 1.5 | 1344 | $1,695 | $1.26 | 44d | 1 | 0.76mi |
| 1314 City View Dr Columbus, OH | 1.0–3.0 | 1.0–2.0 | 961 | $3,539 | $3.68 | 2d | 51 | 0.77mi |
| 60 Martin Ave Columbus, OH | 3.0 | 2.0 | 1807 | $1,650 | $0.91 | 24d | 1 | 0.82mi |
| 394 S Guilford Ave Columbus, OH | 3.0 | 1.5 | 1404 | $1,450 | $1.03 | 8d | 1 | 0.86mi |
| 432 Catherine St Columbus, OH | 3.0 | 1.0 | 1073 | $1,325 | $1.23 | 12d | 1 | 0.97mi |
| 432 Catherine St Columbus, OH | 3.0 | 1.0 | 1073 | $1,325 | $1.23 | 15d | 1 | 0.97mi |
| 378 Hawkes Ave Columbus, OH | 3.0 | 2.0 | 1200 | $1,649 | $1.37 | 24d | 1 | 1.07mi |
| 908 Thomas Rd Unit 908 Grandview Heights, OH | 3.0 | 1.0 | 1100 | $1,750 | $1.59 | 17d | 1 | 1.10mi |
| 95-97 Whitethorne Ave Columbus, OH | 3.0 | 1.5 | 1260 | $1,475 | $1.17 | 20d | 1 | 1.11mi |
| 95-97 Whitethorne Ave Columbus, OH | 3.0 | 1.5 | 1260 | $1,375 | $1.09 | 3d | 1 | 1.11mi |
| 488 Woodbury Ave Columbus, OH | 3.0 | 1.5 | 1222 | $1,250 | $1.02 | 44d | 1 | 1.17mi |
| 1964 Sullivant Ave Columbus, OH | 4.0 | 2.0 | 1580 | $1,650 | $1.04 | 24d | 1 | 1.17mi |
| 543 Woodbury Ave Unit NA Columbus, OH | 3.0 | 1.0 | 1308 | $1,645 | $1.26 | 15d | 1 | 1.25mi |
| 644 Chlois Ln Columbus, OH | 1.0–3.0 | 1.0–2.0 | 985 | $3,085 | $3.13 | 2d | 15 | 1.31mi |
| 257 S Skidmore St Columbus, OH | 3.0 | 2.0 | 1224 | $1,895 | $1.55 | 44d | 1 | 1.32mi |
| 501 W Broad St Columbus, OH | 3.0 | 1.0–2.5 | 1166 | $3,599 | $3.09 | 44d | 15 | 1.33mi |
| 501 W Broad St Columbus, OH | 3.0 | 1.0–2.5 | 1166 | $3,649 | $3.13 | 2d | 52 | 1.33mi |
| 285 S Gift St Columbus, OH | 3.0 | 2.0 | 1641 | $1,700 | $1.04 | 16d | 1 | 1.38mi |
| 285 S Gift St Columbus, OH | 3.0 | 2.0 | 1641 | $1,700 | $1.04 | 24d | 1 | 1.38mi |
| 41 S Oakley Ave Columbus, OH | 3.0 | 1.5 | 1428 | $1,550 | $1.09 | 44d | 1 | 1.39mi |
| 133 N Eureka Ave Columbus, OH | 3.0 | 1.0 | 1484 | $1,350 | $0.91 | 12d | 1 | 1.45mi |
| 2205 Sullivant Ave Columbus, OH | 3.0 | 1.0 | 1275 | $1,200 | $0.94 | 44d | 1 | 1.48mi |
| 713 Canonby Pl Unit B Columbus, OH | 3.0 | 1.5 | 1200 | $1,095 | $0.91 | 3d | 1 | 1.49mi |
| 713 Canonby Pl Apt E Columbus, OH | 3.0 | 1.5 | 1200 | $1,095 | $0.91 | 44d | 1 | 1.49mi |
Listing history 39 events
-
2026-06-18days on market $289,900 Active 57 DOM
-
2026-06-17days on market $289,900 Active 56 DOM
-
2026-06-16days on market $289,900 Active 55 DOM
-
2026-06-15days on market $289,900 Active 54 DOM
-
2026-06-13days on market $289,900 Active 52 DOM
-
2026-06-13days on market $289,900 Active 51 DOM
-
2026-06-09days on market $289,900 Active 48 DOM
-
2026-06-08days on market $289,900 Active 47 DOM
-
2026-06-07days on market $289,900 Active 46 DOM
-
2026-06-05days on market $289,900 Active 43 DOM
-
2026-06-03days on market $289,900 Active 42 DOM
-
2026-06-02days on market $289,900 Active 41 DOM
-
2026-06-01days on market $289,900 Active 40 DOM
-
2026-05-31days on market $289,900 Active 39 DOM
-
2026-04-22$289,900 Active 535-char remark
Show marketing remark (535 chars)
This updated Franklinton duplex delivers comfortable modern living in a neighborhood known for its growth and character. Fully renovated in 2024, the layout offers practical flow and inviting spaces that work well for tenants or an owner occupant. Bedrooms are nicely sized, and the overall footprint feels bright and functional. With strong rental history and a location close to downtown conveniences, this duplex makes a compelling addition to any portfolio. Both units are occupied, please do not disturb tenants. Curb offers only.
-
2018-09-18soldstatus $70,000
-
2018-09-07soldstatus $70,000 Closed 336-char remark
Show marketing remark (336 chars)
Franklinton!! Great double located just off McKinley and Central. Units have been freshly painted, updated kitchen, come with stove, dishwasher, and refrigerator. Each unit has 2 beds, 1 bath and a full basement. Newer roof and windows, both have new electrical panels and hot water tanks. Plenty of off street parking behind the units.
-
2018-08-06historical Contingent Finance and Inspection 336-char remark
Show marketing remark (336 chars)
Franklinton!! Great double located just off McKinley and Central. Units have been freshly painted, updated kitchen, come with stove, dishwasher, and refrigerator. Each unit has 2 beds, 1 bath and a full basement. Newer roof and windows, both have new electrical panels and hot water tanks. Plenty of off street parking behind the units.
-
2018-08-04$74,900 Active 336-char remark
Show marketing remark (336 chars)
Franklinton!! Great double located just off McKinley and Central. Units have been freshly painted, updated kitchen, come with stove, dishwasher, and refrigerator. Each unit has 2 beds, 1 bath and a full basement. Newer roof and windows, both have new electrical panels and hot water tanks. Plenty of off street parking behind the units.
-
2017-03-19soldstatus $24,000 Closed
-
2017-03-06soldstatus $24,000
-
2017-02-11status Pending
-
2017-02-02price $27,500
-
2016-10-26price $29,000
-
2016-06-03price $35,500
-
2016-05-06price $37,500
-
2016-01-26price $39,500
-
2015-12-28price $44,500
-
2015-10-28$49,000 Active
-
2014-03-04soldstatus $39,700
-
2014-01-02soldstatus $12,000
-
2013-12-26soldstatus $12,000
-
2013-12-05historical
-
2013-09-27$19,900
-
2003-12-10soldstatus $65,000
-
2000-04-04soldstatus $24,000
-
1998-10-13soldstatus $64,000
-
1998-09-16soldstatus $167,500
-
1984-03-01soldstatus $13,300
ⓘ Source: listings_history table (triggers on properties + properties_extension) + one-shot
backfill from property_details.listing_events for pre-trigger history.
Tax reassessment forecast OH · Partial reset (capped growth)
- Current annual tax
- $2,015 · $168/mo
- Projected year-2 tax
- $3,269 · $272/mo
- Expected delta
- +$1,254/yr (+$104/mo · 62.2%)
ⓘ Screening estimate from a state-policy table — verify with the county assessor before closing.
Climate risk First Street
- Flood 1/10 Low FEMA zone X · 0% chance over 30 yrs
- Wildfire 1/10 Low
- Heat 4/10 Moderate 7 d/yr ≥100°F today · 18 d/yr by 30 yrs out
- Wind 2/10 Low 100% chance of damaging wind over 30 yrs
- Air quality 3/10 Moderate 2 unhealthy d/yr today · 4 by 30 yrs out
Nearby sold comps map
Loading sold comps map…
Walkable amenities ~0.75 mi
Loading nearby amenities…
Taxation est. · year 1
- Rental income
- $33,180
- − Mortgage interest
- −$16,239
- − Property taxes
- −$2,015
- − Insurance
- −$1,450
- − Repairs & maintenance
- −$2,654
- − Management
- −$2,654
- − Depreciation
- −$8,433
- Taxable loss
- −$266
- Est. tax savings @ 24.0%
- +$64
- After-tax cash flow
- $4,568/yr
For passive investors: Depreciation is non-cash, so a rental often shows a tax loss while cash-flowing — sheltering income. Rental losses are passive: they offset passive income freely, and up to $25,000/yr can offset ordinary (W-2) income if you actively participate and your MAGI is under $100k (phasing out to $0 by $150k); unused losses carry forward. On sale, claimed depreciation is recaptured at up to 25%, and gains may owe capital-gains tax (a 1031 exchange can defer both). Figures are a year-1 estimate at your 24.0% rate — not tax advice; consult a CPA.
Schools (NCES district)
- District
- Columbus City School District
- NCES district ID
- 3904380
- Math proficiency
- 15% ▼ -17.00%
- Reading proficiency
- 26% ▼ -12.00%
- Median HH income
- $38,483
- Composite
- 17.19/100
- National rank
- #9105
- State rank
- #626 of 656 in OH
Livability — Columbus
- Score
- 81/100
- State rank
- #97
- US rank
- #1491
Category grades
Schools grade is shown separately in the Schools card above.
Census & demographics
- Census place
- Columbus, OH
- County
- Franklin County · 1,351,780 people
- City population
- 612,189
- Metro
- Columbus, OH
- Population (ZIP)
- 4,819
- Household income
- $32,321
- Rent vs Own
- Severe rent burden
- 126.0
Population outlook (Franklin County) Hauer SSP2
- Today (2025)
- 1,456,139 people
- By 2030
- 1,556,890 · +6.9%
- By 2040
- 1,757,349 · +20.7%
- By 2050
- 1,950,539 · +34.0%
- By 2075
- 2,376,171 · +63.2%
- By 2100
- 2,636,796 · +81.1%
Race, ethnicity, and origin ACS 2023
- Neighborhood character
- Highly diverse neighborhood (Simpson 0.71)
- Race & ethnicity
- White 43% Hispanic / Latino 28% Two or more races 21% Black 18% Asian 2%
- Hispanic origin (detail)
- Mexican 1% Puerto Rican 16% Dominican 5%
- Common ancestry
- Lithuanian 1% Slovak 1% Ukrainian 1%
- Foreign-born
- 8% · Canada, South Korea
- Languages at home
- 86% English-only · Spanish 11% Korean 1% Russian/Polish/Slavic 0%
Political lean MEDSL · Franklin
- 2024 margin
- Strong D (+28.4) · D 63.7% · R 35.3% · Other 1.0%
- 2008→2024 swing
- +7.7pp toward D · 2008: 20.7pp · 2024: 28.4pp
- All cycles
- 2024: D+28.4 2020: D+31.4 2016: D+25.9 2012: D+21.7 2008: D+20.7
Not yet ingested
- Civics
- —
Market trends
- HPI YoY
- ▲ 231.44%
- Current HPI
- 654.0855
- Rent YoY
- —
- Metro
- Columbus, OH
- State GDP YoY
- ▲ 1.98%
- F500 in state
- 48
Industry mix (Fortune 500 HQ in OH)
| Industry | F500 HQs | Revenue |
|---|---|---|
| Insurance | 3 | $145B |
|
||
| Industrial Machinery | 3 | $49B |
|
||
| Financial Services | 3 | $24B |
|
||
| Consumer Goods | 2 | $93B |
|
||
| Aerospace / Defense | 2 | $47B |
|
||
| Utilities | 2 | $33B |
|
||
Price history
+2079.7% since first listed25 events — show timeline
- 2026-04-22 Listed $289,900 CBRMLS
- 2018-09-18 Sold (Public Records) $70,000 Public Records
- 2018-09-07 Sold (MLS) $70,000 CBRMLS
- 2018-08-06 Contingent — CBRMLS
- 2018-08-04 Listed $74,900 CBRMLS
- 2017-03-19 Sold (MLS) $24,000 CBRMLS
- 2017-03-06 Sold (Public Records) $24,000 Public Records
- 2017-02-11 Pending — CBRMLS
- 2017-02-02 Price Changed $27,500 CBRMLS
- 2016-10-26 Price Changed $29,000 CBRMLS
- 2016-06-03 Price Changed $35,500 CBRMLS
- 2016-05-06 Price Changed $37,500 CBRMLS
- 2016-01-26 Price Changed $39,500 CBRMLS
- 2015-12-28 Price Changed $44,500 CBRMLS
- 2015-10-28 Listed $49,000 CBRMLS
- 2014-03-04 Sold (Public Records) $39,700 Public Records
- 2014-01-02 Sold (Public Records) $12,000 Public Records
- 2013-12-26 Sold (MLS) $12,000 CBRMLS
- 2013-12-05 Listing Removed — CBRMLS
- 2013-09-27 Listed $19,900 CBRMLS
- 2003-12-10 Sold (Public Records) $65,000 Public Records
- 2000-04-04 Sold (Public Records) $24,000 Public Records
- 1998-10-13 Sold (Public Records) $64,000 Public Records
- 1998-09-16 Sold (Public Records) $167,500 Public Records
- 1984-03-01 Sold (Public Records) $13,300 Public Records
Property tax history
+7.9%/yrLatest (2024): $2,015 · +1.3% YoY. Source: county tax records.
Cash-flow waterfall
monthlySold comps — $/sqft
last 12 mo · ≤1 miLoading sold comps…