 Multi-family
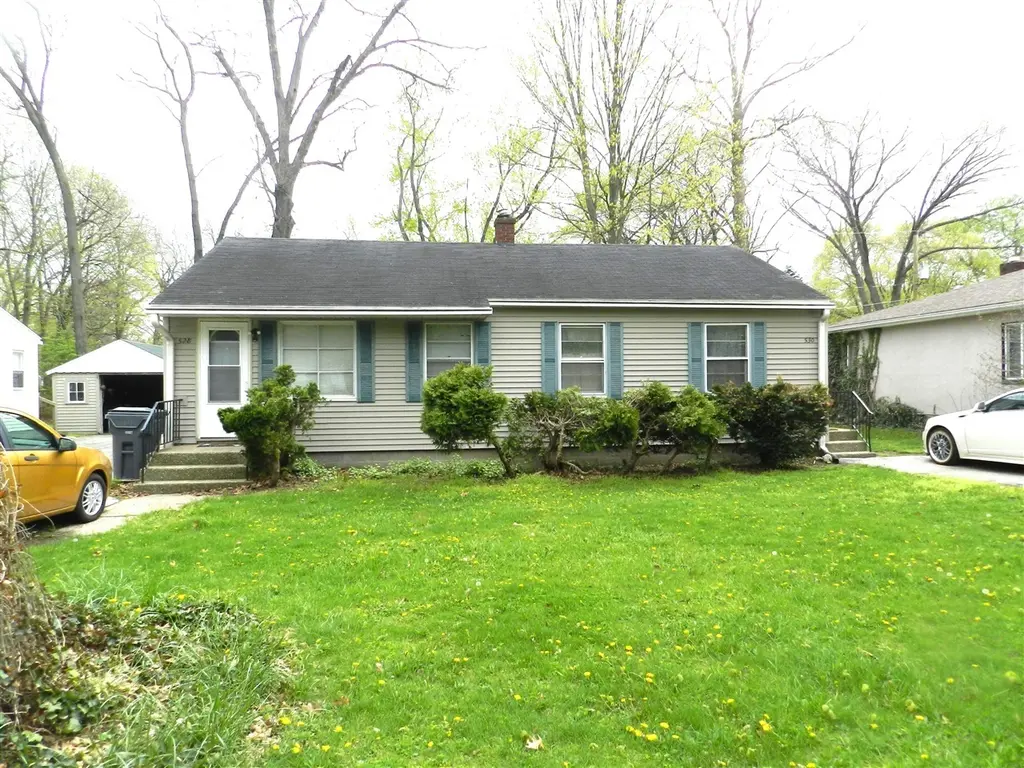
518 & 528 Chippewa Rd · Fair Plain, MI
Flood risk 6/10 · Moderate
- FEMA flood zone
- X (unshaded)
- Chance of flooding over 30 yrs
- 0.73%
- Est. flood insurance / yr
- $473 – $860
Fire risk 1/10 · Minimal
- Est. fire insurance / yr
- $784 – $1,456
Heat risk 2/10 · Minimal
- Hot days now (above 100°F)
- 7 days/yr
- Hot days in 30 yrs
- 14 days/yr
Wind risk 2/10 · Minimal
- Chance of severe wind over 30 yrs
- —
Air-quality risk 5/10 · Moderate
- Unhealthy air days now
- 8 days/yr
- Unhealthy air days in 30 yrs
- 8 days/yr
Risk factors via First Street. Map © Google.
Why this score? — see what drove the B- grade
The composite is a weighted blend of 9 inputs, each scored 0–100. Each bar is that input's sub-score; the figure is the points it added to the 100-point composite (weight × sub-score).
- Cash flow +30.0/30.0
- DSCR +10.0/10.0
- 1% rule +8.7/10.0
- ARV discount +7.5/15.0
- Livability +3.2/5.0
- Rent growth +2.5/5.0
- Condition / age +2.5/5.0
- Schools +0.8/10.0
- Appreciation +0.0/10.0
$355,000
🖨 Deal sheet 📄 Offer letter ✓ Due diligence
Multi-family units
County records classify this as Multi-Family (2-4 Unit). Listing-text estimate: 1 unit. estimate disagrees with records
Listing remarks MLS
Great Investment Opportunity in St Joseph Township! There are two duplexes included in the sale with a total of 4 units. Each unit comprises of one bedroom and one bathroom. There is the option to rent out all four units for maximum rental income or to convert one duplex into a spacious single family home while maintaining rental income from the other duplex. These properties are in great central location close to downtown St Joe, Lake Michigan, schools, shopping, and restaurants. This property also includes the duplex next door at 518 Chippewa Rd (Tax ID # 11-18-5200-0061-00-5)
Key facts
- Total of 4 units
- Central location
- Two duplexes
Tags
Property features AI
Finance
- Financial info: Listing includes rent for individual units: $1,050; $975; $1,080; $1,050
Exterior
- Parking: Garage parking (total 4 parking spaces); Paved parking
- Utilities: Public water; Public sewer; Cable connected; Electricity connected; Natural gas connected; Phone available
- Home design: Residential income property; Multi-family building
- Construction: Vinyl siding exterior; Total building area approximately 2,165
- Exterior features: Composition roof; Paved road access; Publicly maintained road
Interior
- Bedrooms: Four 1-bedroom units (#518, #520, #528, #530) each with separate heat systems
- Bathrooms: Each unit includes 1 bathroom
- Heating & cooling: Forced air heating; Natural gas
- Interior features: Crawl space basement
Neighborhood map
What this means for you Summary
Snapshot
- This is a 4-bed/2.0-bath multifamily listed at $355k.
Deal economics
- At list price, monthly cash flow is $2k ($20k/yr) — positive.
- The deal already cash-flows at list — no discount required.
- Meets the 1% rule at list price ($5k rent vs $355k).
- Recommended offer: $344k (3.0% below list) — sets the bar for market timing.
- Cap rate 11.9% vs local median 2.7% in Fair Plain — top-decile yield for the area; either an underpriced asset or a hidden risk that comps aren't pricing in. Stress-test before assuming the spread holds.
Location & tenants
- Location reads 64/100 on livability (#495 in MI) — a middle-class / working-renter tenant base. Strengths: cost of living A+, housing A+; Watch: crime C-, schools F, amenities F.
- Benton Harbor Area Schools (urban): math 4% / reading 7% proficiency, ranked #732 of 760 in MI (top 96%) — low school quality limits family demand, transient renter base, plan for 1-2y turnover; 89% free/reduced lunch — lower-income household profile, screen leases tightly.
- Market conditions: 179 active listings in the ZIP; 397 units permitted in Berrien County in 2024 (40 in 5+ unit buildings).
Forward outlook
- Local home prices are declining (-3.0%/yr); year-one equity from $2k of loan paydown is wiped out by about $11k of value loss. Plan a longer hold.
- Berrien County population projected at -16% by 2050 — secular population decline; favor cash flow + early exit over multi-decade hold.
- At projected returns (-3.0% appreciation + 3.0% rent growth), your $99k cash investment doubles in ~7 years — after that, you're playing with house money.
Negotiation context
- It's been on market 56 days — a 3% lower offer ($344k) is reasonable based on typical stale-listing flexibility.
- 2 sale attempts with the ask held roughly flat each time — persistent listings suggest the price (not the market) is what's stuck; bring a comps-based counter.
Risks & watch-outs
- Watch-outs: built in 1952 — expect roof / HVAC / electrical / plumbing capex.
- Climate carrying-cost: major flood risk — expect insurance premiums to compound above CPI over the hold.
Questions for the listing agent
- It's been on market 56 days. Have you received any prior offers? Is the seller open to a 3% concession, seller financing, or rate buy-down credit?
- Built in 1952 — when were the roof, HVAC, electrical panel, plumbing, and water heater last replaced?
- Is there a deadline driving the sale (1031 exchange, divorce, estate, relocation)? That informs how much negotiation room exists.
- Schools are F-rated, which usually means shorter tenancies and higher turnover. Who's the typical renter profile here, and what's been the actual vacancy rate?
- What's the average days-on-market for RENTAL listings here right now (not sales)? A rising rental-DOM trend means longer vacancies and softer asking-rent achievability than the comps imply.
- What's the recent tenant-quality profile in this submarket — average credit score on applications, eviction rate, late-payment / NSF rate, and stable-employment percentage? A property-management company in the area should have these aggregated.
- How much new apartment / multifamily construction is in the pipeline within 1–3 miles? Heavy new supply (>2% of stock underway) typically softens rents 12–24 months out; light construction supports rent growth.
Investment metrics
- 1% rule
- 1.37% ✓
- Cap rate
- 11.95%
- Cash-on-cash
- 20.20%
- DSCR
- 1.90
- GRM
- 6.1
CMA / ARV
- ARV (median comp)
- $216,319
- List price
- $355,000
- Delta
- 64.11%
- Verdict
- OVERPRICED
- Comps
- 4 within 1.0 mi
Projected returns pro-forma
-3.0% appreciation · 3.0% rent growth · sell at horizon
- IRR
- 12.4%
- Equity multiple
- 1.49×
- Total profit
- $48,933
- Equity at exit
- $52,932
- IRR
- 21.3%
- Equity multiple
- 2.80×
- Total profit
- $179,387
- Equity at exit
- $30,694
Cash invested: $99,400 (down + closing). Projections, not guarantees.
Landlord ↔ Tenant lean methodology
- Overall (STATE)
- 62 Landlord-Friendly
- State Michigan
- 62 Landlord-Friendly · EVEN
- County
- — inherits STATE
- City
- — inherits STATE
ZIP-level market 49022
- Active inventory
- 179
- Price-to-rent
- 24.4×
Monthly cashflow live
- Estimated rent
- $4,846 high interval (Pro) →
- Mortgage (P&I)
- −$1,862
- Tax from tax record
- −$146 /mo · $1,746/yr
- Insurance
- −$148
- HOA
- −$0
- Vacancy / Maint / Mgmt
- −$1,018
- Net cashflow
- $1,673
Break-even live
4-unit breakdown (identical units grouped — click to expand)
| Units | Beds | Baths | Est. rent |
|---|---|---|---|
| 4× units | 1 | 1 | $4,844 |
| #1 | 1 | 1 | $1,211 |
| #2 | 1 | 1 | $1,211 |
| #3 | 1 | 1 | $1,211 |
| #4 | 1 | 1 | $1,211 |
| Total (4 units) | $4,846 | ||
UW: 25.0% down · 7.5% · 30yr · 1.5% tax · 5.0% vac · 8.0% maint · 8.0% mgmt
Financing live
Cash to close
- Down payment
- $88,750
- Closing costs
- $10,650
- Reserves months
- —
- Total cash needed
- —
Loan-product check · same deal, 3 products live
Conventional
25% down · 7.5% · 30yr
- Down + closing
- —
- Monthly P&I
- —
- Monthly cashflow
- —
- DSCR
- —
- Eligible?
- —
Personal DTI + credit; lowest rate.
DSCR
20% down · 8.5% · 30yr
- Down + closing
- —
- Monthly P&I
- —
- Monthly cashflow
- —
- DSCR
- —
- Eligible?
- —
No personal income docs; deal must DSCR.
Hard money
10% down · 12.0% · 12mo
- Down + closing
- —
- Monthly P&I
- —
- Monthly cashflow
- —
- DSCR
- —
- Eligible?
- —
Short-term bridge; refi at stabilization.
Listing history 18 events
-
2026-06-19days on market $355,000 Active 56 DOM
-
2026-06-18days on market $355,000 Active 55 DOM
-
2026-06-17days on market $355,000 Active 54 DOM
-
2026-06-16days on market $355,000 Active 53 DOM
-
2026-06-15pricedays on market $355,000 Active 52 DOM
-
2026-06-14days on market $360,000 Active 50 DOM
-
2026-06-13days on market $360,000 Active 49 DOM
Show marketing remark (585 chars)
Great Investment Opportunity in St Joseph Township! There are two duplexes included in the sale with a total of 4 units. Each unit comprises of one bedroom and one bathroom. There is the option to rent out all four units for maximum rental income or to convert one duplex into a spacious single family home while maintaining rental income from the other duplex. These properties are in great central location close to downtown St Joe, Lake Michigan, schools, shopping, and restaurants. This property also includes the duplex next door at 518 Chippewa Rd (Tax ID # 11-18-5200-0061-00-5)
-
2026-06-10days on market $360,000 Active 47 DOM
-
2026-06-09days on market $360,000 Active 46 DOM
-
2026-06-08days on market $360,000 Active 45 DOM
-
2026-06-07days on market $360,000 Active 44 DOM
-
2026-06-03days on market $360,000 Active 40 DOM
-
2026-06-02days on market $360,000 Active 39 DOM
-
2026-06-01days on market $360,000 Active 38 DOM
-
2026-05-31days on market $360,000 Active 37 DOM
-
2026-05-30days on market $360,000 Active 36 DOM
-
2026-04-24$360,000 Active 585-char remark
Show marketing remark (585 chars)
Great Investment Opportunity in St Joseph Township! There are two duplexes included in the sale with a total of 4 units. Each unit comprises of one bedroom and one bathroom. There is the option to rent out all four units for maximum rental income or to convert one duplex into a spacious single family home while maintaining rental income from the other duplex. These properties are in great central location close to downtown St Joe, Lake Michigan, schools, shopping, and restaurants. This property also includes the duplex next door at 518 Chippewa Rd (Tax ID # 11-18-5200-0061-00-5)
-
2026-04-24$360,000 Active 585-char remark
Show marketing remark (585 chars)
Great Investment Opportunity in St Joseph Township! There are two duplexes included in the sale with a total of 4 units. Each unit comprises of one bedroom and one bathroom. There is the option to rent out all four units for maximum rental income or to convert one duplex into a spacious single family home while maintaining rental income from the other duplex. These properties are in great central location close to downtown St Joe, Lake Michigan, schools, shopping, and restaurants. This property also includes the duplex next door at 518 Chippewa Rd (Tax ID # 11-18-5200-0061-00-5)
ⓘ Source: listings_history table (triggers on properties + properties_extension) + one-shot
backfill from property_details.listing_events for pre-trigger history.
Tax reassessment forecast MI · Partial reset (capped growth)
- Current annual tax
- $1,746 · $146/mo
- Projected year-2 tax
- $3,607 · $301/mo
- Expected delta
- +$1,860/yr (+$155/mo · 106.5%)
ⓘ Screening estimate from a state-policy table — verify with the county assessor before closing.
Climate risk First Street
- Flood 6/10 Major FEMA zone X (unshaded) · 73% chance over 30 yrs
- Wildfire 1/10 Low
- Heat 2/10 Low 7 d/yr ≥100°F today · 14 d/yr by 30 yrs out
- Wind 2/10 Low
- Air quality 5/10 Major 8 unhealthy d/yr today · 8 by 30 yrs out
Nearby sold comps map
Loading sold comps map…
Walkable amenities ~0.75 mi
Loading nearby amenities…
Taxation est. · year 1
- Rental income
- $58,152
- − Mortgage interest
- −$19,886
- − Property taxes
- −$1,746
- − Insurance
- −$1,775
- − Repairs & maintenance
- −$4,652
- − Management
- −$4,652
- − Depreciation
- −$10,327
- Taxable income
- $15,113
- Est. tax owed @ 24.0%
- −$3,627
- After-tax cash flow
- $16,451/yr
For passive investors: Depreciation is non-cash, so a rental often shows a tax loss while cash-flowing — sheltering income. Rental losses are passive: they offset passive income freely, and up to $25,000/yr can offset ordinary (W-2) income if you actively participate and your MAGI is under $100k (phasing out to $0 by $150k); unused losses carry forward. On sale, claimed depreciation is recaptured at up to 25%, and gains may owe capital-gains tax (a 1031 exchange can defer both). Figures are a year-1 estimate at your 24.0% rate — not tax advice; consult a CPA.
Schools (NCES district)
- District
- Benton Harbor Area Schools
- NCES district ID
- 2604830
- Math proficiency
- 4% ▬ 0.00%
- Reading proficiency
- 7% ▬ 0.00%
- Median HH income
- $27,038
- Composite
- 7.53/100
- National rank
- #14787
- State rank
- #732 of 760 in MI
Livability — Fair Plain
- Score
- 64/100
- State rank
- #495
- US rank
- #14566
Category grades
Schools grade is shown separately in the Schools card above.
Census & demographics
- Census place
- Fair Plain, MI
- Population (ZIP)
- 29,796
Population outlook (Berrien County) Hauer SSP2
- Today (2025)
- 149,273 people
- By 2030
- 145,211 · -2.7%
- By 2040
- 135,435 · -9.3%
- By 2050
- 125,543 · -15.9%
- By 2075
- 103,986 · -30.3%
- By 2100
- 82,256 · -44.9%
Race, ethnicity, and origin ACS 2023
- Neighborhood character
- Diverse neighborhood (Simpson 0.61)
- Race & ethnicity
- Black 50% White 37% Hispanic / Latino 7% Two or more races 6% Native American 2%
- Hispanic origin (detail)
- Mexican 6%
- Common ancestry
- Romanian 1% Lithuanian 1% Slovak 1%
- Foreign-born
- 3% · Canada
- Languages at home
- 94% English-only · Spanish 5%
Political lean MEDSL · Berrien
- 2024 margin
- Lean R (+7.9) · D 45.4% · R 53.2% · Other 1.4%
- 2008→2024 swing
- -13.3pp toward R · 2008: 5.5pp · 2024: -7.9pp
- All cycles
- 2024: R+7.9 2020: R+7.4 2016: R+12.7 2012: R+6.6 2008: D+5.5
Not yet ingested
- Civics
- —
Market trends
- HPI YoY
- ▼ -309.81%
- Current HPI
- 209.9723
- Rent YoY
- —
- Metro
- —
- State GDP YoY
- ▲ 1.37%
- F500 in state
- 28
Industry mix (Fortune 500 HQ in MI)
| Industry | F500 HQs | Revenue |
|---|---|---|
| Automotive Parts | 3 | $48B |
|
||
| Automotive | 2 | $372B |
|
||
| Chemicals | 1 | $45B |
|
||
| Automotive Retail | 1 | $29B |
|
||
| Healthcare / Medical Devices | 1 | $23B |
|
||
| Automotive Technology | 1 | $20B |
|
||
Price history
-1.4% since first listed4 events — show timeline
- 2026-06-14 Price Changed $355,000 REALCOMP
- 2026-06-13 Price Changed $355,000 MiRealSource-MiMLS
- 2026-04-24 Listed $360,000 MiRealSource-MiMLS
- 2026-04-24 Listed $360,000 REALCOMP
Property tax history
+0.5%/yrLatest (2024): $1,746 · +4.4% YoY. Source: county tax records.
Cash-flow waterfall
monthlySold comps — $/sqft
last 12 mo · ≤1 miLoading sold comps…