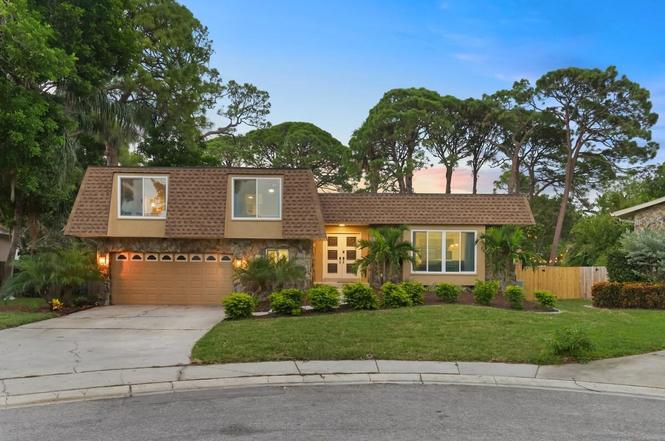
14389 83rd Pl · Seminole, FL
Flood risk 8/10 · Major
- FEMA flood zone
- AE
- Chance of flooding over 30 yrs
- 0.99%
- Est. flood insurance / yr
- $1,737 – $8,500
Fire risk 1/10 · Minimal
- Est. fire insurance / yr
- $947 – $1,759
Heat risk 10/10 · Severe
- Hot days now (above 107°F)
- 8 days/yr
- Hot days in 30 yrs
- 29 days/yr
Wind risk 10/10 · Severe
- Chance of severe wind over 30 yrs
- 99.0%
Air-quality risk 3/10 · Minor
- Unhealthy air days now
- 2 days/yr
- Unhealthy air days in 30 yrs
- 2 days/yr
Risk factors via First Street. Map © Google.
Why this score? — see what drove the C- grade
The composite is a weighted blend of 9 inputs, each scored 0–100. Each bar is that input's sub-score; the figure is the points it added to the 100-point composite (weight × sub-score).
- Cash flow +23.1/30.0
- DSCR +7.4/10.0
- 1% rule +5.8/10.0
- Livability +4.4/5.0
- Schools +4.3/10.0
- Rent growth +2.5/5.0
- Condition / age +2.5/5.0
- ARV discount +0.0/15.0
- Appreciation +0.0/10.0
$989,999
🖨 Deal sheet 📄 Offer letter ✓ Due diligence
Listing remarks MLS
Welcome to your dream home in Seminole, Florida! This stunning home offers a perfect blend of modern luxury and convenient location, making it an ideal choice to call your next home. This home in located in a A rated school system. Situated in a desirable cul-de-sac, enjoy a quiet and private setting, away from the hustle and bustle of main roads. Its proximity to world-famous beaches ensures you can easily access the sun, sand, and surf just a short distance from your doorstep. The house itself has undergone a complete renovation, resulting in a tastefully updated and contemporary living space. Every detail has been carefully considered, providing a fresh and stylish ambiance throughout. Roof was just replaced in 2022, Brand new kitchen with quartz counter tops, stainless steal appliance package, open concept floor plan, wet bar area, and so much more! The expansive fenced in backyard with pool will offer plenty of space for outdoor activities and relaxation! This property is not located in an HOA! Come check out this home before its too late!
Key facts
- Private heated pool
- Dual gazebos
- Custom outdoor bar
Tags
Property features AI
Finance
- Other: Property zoned R-2; Irrigation equipment installed
- Financial info: No lease restrictions indicated
- HOA & community: Association approval required; Pets allowed; Full-time property management
Exterior
- Parking: Attached garage (1 garage space); Electric vehicle charging station(s); Golf cart parking
- Security: No specific security system listed
- Utilities: Public water; Public sewer; Electricity available and connected; Cable available; Fiber optics available; Water and sewer available and connected
- Home design: Single-family residence; Multi/split levels; Faces south
- Construction: Stucco exterior; Shingle roof; Concrete perimeter foundation and slab; Built on a 0.23-acre lot
- Exterior features: Private in-ground pool with auto cleaner, lighting, and chlorine-free system; Outdoor grill; Outdoor shower; Private mailbox; Storage; Wood fencing; Paved road access
Interior
- Kitchen: Convection oven; Range; Range hood; Cooktop/oven (electric or gas not specified); Microwave; Dishwasher; Disposal; Refrigerator; Bar fridge; Wine refrigerator
- Bedrooms: 4 bedrooms
- Flooring: Tile flooring
- Bathrooms: 3 full bathrooms
- Heating & cooling: Central heating; Central air conditioning
- Interior features: Ceiling fans; Solid wood cabinets; Stone countertops; Thermostat; Wet bar; Wood-burning or gas fireplace in family room and living room
- Laundry & utility: Laundry room; Washer; Dryer; Electric water heater
Neighborhood map
What this means for you Summary
Snapshot
- This is a 4-bed/3.0-bath single-family listed at $990k.
Deal economics
- At list price, monthly cash flow is $1k ($16k/yr) — positive.
- The deal already cash-flows at list — no discount required.
- Meets the 1% rule at list price ($11k rent vs $990k).
- Cap rate 8.4% vs local median 3.8% in Seminole — top-decile yield for the area; either an underpriced asset or a hidden risk that comps aren't pricing in. Stress-test before assuming the spread holds.
Location & tenants
- Location reads 88/100 on livability (#5 in FL, #174 nationally) — a professional / high-income tenant draw. Strengths: commute A+, housing A+, health & safety A+.
- Pinellas (suburban): math 51% / reading 51% proficiency, ranked #31 of 73 in FL (top 42%) — acceptable for families but not a draw, mixed tenant base, ~2y average lease.
- Zoned schools: Seminole High School (math 26% / reading 47%, grade F, #351 of 667 statewide, top 54%, 1,546 students, 39% FRL).
- Zoned-school proficiency averages 36% at this address vs 51% district-wide (-14 pts) — the specific schools serving this property underperform the Pinellas average; the district grade overstates school quality for this exact location.
- Market conditions: 146 active listings in the ZIP; 12 comparable units currently listed for rent nearby; rentals at typical pace (median 24d on market — plan ~3-4 weeks tenant-placement turnaround); 2,676 units permitted in Pinellas County in 2024 (1,422 in 5+ unit buildings).
Forward outlook
- Local home prices are declining (-3.0%/yr); year-one equity from $7k of loan paydown is wiped out by about $30k of value loss. Plan a longer hold.
- Pinellas County population projected at +14% by 2050 — modest demand growth; plan on rents tracking national, not racing it.
Negotiation context
- Only 1 days on market — expect competitive offers; lowballing is unlikely to land.
- 7 sale attempts since 19y ago with the ask held roughly flat each time — persistent listings suggest the price (not the market) is what's stuck; bring a comps-based counter.
- Current owner paid $858k; 15% above their basis — modest negotiation headroom, anchor on the comps not their cost.
Risks & watch-outs
- Watch-outs: flood insurance adds $427/mo.
- Climate carrying-cost: in FEMA flood zone AE (mandatory federal flood insurance); severe wind risk, 99% chance of damaging wind over 30y; extreme-heat days projected 8→29/yr by 2055 (HVAC capex compounding) — expect insurance premiums to compound above CPI over the hold.
Questions for the listing agent
- Built in 1976 — when were the roof, HVAC, electrical panel, plumbing, and water heater last replaced?
- What's the actual annual flood-insurance premium (NFIP or private), and is the property in a SFHA with mandatory coverage?
- Is there a deadline driving the sale (1031 exchange, divorce, estate, relocation)? That informs how much negotiation room exists.
- Schools are B-rated — typically a magnet for longer-tenancy family renters. What's the average tenant stay here, and is there a school-zone premium baked into asking?
- What's the average days-on-market for RENTAL listings here right now (not sales)? A rising rental-DOM trend means longer vacancies and softer asking-rent achievability than the comps imply.
- What's the recent tenant-quality profile in this submarket — average credit score on applications, eviction rate, late-payment / NSF rate, and stable-employment percentage? A property-management company in the area should have these aggregated.
- How much new for-sale + rental construction is in the pipeline within 1–3 miles? Heavy new supply typically softens prices + rents 12–24 months out; constrained supply supports both.
Investment metrics
- 1% rule
- 1.08% ✓
- Cap rate
- 8.44%
- Cash-on-cash
- 7.67%
- DSCR
- 1.34
- GRM
- 7.7
CMA / ARV
- ARV (on-the-fly)
- $817,632
- Comps found
- 12
Show comp detail 12 sales within ~0.75 mi
| Address | Dist | Beds/Ba | Sqft | Sold | Price | $/sf | Match |
|---|---|---|---|---|---|---|---|
| 14265 85th Ave | 0.12mi | 4/3.0 | 2,540 (-5%) | 5mo | $745,000 | $293 | 82 |
| 14359 82nd Ter | 0.06mi | 4/2.5 | 2,510 (-6%) | 6mo | $720,000 | $287 | 80 |
| 14176 86th Ave | 0.18mi | 5/3.0 (+1) | 2,582 (-3%) | 9mo | $665,000 | $258 | 73 |
| 8310 140th St | 0.24mi | 4/3.0 | 2,409 (-10%) | 6mo | $845,000 | $351 | 68 |
| 14311 83rd Pl | 0.06mi | 5/3.0 (+1) | 2,932 (+10%) | 13mo | $885,000 | $302 | 65 |
| 13764 86th Ave | 0.48mi | 4/3.0 | 2,420 (-9%) | 1mo | $570,000 | $236 | 61 |
| 8501 141st St | 0.23mi | 4/3.0 | 2,328 (-13%) | 10mo | $541,940 | $233 | 60 |
| 13780 76th Ave | 0.69mi | 4/3.5 | 2,692 (+1%) | 6mo | $915,000 | $340 | 60 |
| 13922 Oak Forest Blvd N | 0.38mi | 4/3.0 | 2,486 (-7%) | 15mo | $1,045,000 | $420 | 58 |
| 13800 77th Ave | 0.61mi | 4/3.5 | 2,908 (+9%) | 5mo | $940,000 | $323 | 51 |
| 7551 141st St | 0.56mi | 3/2.0 (-1) | 2,873 (+8%) | 13mo | $880,000 | $306 | 42 |
| 13781 74th Ave | 0.73mi | 4/2.5 | 2,299 (-14%) | 1mo | $750,000 | $326 | 40 |
Match score weights: distance 35% · size 25% · config 20% · recency 20%. Top-matched comps best support the ARV.
Projected returns pro-forma
-3.0% appreciation · 3.0% rent growth · sell at horizon
- IRR
- -7.3%
- Equity multiple
- 0.73×
- Total profit
- $-74,385
- Equity at exit
- $147,612
- IRR
- 2.4%
- Equity multiple
- 1.17×
- Total profit
- $46,932
- Equity at exit
- $85,597
Cash invested: $277,200 (down + closing). Projections, not guarantees.
Landlord ↔ Tenant lean methodology
- Overall (STATE)
- 87 Strongly Landlord-Friendly
- State Florida
- 87 Strongly Landlord-Friendly · R+3
- County
- — inherits STATE
- City
- — inherits STATE
ZIP-level market 33776
- Active inventory
- 146
- Price-to-rent
- 7.7×
Monthly cashflow live
- Estimated rent
- $10,712 high interval (Pro) →
- Mortgage (P&I)
- −$5,192
- Tax from tax record
- −$1,086 /mo · $13,037/yr
- Insurance
- −$412
- Flood insurance flood zone
- −$427 /mo · $5,118/yr
- HOA
- −$0
- Vacancy / Maint / Mgmt
- −$2,250
- Net cashflow
- $1,346
Break-even live
UW: 25.0% down · 7.5% · 30yr · 1.5% tax · 5.0% vac · 8.0% maint · 8.0% mgmt
Financing live
Cash to close
- Down payment
- $247,500
- Closing costs
- $29,700
- Reserves months
- —
- Total cash needed
- —
Loan-product check · same deal, 3 products live
Conventional
25% down · 7.5% · 30yr
- Down + closing
- —
- Monthly P&I
- —
- Monthly cashflow
- —
- DSCR
- —
- Eligible?
- —
Personal DTI + credit; lowest rate.
DSCR
20% down · 8.5% · 30yr
- Down + closing
- —
- Monthly P&I
- —
- Monthly cashflow
- —
- DSCR
- —
- Eligible?
- —
No personal income docs; deal must DSCR.
Hard money
10% down · 12.0% · 12mo
- Down + closing
- —
- Monthly P&I
- —
- Monthly cashflow
- —
- DSCR
- —
- Eligible?
- —
Short-term bridge; refi at stabilization.
Rent comps 12 comps
| Address | Beds | Baths | Sqft | Rent | $/sqft | DOM | Units | Dist |
|---|---|---|---|---|---|---|---|---|
| 14323 83rd Pl N Unit 1471180P Seminole, FL | 4.0 | 3.0 | 2895 | $13,452 | $4.65 | 21d | 1 | 0.02mi |
| 19138 Whispering Pines Dr Indian Shores, FL | 4.0 | 3.0 | 2424 | $8,000 | $3.30 | 24d | 1 | 0.37mi |
| 14414 91st Ave Seminole, FL | 3.0 | 2.5 | 2083 | $8,000 | $3.84 | 24d | 1 | 0.44mi |
| 19505 Gulf Blvd #304 Indian Shores, FL | 4.0 | 2.5 | 2388 | $15,000 | $6.28 | 4d | 1 | 0.50mi |
| 7672 140th St Unit NA Seminole, FL | 4.0 | 3.5 | 2840 | $4,700 | $1.65 | 4d | 1 | 0.50mi |
| 9614 Tara Cay Ct Seminole, FL | 4.0 | 4.0 | 2100 | $2,850 | $1.36 | 20d | 1 | 0.86mi |
| 9794 Indian Key Trl Unit 90 Seminole, FL | 4.0 | 4.0 | 2174 | $3,650 | $1.68 | 24d | 1 | 0.91mi |
| 17900 Gulf Blvd Unit 16C Redington Shores, FL | 3.0 | 3.0 | 1789 | $3,450 | $1.93 | 7d | 1 | 1.34mi |
| 10075 West Bay St Seminole, FL | 5.0 | 2.5 | 2043 | $8,900 | $4.36 | 24d | 1 | 1.36mi |
| 17900 Gulf Blvd Unit 18-C Redington Shores, FL | 3.0 | 2.5 | 1935 | $4,200 | $2.17 | 24d | 1 | 1.36mi |
| 13964 106th Ave Largo, FL | 3.0 | 2.0 | 2281 | $3,500 | $1.53 | 24d | 1 | 1.45mi |
| 17810 Lee Ave Redington Shores, FL | 4.0 | 4.0 | 3160 | $18,000 | $5.70 | 24d | 1 | 1.50mi |
Listing history 2 events
-
2026-06-17remarks 687-char remark
-
2026-06-17$989,999 Active 1 DOM
ⓘ Source: listings_history table (triggers on properties + properties_extension) + one-shot
backfill from property_details.listing_events for pre-trigger history.
Tax reassessment forecast FL · Resets to sale price
- Current annual tax
- $13,037 · $1,086/mo
- Projected year-2 tax
- $13,037 · $1,086/mo
- Expected delta
- $0/yr ($0/mo · 0.0%)
ⓘ Screening estimate from a state-policy table — verify with the county assessor before closing.
Climate risk First Street
- Flood 8/10 Severe FEMA zone AE · 99% chance over 30 yrs
- Wildfire 1/10 Low
- Heat 10/10 Extreme 8 d/yr ≥107°F today · 29 d/yr by 30 yrs out
- Wind 10/10 Extreme 99% chance of damaging wind over 30 yrs
- Air quality 3/10 Moderate 2 unhealthy d/yr today · 2 by 30 yrs out
Nearby sold comps map
Loading sold comps map…
Walkable amenities ~0.75 mi
Loading nearby amenities…
Taxation est. · year 1
- Rental income
- $128,548
- − Mortgage interest
- −$55,455
- − Property taxes
- −$13,037
- − Insurance
- −$10,068
- − Repairs & maintenance
- −$10,284
- − Management
- −$10,284
- − Depreciation
- −$28,800
- Taxable income
- $620
- Est. tax owed @ 24.0%
- −$149
- After-tax cash flow
- $15,999/yr
For passive investors: Depreciation is non-cash, so a rental often shows a tax loss while cash-flowing — sheltering income. Rental losses are passive: they offset passive income freely, and up to $25,000/yr can offset ordinary (W-2) income if you actively participate and your MAGI is under $100k (phasing out to $0 by $150k); unused losses carry forward. On sale, claimed depreciation is recaptured at up to 25%, and gains may owe capital-gains tax (a 1031 exchange can defer both). Figures are a year-1 estimate at your 24.0% rate — not tax advice; consult a CPA.
Schools (NCES district)
- District
- Pinellas
- NCES district ID
- 1201560
- Math proficiency
- 51% ▼ -5.00%
- Reading proficiency
- 51% ▼ -3.00%
- Median HH income
- $46,270
- Composite
- 43.27/100
- National rank
- #3046
- State rank
- #31 of 73 in FL
Livability — Seminole
- Score
- 88/100
- State rank
- #5
- US rank
- #174
Category grades
Schools grade is shown separately in the Schools card above.
Census & demographics
- City population
- 42,315
- Population (ZIP)
- 12,711
Population outlook (Pinellas County) Hauer SSP2
- Today (2025)
- 1,027,532 people
- By 2030
- 1,063,586 · +3.5%
- By 2040
- 1,125,020 · +9.5%
- By 2050
- 1,168,637 · +13.7%
- By 2075
- 1,265,188 · +23.1%
- By 2100
- 1,260,357 · +22.7%
Race, ethnicity, and origin ACS 2023
- Neighborhood character
- Predominantly White (84%)
- Race & ethnicity
- White 84% Hispanic / Latino 7% Two or more races 7% Asian 2% Black 2%
- Hispanic origin (detail)
- Mexican 3%
- Common ancestry
- Romanian 7% Lithuanian 3% Slovak 1%
- Foreign-born
- 9% · Canada, Jamaica
- Languages at home
- 89% English-only · Other Indo-European 4% Russian/Polish/Slavic 3% Spanish 2%
Political lean MEDSL · Pinellas
- 2024 margin
- Lean R (+5.2) · D 46.9% · R 52.1%
- 2008→2024 swing
- -13.5pp toward R · 2008: 8.3pp · 2024: -5.2pp
- All cycles
- 2024: R+5.2 2020: D+0.2 2016: R+1.1 2012: D+5.6 2008: D+8.3
Not yet ingested
- Civics
- —
Market trends
- HPI YoY
- ▼ -455.42%
- Current HPI
- 337.3149
- Rent YoY
- —
- Metro
- —
- State GDP YoY
- ▲ 3.28%
- F500 in state
- 36
Industry mix (Fortune 500 HQ in FL)
| Industry | F500 HQs | Revenue |
|---|---|---|
| Industrial Technology | 2 | $29B |
|
||
| Insurance | 2 | $17B |
|
||
| Retail | 1 | $60B |
|
||
| Technology Distribution | 1 | $58B |
|
||
| Homebuilding | 1 | $35B |
|
||
| Technology Manufacturing | 1 | $35B |
|
||
Price history
+661.5% since first listed29 events — show timeline
- 2026-06-17 Listed $989,999 Stellar MLS as Distributed by MLS Grid
- 2023-07-25 Sold (Public Records) $857,500 Public Records
- 2023-07-21 Sold (MLS) $857,500 Stellar MLS as Distributed by MLS Grid
- 2023-06-08 Pending — Stellar MLS as Distributed by MLS Grid
- 2023-05-30 Listing Removed — Stellar MLS as Distributed by MLS Grid
- 2023-05-30 Listed $855,000 Stellar MLS as Distributed by MLS Grid
- 2023-05-21 Price Changed $855,000 Stellar MLS as Distributed by MLS Grid
- 2023-05-17 Price Changed $858,999 Stellar MLS as Distributed by MLS Grid
- 2023-05-05 Price Changed $859,000 Stellar MLS as Distributed by MLS Grid
- 2023-05-04 Price Changed $879,000 Stellar MLS as Distributed by MLS Grid
- 2023-05-01 Price Changed $889,000 Stellar MLS as Distributed by MLS Grid
- 2023-04-25 Price Changed $899,000 Stellar MLS as Distributed by MLS Grid
- 2023-04-11 Price Changed $899,999 Stellar MLS as Distributed by MLS Grid
- 2023-04-06 Price Changed $920,000 Stellar MLS as Distributed by MLS Grid
- 2023-03-21 Price Changed $942,000 Stellar MLS as Distributed by MLS Grid
- 2023-03-01 Price Changed $945,000 Stellar MLS as Distributed by MLS Grid
- 2023-02-23 Listed $979,999 Stellar MLS as Distributed by MLS Grid
- 2022-10-14 Sold (Public Records) $600,000 Public Records
- 2022-10-03 Sold (MLS) $600,000 Stellar MLS as Distributed by MLS Grid
- 2022-08-05 Pending — Stellar MLS as Distributed by MLS Grid
- 2022-07-18 Relisted — Stellar MLS as Distributed by MLS Grid
- 2022-07-14 Pending — Stellar MLS as Distributed by MLS Grid
- 2022-06-30 Price Changed $640,000 Stellar MLS as Distributed by MLS Grid
- 2022-06-07 Listed $660,000 Stellar MLS as Distributed by MLS Grid
- 2022-06-01 Listing Removed — Stellar MLS as Distributed by MLS Grid
- 2022-05-04 Price Changed $664,000 Stellar MLS as Distributed by MLS Grid
- 2022-04-19 Listed $679,900 Stellar MLS as Distributed by MLS Grid
- 2007-05-11 Listed $475,000 Stellar MLS as Distributed by MLS Grid
- 1984-08-01 Sold (Public Records) $130,000 Public Records
Property tax history
+10.1%/yrLatest (2025): $13,037 · +0.8% YoY. Source: county tax records.
Cash-flow waterfall
monthlySold comps — $/sqft
last 12 mo · ≤1 miLoading sold comps…