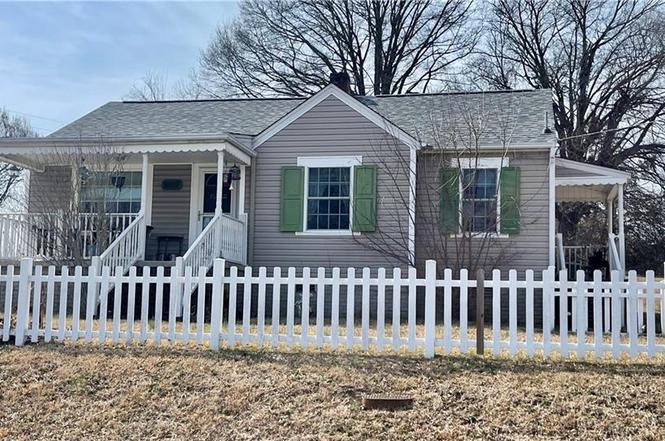
1607 Larkin St · High Point, NC
Flood risk 1/10 · Minimal
- FEMA flood zone
- X (unshaded)
- Chance of flooding over 30 yrs
- 0.0%
- Est. flood insurance / yr
- $507 – $1,088
Fire risk 1/10 · Minimal
- Est. fire insurance / yr
- $906 – $1,684
Heat risk 5/10 · Moderate
- Hot days now (above 104°F)
- 7 days/yr
- Hot days in 30 yrs
- 17 days/yr
Wind risk 4/10 · Minor
- Chance of severe wind over 30 yrs
- 14.0%
Air-quality risk 2/10 · Minimal
- Unhealthy air days now
- 1 days/yr
- Unhealthy air days in 30 yrs
- 1 days/yr
Risk factors via First Street. Map © Google.
Why this score? — see what drove the C- grade
The composite is a weighted blend of 9 inputs, each scored 0–100. Each bar is that input's sub-score; the figure is the points it added to the 100-point composite (weight × sub-score).
- Cash flow +18.8/30.0
- ARV discount +8.7/15.0
- DSCR +5.9/10.0
- 1% rule +3.9/10.0
- Livability +3.9/5.0
- Schools +3.6/10.0
- Rent growth +2.7/5.0
- Condition / age +2.5/5.0
- Appreciation +0.0/10.0
$155,000
🖨 Deal sheet (PDF) 📄 Offer letter ✓ Due diligence
Listing remarks
Charming house with a front porch for rocking chairs. Nice large back yard. Close and convenient to schools and shopping. Call agent's office to schedule veiwing
Key facts
- Close to schools
- Front porch
- Large back yard
Tags
Property features AI
Finance
- Other: Property listed as existing structure
- HOA & community: No homeowners association
Exterior
- Parking: Driveway
- Utilities: Public water; Public sewer; Electric water heater; Natural gas available
- Home design: Single-story house; Residential, stick/site-built construction; Built in 1950; Entry and primary living areas on main level
- Construction: Vinyl siding; Crawl space foundation
- Exterior features: Public-maintained road; Public water; Public sewer; Lot approximately 0.33 acre; No pool; No guest house
Interior
- Kitchen: Kitchen on main level; Electric water heater
- Bedrooms: Bedrooms located on the main level
- Bathrooms: 1 full bathroom
- Heating & cooling: Central air conditioning; Forced air heating; Heat pump; Natural gas heating fuel
- Interior features: Primary bedroom located on the main level; Total of 5 rooms
- Laundry & utility: No separate basement; crawl space
Neighborhood map
What this means for you Summary
Snapshot
- This is a 3-bed/1.0-bath single-family listed at $155k.
Deal economics
- At list price, monthly cash flow is $156 ($2k/yr) — positive.
- The deal already cash-flows at list — no discount required.
- To meet the 1% rule (rent ≥ 1% of price), the offer needs to be $138k (10.7% below list).
- Recommended offer: $138k (10.7% below list) — sets the bar for 1% rule.
- Cap rate 7.5% vs local median 4.0% in High Point — top-decile yield for the area; either an underpriced asset or a hidden risk that comps aren't pricing in. Stress-test before assuming the spread holds.
Location & tenants
- Location reads 77/100 on livability (#31 in NC, #3,084 nationally) — a middle-class / working-renter tenant base. Strengths: commute A+, cost of living A+, housing A+; Watch: amenities D, employment D, crime F.
- Guilford County Schools (urban): math 39% / reading 45% proficiency, ranked #99 of 178 in NC (top 56%) — families likely to look elsewhere, expect single-tenant / working-renter base with shorter leases.
- Zoned schools: Johnson Street Global Studies (math 34% / reading 31%, grade F, #897 of 1,410 statewide, top 64%, 411 students, 97% FRL); Welborn Middle (math 11% / reading 29%, grade F, #429 of 475 statewide, top 91%, 419 students, 99% FRL); High Point Central High (math 48% / reading 42%, grade D-, #350 of 535 statewide, top 66%, 1,081 students, 100% FRL) — zoned schools average 99% FRL vs 52% district-wide (46 pts higher); higher-poverty schools than district average — tighter screening recommended.
- Market conditions: Rents flat; 124 active listings in the ZIP; 13 comparable units currently listed for rent nearby; rentals at typical pace (median 26d on market — plan ~3-4 weeks tenant-placement turnaround); 3,843 units permitted in Guilford County in 2024 (2,397 in 5+ unit buildings).
Forward outlook
- Local home prices are declining (-3.0%/yr); year-one equity from $1k of loan paydown is wiped out by about $5k of value loss. Plan a longer hold.
- Guilford County population projected at +26% by 2050 — long-run rental-demand tailwind backs the buy-and-hold thesis.
Negotiation context
- It's been on market 100 days — a 9% lower offer ($141k) is reasonable based on typical stale-listing flexibility.
- Current owner paid $49k; list at $155k implies a 216% gain — meaningful room to come down on a strong offer.
Risks & watch-outs
- Watch-outs: built in 1950 — expect roof / HVAC / electrical / plumbing capex.
- Climate carrying-cost: extreme-heat days projected 7→17/yr by 2055 (HVAC capex compounding) — expect insurance premiums to compound above CPI over the hold.
Questions for the listing agent
- It's been on market 100 days. Have you received any prior offers? Is the seller open to a 11% concession, seller financing, or rate buy-down credit?
- Built in 1950 — when were the roof, HVAC, electrical panel, plumbing, and water heater last replaced?
- Why hasn't it sold? Are there any deal-killer items the seller is aware of (foundation, flood, title, zoning, code violations)?
- Is there a deadline driving the sale (1031 exchange, divorce, estate, relocation)? That informs how much negotiation room exists.
- Schools are D-rated, which usually means shorter tenancies and higher turnover. Who's the typical renter profile here, and what's been the actual vacancy rate?
- Crime grade is F in this area — have there been break-ins, vandalism, or insurance claims at this property in the last 3 years? What carrier currently insures it and at what premium?
- What's the average days-on-market for RENTAL listings here right now (not sales)? A rising rental-DOM trend means longer vacancies and softer asking-rent achievability than the comps imply.
- What's the recent tenant-quality profile in this submarket — average credit score on applications, eviction rate, late-payment / NSF rate, and stable-employment percentage? A property-management company in the area should have these aggregated.
- How much new for-sale + rental construction is in the pipeline within 1–3 miles? Heavy new supply typically softens prices + rents 12–24 months out; constrained supply supports both.
Investment metrics
- 1% rule
- 0.89% ✗
- Cap rate
- 7.50%
- Cash-on-cash
- 4.32%
- DSCR
- 1.19
- GRM
- 9.3
CMA / ARV
- ARV (on-the-fly)
- $159,425
- Comps found
- 12
Show comp detail 12 sales within ~0.75 mi
| Address | Dist | Beds/Ba | Sqft | Sold | Price | $/sf | Match |
|---|---|---|---|---|---|---|---|
| 500 Avalon Pl | 0.31mi | 3/1.0 | 875 (-4%) | 10mo | $130,000 | $149 | 71 |
| 504 Avalon Pl | 0.32mi | 2/1.0 (-1) | 875 (-4%) | 7mo | $126,000 | $144 | 68 |
| 613 Woodridge Ln | 0.38mi | 3/1.0 | 1,031 (+13%) | 2mo | $152,000 | $147 | 58 |
| 626 State Ave | 0.36mi | 3/1.0 | 1,008 (+11%) | 9mo | $160,000 | $159 | 58 |
| 1123 Denny St | 0.75mi | 3/1.0 | 900 (-1%) | 11mo | $179,900 | $200 | 54 |
| 916 Forrest St | 0.71mi | 3/1.0 | 980 (+8%) | 2mo | $145,000 | $148 | 53 |
| 1004 Tabor St | 0.58mi | 2/1.0 (-1) | 952 (+4%) | 9mo | $170,000 | $179 | 53 |
| 910 E Dayton Ave | 0.69mi | 2/1.0 (-1) | 846 (-7%) | 3mo | $160,000 | $189 | 48 |
| 1406 Bridges Dr | 0.60mi | 2/1.0 (-1) | 830 (-9%) | 6mo | $130,000 | $157 | 48 |
| 1311 Cook St | 0.43mi | 2/1.0 (-1) | 798 (-12%) | 9mo | $140,000 | $175 | 47 |
| 315 Idol St | 0.64mi | 3/2.0 | 966 (+6%) | 13mo | $190,000 | $197 | 45 |
| 910 Charlotte Ave | 0.69mi | 2/1.0 (-1) | 834 (-8%) | 5mo | $162,500 | $195 | 44 |
Match score weights: distance 35% · size 25% · config 20% · recency 20%. Top-matched comps best support the ARV.
Projected returns pro-forma
-3.0% appreciation · 0.9% rent growth · sell at horizon
- IRR
- -11.7%
- Equity multiple
- 0.58×
- Total profit
- $-18,102
- Equity at exit
- $23,111
- IRR
- -5.6%
- Equity multiple
- 0.67×
- Total profit
- $-14,483
- Equity at exit
- $13,402
Cash invested: $43,400 (down + closing). Projections, not guarantees.
Landlord ↔ Tenant lean methodology
- Overall (STATE)
- 85 Strongly Landlord-Friendly
- State North Carolina
- 85 Strongly Landlord-Friendly · R+3
- County
- — inherits STATE
- City
- — inherits STATE
ZIP-level market 27262
- Rents YoY
- 0.9%
- Active inventory
- 124
- Price-to-rent
- 9.3×
Monthly cashflow live
- Estimated rent
- $1,384 high interval (Pro) →
- Mortgage (P&I)
- −$813
- Tax from tax record
- −$60 /mo · $721/yr
- Insurance
- −$65
- HOA
- −$0
- Vacancy / Maint / Mgmt
- −$291
- Net cashflow
- $156
Break-even live
Sensitivity live
| Price | -10% $244 | -5% $200 | +0% $156 | +5% $112 | +10% $68 |
|---|---|---|---|---|---|
| Rent | -10% $47 | -5% $101 | +0% $156 | +5% $211 | +10% $265 |
| Rate | -1.0pp $234 | -0.5pp $195 | base $156 | +0.5pp $116 | +1.0pp $75 |
UW: 25.0% down · 7.5% · 30yr · 1.5% tax · 5.0% vac · 8.0% maint · 8.0% mgmt
Financing live
Cash to close
- Down payment
- $38,750
- Closing costs
- $4,650
- Reserves months
- —
- Total cash needed
- —
Loan-product check · same deal, 3 products live
Conventional
25% down · 7.5% · 30yr
- Down + closing
- —
- Monthly P&I
- —
- Monthly cashflow
- —
- DSCR
- —
- Eligible?
- —
Personal DTI + credit; lowest rate.
DSCR
20% down · 8.5% · 30yr
- Down + closing
- —
- Monthly P&I
- —
- Monthly cashflow
- —
- DSCR
- —
- Eligible?
- —
No personal income docs; deal must DSCR.
Hard money
10% down · 12.0% · 12mo
- Down + closing
- —
- Monthly P&I
- —
- Monthly cashflow
- —
- DSCR
- —
- Eligible?
- —
Short-term bridge; refi at stabilization.
Rent comps 13 comps
| Address | Beds | Baths | Sqft | Rent | $/sqft | DOM | Units | Dist |
|---|---|---|---|---|---|---|---|---|
| 2120 Chester Ridge Dr High Point, NC | 1.0–3.0 | 1.0–2.0 | 1001 | $1,443 | $1.44 | 16d | 7 | 0.46mi |
| 704 E Lexington Ave High Point, NC | 2.0 | 1.0 | 984 | $1,495 | $1.52 | 23d | 1 | 0.50mi |
| 251 Northpoint Ave High Point, NC | 1.0–2.0 | 1.0 | 721 | $1,095 | $1.52 | 25d | 1 | 0.65mi |
| 829 Putnam St High Point, NC | 4.0 | 1.0 | 1013 | $1,695 | $1.67 | 25d | 1 | 0.66mi |
| 1910 Whitehall St High Point, NC | 3.0 | 1.0 | 925 | $1,095 | $1.18 | 25d | 1 | 0.72mi |
| 706 Westchester Dr High Point, NC | 1.0–3.0 | 1.0–2.0 | 1012 | $1,190 | $1.18 | 16d | 10 | 1.03mi |
| 177 W Hartley Dr High Point, NC | 1.0–2.0 | 1.0–2.0 | 818 | $1,218 | $1.49 | 16d | 8 | 1.23mi |
| 1533 Beaucrest Ave Unit B High Point, NC | 2.0 | 1.0 | 950 | $995 | $1.05 | 25d | 1 | 1.31mi |
| 419 Hobson St High Point, NC | 3.0 | 1.0 | 840 | $1,150 | $1.37 | 25d | 1 | 1.31mi |
| 313 4th St Unit B High Point, NC | 2.0 | 1.0 | 900 | $995 | $1.11 | 25d | 1 | 1.34mi |
| 856 Lakecrest Ave High Point, NC | 1.0–2.0 | 1.0–2.0 | 791 | $1,320 | $1.67 | 16d | 11 | 1.44mi |
| 928 Lakecrest Ave High Point, NC | 1.0–3.0 | 1.5 | 973 | $1,526 | $1.57 | 16d | 4 | 1.45mi |
| 511 Saunders Pl Unit B High Point, NC | 2.0 | 1.0 | 913 | $1,050 | $1.15 | 25d | 1 | 1.49mi |
Listing history 19 events
-
2026-06-22days on market $155,000 Active 100 DOM
-
2026-06-18days on market $155,000 Active 97 DOM
-
2026-06-17days on market $155,000 Active 96 DOM
-
2026-06-16days on market $155,000 Active 95 DOM
-
2026-06-15days on market $155,000 Active 94 DOM
-
2026-06-14days on market $155,000 Active 92 DOM
-
2026-06-10days on market $155,000 Active 89 DOM
-
2026-06-09days on market $155,000 Active 88 DOM
-
2026-06-08days on market $155,000 Active 87 DOM
-
2026-06-07days on market $155,000 Active 86 DOM
-
2026-06-03days on market $155,000 Active 82 DOM
-
2026-06-02days on market $155,000 Active 81 DOM
-
2026-06-01days on market $155,000 Active 80 DOM
-
2026-05-31days on market $155,000 Active 79 DOM
-
2026-05-31days on market $155,000 Active 78 DOM
-
2026-04-27price $155,000
-
2026-03-13$170,000 Active
-
2007-11-08soldstatus $49,000
-
2002-04-26soldstatus $33,000
ⓘ Source: listings_history table (triggers on properties + properties_extension) + one-shot
backfill from property_details.listing_events for pre-trigger history.
Tax reassessment forecast NC · Resets to sale price
- Current annual tax
- $721 · $60/mo
- Projected year-2 tax
- $1,271 · $106/mo
- Expected delta
- +$550/yr (+$46/mo · 76.4%)
ⓘ Screening estimate from a state-policy table — verify with the county assessor before closing.
Climate risk First Street
- Flood 1/10 Low FEMA zone X (unshaded) · 0% chance over 30 yrs
- Wildfire 1/10 Low
- Heat 5/10 Major 7 d/yr ≥104°F today · 17 d/yr by 30 yrs out
- Wind 4/10 Moderate 14% chance of damaging wind over 30 yrs
- Air quality 2/10 Low 1 unhealthy d/yr today · 1 by 30 yrs out
Nearby sold comps map
Loading sold comps map…
Walkable amenities ~0.75 mi
Loading nearby amenities…
Taxation est. · year 1
- Rental income
- $16,611
- − Mortgage interest
- −$8,682
- − Property taxes
- −$721
- − Insurance
- −$775
- − Repairs & maintenance
- −$1,329
- − Management
- −$1,329
- − Depreciation
- −$4,509
- Taxable loss
- −$734
- Est. tax savings @ 24.0%
- +$176
- After-tax cash flow
- $2,049/yr
For passive investors: Depreciation is non-cash, so a rental often shows a tax loss while cash-flowing — sheltering income. Rental losses are passive: they offset passive income freely, and up to $25,000/yr can offset ordinary (W-2) income if you actively participate and your MAGI is under $100k (phasing out to $0 by $150k); unused losses carry forward. On sale, claimed depreciation is recaptured at up to 25%, and gains may owe capital-gains tax (a 1031 exchange can defer both). Figures are a year-1 estimate at your 24.0% rate — not tax advice; consult a CPA.
Schools (NCES district)
- District
- Guilford County Schools
- NCES district ID
- 3701920
- Math proficiency
- 39% ▲ 1.00%
- Reading proficiency
- 45% ▲ 1.00%
- Median HH income
- $46,315
- Composite
- 35.78/100
- National rank
- #4842
- State rank
- #99 of 178 in NC
Livability — High Point
- Score
- 77/100
- State rank
- #31
- US rank
- #3084
Category grades
Schools grade is shown separately in the Schools card above.
Census & demographics
- Census place
- High Point, NC
- County
- Guilford County · 487,190 people
- City population
- 102,450
- Metro
- Greensboro-High Point, NC
- Population (ZIP)
- 28,353
- Household income
- $65,006
- Rent vs Own
- Severe rent burden
- 1046.0
Population outlook (Guilford County) Hauer SSP2
- Today (2025)
- 584,596 people
- By 2030
- 616,851 · +5.5%
- By 2040
- 678,451 · +16.1%
- By 2050
- 734,788 · +25.7%
- By 2075
- 862,985 · +47.6%
- By 2100
- 948,704 · +62.3%
Race, ethnicity, and origin ACS 2023
- Neighborhood character
- Diverse neighborhood (Simpson 0.65)
- Race & ethnicity
- White 50% Black 30% Hispanic / Latino 12% Two or more races 7% Asian 4%
- Hispanic origin (detail)
- Mexican 8% Puerto Rican 1%
- Common ancestry
- Slovak 4% Italian 2% Lithuanian 1%
- Foreign-born
- 14% · Canada
- Languages at home
- 80% English-only · Spanish 10% Other Indo-European 5% Other Asian/Pacific 1%
Political lean MEDSL · Guilford
- 2024 margin
- Strong D (+21.8) · D 60.2% · R 38.4% · Other 1.4%
- 2008→2024 swing
- +3.5pp toward D · 2008: 18.4pp · 2024: 21.8pp
- All cycles
- 2024: D+21.8 2020: D+23.1 2016: D+20.0 2012: D+16.5 2008: D+18.4
Not yet ingested
- Civics
- —
Market trends
- HPI YoY
- ▼ -279.14%
- Current HPI
- 205.6152
- Rent YoY
- ▲ 0.90%
- Metro
- Greensboro-High Point, NC
- State GDP YoY
- ▲ 3.28%
- F500 in state
- 26
Industry mix (Fortune 500 HQ in NC)
| Industry | F500 HQs | Revenue |
|---|---|---|
| Financial Services | 2 | $213B |
|
||
| Retail | 2 | $95B |
|
||
| Industrial Conglomerate | 1 | $38B |
|
||
| Metals / Steel | 1 | $35B |
|
||
| Utilities | 1 | $30B |
|
||
| Industrial Machinery | 1 | $19B |
|
||
Price history
+369.7% since first listed4 events — show timeline
- 2026-04-27 Price Changed $155,000 Triad MLS
- 2026-03-13 Listed $170,000 Triad MLS
- 2007-11-08 Sold (Public Records) $49,000 Public Records
- 2002-04-26 Sold (Public Records) $33,000 Public Records
Property tax history
+0.1%/yrLatest (2025): $721 · -0.8% YoY. Source: county tax records.
Cash-flow waterfall
monthlySold comps — $/sqft
last 12 mo · ≤1 miLoading sold comps…