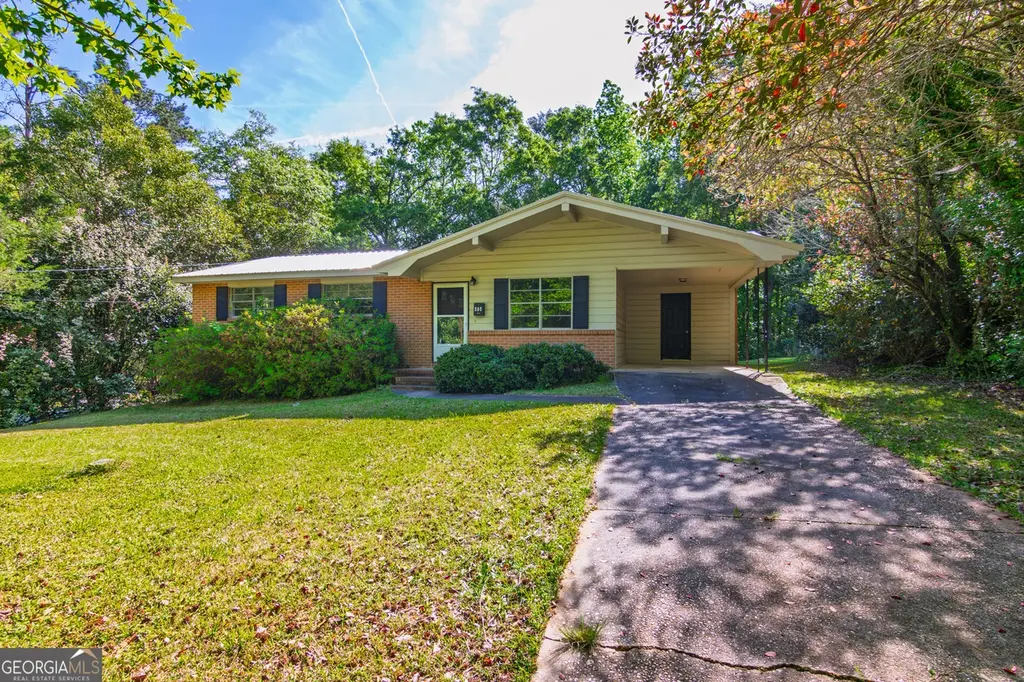
505 Chafin Dr · Manchester, GA
Flood risk 1/10 · Minimal
- FEMA flood zone
- X (unshaded)
- Chance of flooding over 30 yrs
- 0.0%
- Est. flood insurance / yr
- $507 – $1,088
Fire risk 3/10 · Minor
- Est. fire insurance / yr
- $963 – $1,789
Heat risk 6/10 · Moderate
- Hot days now (above 106°F)
- 7 days/yr
- Hot days in 30 yrs
- 19 days/yr
Wind risk 6/10 · Moderate
- Chance of severe wind over 30 yrs
- 62.0%
Air-quality risk 2/10 · Minimal
- Unhealthy air days now
- 2 days/yr
- Unhealthy air days in 30 yrs
- 2 days/yr
Risk factors via First Street. Map © Google.
Why this score? — see what drove the B- grade
The composite is a weighted blend of 9 inputs, each scored 0–100. Each bar is that input's sub-score; the figure is the points it added to the 100-point composite (weight × sub-score).
- Cash flow +26.9/30.0
- Appreciation +10.0/10.0
- DSCR +9.3/10.0
- 1% rule +7.2/10.0
- ARV discount +5.2/15.0
- Livability +2.8/5.0
- Rent growth +2.5/5.0
- Condition / age +2.5/5.0
- Schools +1.7/10.0
$122,900
🖨 Deal sheet 📄 Offer letter ✓ Due diligence
Listing remarks MLS
Charming brick home offering 3 bedrooms and 1.5 baths with 1,066 square feet of comfortable living space. Hardwood floors and fresh paint throughout. Master bedroom includes 2 closets and private half bath. The spacious laundry room is located just off the kitchen. French doors lead out to fenced-in backyard with relaxing patio area, and also includes a storage shed for added convenience. The roof was replaced last year and upgraded to metal. Situated on a corner lot on a quiet street, this home is within walking distance to Manchester's city pond and Harmon Field. Don't miss your chance to see this inviting home and make it your own!
Key facts
- Private half bath
- Storage shed
- Brick home
Tags
Neighborhood map
What this means for you Summary
Snapshot
- This is a 3-bed/1.5-bath single-family listed at $123k.
Deal economics
- At list price, monthly cash flow is $339 ($4k/yr) — positive.
- The deal already cash-flows at list — no discount required.
- Meets the 1% rule at list price ($2k rent vs $123k).
- Recommended offer: $119k (3.0% below list) — sets the bar for market timing.
- Cap rate 9.6% vs local median 5.1% in Manchester — top-decile yield for the area; either an underpriced asset or a hidden risk that comps aren't pricing in. Stress-test before assuming the spread holds.
Location & tenants
- Location reads 55/100 on livability (#525 in GA) — a working-class tenant base; expect higher turnover. Strengths: cost of living A+, housing A+; Watch: schools F, crime D-, amenities F.
- Meriwether County (rural): math 18% / reading 22% proficiency, ranked #144 of 174 in GA (top 83%) — low school quality limits family demand, transient renter base, plan for 1-2y turnover; 71% free/reduced lunch — lower-income household profile, screen leases tightly.
- Market conditions: 45 active listings in the ZIP; 180 units permitted in Meriwether County in 2024 (0 in 5+ unit buildings).
Forward outlook
- In year one you build about $13k of equity ($850 loan paydown + $12k appreciation (10.0% local appreciation)).
- Meriwether County population projected at -28% by 2050 — secular population decline; favor cash flow + early exit over multi-decade hold.
- At projected returns (10.0% appreciation + 3.0% rent growth), your $34k cash investment doubles in ~2 years — after that, you're playing with house money.
- By year 3, paydown + projected appreciation supports a ~$33k cash-out refi (75% LTV) — recoverable capital for the next deal without selling this one.
Negotiation context
- It's been on market 40 days — a 3% lower offer ($119k) is reasonable based on typical stale-listing flexibility.
- 6 sale attempts since 14y ago with the ask held roughly flat each time — persistent listings suggest the price (not the market) is what's stuck; bring a comps-based counter.
- Current owner paid $82k; 49% above their basis — modest negotiation headroom, anchor on the comps not their cost.
Risks & watch-outs
- Climate carrying-cost: major wind risk, 62% chance of damaging wind over 30y; extreme-heat days projected 7→19/yr by 2055 (HVAC capex compounding) — expect insurance premiums to compound above CPI over the hold.
Questions for the listing agent
- It's been on market 40 days. Have you received any prior offers? Is the seller open to a 3% concession, seller financing, or rate buy-down credit?
- Built in 1965 — when were the roof, HVAC, electrical panel, plumbing, and water heater last replaced?
- Is there a deadline driving the sale (1031 exchange, divorce, estate, relocation)? That informs how much negotiation room exists.
- Schools are F-rated, which usually means shorter tenancies and higher turnover. Who's the typical renter profile here, and what's been the actual vacancy rate?
- Crime grade is D in this area — have there been break-ins, vandalism, or insurance claims at this property in the last 3 years? What carrier currently insures it and at what premium?
- What's the average days-on-market for RENTAL listings here right now (not sales)? A rising rental-DOM trend means longer vacancies and softer asking-rent achievability than the comps imply.
- What's the recent tenant-quality profile in this submarket — average credit score on applications, eviction rate, late-payment / NSF rate, and stable-employment percentage? A property-management company in the area should have these aggregated.
- How much new for-sale + rental construction is in the pipeline within 1–3 miles? Heavy new supply typically softens prices + rents 12–24 months out; constrained supply supports both.
Investment metrics
- 1% rule
- 1.22% ✓
- Cap rate
- 9.61%
- Cash-on-cash
- 11.83%
- DSCR
- 1.53
- GRM
- 6.8
CMA / ARV
- ARV (median comp)
- $116,870
- List price
- $122,900
- Delta
- 5.16%
- Verdict
- FAIR
- Comps
- 20 within 1.0 mi
Show comp detail 7 sales within ~0.75 mi
| Address | Dist | Beds/Ba | Sqft | Sold | Price | $/sf | Match |
|---|---|---|---|---|---|---|---|
| 506 Webster Dr | 0.14mi | 3/1.5 | 1,107 (+4%) | 10mo | $160,500 | $145 | 78 |
| 526 4th Street Ext | 0.12mi | 2/1.0 (-1) | 1,090 (+2%) | 10mo | $116,000 | $106 | 75 |
| 403 Broxton Ln | 0.51mi | 3/1.0 | 1,092 (+2%) | 2mo | $159,900 | $146 | 69 |
| 815 Mccurdy Blvd | 0.50mi | 2/1.5 (-1) | 1,075 (+1%) | 3mo | $170,000 | $158 | 68 |
| 518 S 5th Ave | 0.12mi | 2/1.5 (-1) | 1,121 (+5%) | 18mo | $68,250 | $61 | 66 |
| 307 3rd Ave | 0.36mi | 2/1.0 (-1) | 1,000 (-6%) | 0mo | $78,000 | $78 | 65 |
| 922 Linda Ln | 0.74mi | 3/2.0 | 1,148 (+8%) | 3mo | $84,500 | $74 | 48 |
Match score weights: distance 35% · size 25% · config 20% · recency 20%. Top-matched comps best support the ARV.
Projected returns pro-forma
10.0% appreciation · 3.0% rent growth · sell at horizon
- IRR
- 33.0%
- Equity multiple
- 3.57×
- Total profit
- $88,561
- Equity at exit
- $110,718
- IRR
- 28.4%
- Equity multiple
- 8.09×
- Total profit
- $243,850
- Equity at exit
- $238,768
Cash invested: $34,412 (down + closing). Projections, not guarantees.
Landlord ↔ Tenant lean methodology
- Overall (STATE)
- 90 Strongly Landlord-Friendly
- State Georgia
- 90 Strongly Landlord-Friendly · R+3
- County
- — inherits STATE
- City
- — inherits STATE
ZIP-level market 31816
- Home prices YoY
- 8.7%
- Active inventory
- 45
- Price-to-rent
- 6.8×
Monthly cashflow live
- Estimated rent
- $1,502 medium interval (Pro) →
- Mortgage (P&I)
- −$645
- Tax from tax record
- −$151 /mo · $1,817/yr
- Insurance
- −$51
- HOA
- −$0
- Vacancy / Maint / Mgmt
- −$315
- Net cashflow
- $339
Break-even live
UW: 25.0% down · 7.5% · 30yr · 1.5% tax · 5.0% vac · 8.0% maint · 8.0% mgmt
Financing live
Cash to close
- Down payment
- $30,725
- Closing costs
- $3,687
- Reserves months
- —
- Total cash needed
- —
Loan-product check · same deal, 3 products live
Conventional
25% down · 7.5% · 30yr
- Down + closing
- —
- Monthly P&I
- —
- Monthly cashflow
- —
- DSCR
- —
- Eligible?
- —
Personal DTI + credit; lowest rate.
DSCR
20% down · 8.5% · 30yr
- Down + closing
- —
- Monthly P&I
- —
- Monthly cashflow
- —
- DSCR
- —
- Eligible?
- —
No personal income docs; deal must DSCR.
Hard money
10% down · 12.0% · 12mo
- Down + closing
- —
- Monthly P&I
- —
- Monthly cashflow
- —
- DSCR
- —
- Eligible?
- —
Short-term bridge; refi at stabilization.
Listing history 21 events
-
2026-06-02days on market $122,900 Active 40 DOM
-
2026-06-01days on market $122,900 Active 39 DOM
-
2026-05-31days on market $122,900 Active 38 DOM
-
2026-05-30statusdays on market $122,900 Active 37 DOM
-
2026-04-13$122,900 Active 642-char remark
Show marketing remark (642 chars)
Charming brick home offering 3 bedrooms and 1.5 baths with 1,066 square feet of comfortable living space. Hardwood floors and fresh paint throughout. Master bedroom includes 2 closets and private half bath. The spacious laundry room is located just off the kitchen. French doors lead out to fenced-in backyard with relaxing patio area, and also includes a storage shed for added convenience. The roof was replaced last year and upgraded to metal. Situated on a corner lot on a quiet street, this home is within walking distance to Manchester's city pond and Harmon Field. Don't miss your chance to see this inviting home and make it your own!
-
2026-04-13$122,900 New 642-char remark
Show marketing remark (642 chars)
Charming brick home offering 3 bedrooms and 1.5 baths with 1,066 square feet of comfortable living space. Hardwood floors and fresh paint throughout. Master bedroom includes 2 closets and private half bath. The spacious laundry room is located just off the kitchen. French doors lead out to fenced-in backyard with relaxing patio area, and also includes a storage shed for added convenience. The roof was replaced last year and upgraded to metal. Situated on a corner lot on a quiet street, this home is within walking distance to Manchester's city pond and Harmon Field. Don't miss your chance to see this inviting home and make it your own!
-
2021-03-18soldstatus $82,400
-
2021-03-10soldstatus $82,400 Sold
-
2021-03-10soldstatus $82,400
-
2021-01-21status Under Contract
-
2021-01-13status Back on Market
-
2020-12-29historical
-
2020-12-22price $80,000
-
2020-11-06$89,900 New
-
2020-11-06$80,000
-
2014-06-17price $41,500
-
2013-07-26soldstatus $41,500 Sold
-
2013-05-16status Under Contract
-
2013-05-16price $47,000
-
2013-03-13price $47,000 Reduced
-
2012-09-14$69,900 New
ⓘ Source: listings_history table (triggers on properties + properties_extension) + one-shot
backfill from property_details.listing_events for pre-trigger history.
Tax reassessment forecast GA · Resets to sale price
- Current annual tax
- $1,817 · $151/mo
- Projected year-2 tax
- $1,817 · $151/mo
- Expected delta
- $0/yr ($0/mo · 0.0%)
ⓘ Screening estimate from a state-policy table — verify with the county assessor before closing.
Climate risk First Street
- Flood 1/10 Low FEMA zone X (unshaded) · 0% chance over 30 yrs
- Wildfire 3/10 Moderate
- Heat 6/10 Major 7 d/yr ≥106°F today · 19 d/yr by 30 yrs out
- Wind 6/10 Major 62% chance of damaging wind over 30 yrs
- Air quality 2/10 Low 2 unhealthy d/yr today · 2 by 30 yrs out
Nearby sold comps map
Loading sold comps map…
Walkable amenities ~0.75 mi
Loading nearby amenities…
Taxation est. · year 1
- Rental income
- $18,021
- − Mortgage interest
- −$6,884
- − Property taxes
- −$1,817
- − Insurance
- −$614
- − Repairs & maintenance
- −$1,442
- − Management
- −$1,442
- − Depreciation
- −$3,575
- Taxable income
- $2,246
- Est. tax owed @ 24.0%
- −$539
- After-tax cash flow
- $3,532/yr
For passive investors: Depreciation is non-cash, so a rental often shows a tax loss while cash-flowing — sheltering income. Rental losses are passive: they offset passive income freely, and up to $25,000/yr can offset ordinary (W-2) income if you actively participate and your MAGI is under $100k (phasing out to $0 by $150k); unused losses carry forward. On sale, claimed depreciation is recaptured at up to 25%, and gains may owe capital-gains tax (a 1031 exchange can defer both). Figures are a year-1 estimate at your 24.0% rate — not tax advice; consult a CPA.
Schools (NCES district)
- District
- Meriwether County
- NCES district ID
- 1303630
- Math proficiency
- 18% ▼ -11.00%
- Reading proficiency
- 22% ▼ -6.00%
- Median HH income
- $36,287
- Composite
- 16.59/100
- National rank
- #9175
- State rank
- #144 of 174 in GA
Livability — Manchester
- Score
- 55/100
- State rank
- #525
- US rank
- #23555
Category grades
Schools grade is shown separately in the Schools card above.
Census & demographics
- Census place
- Manchester, GA
- Population (ZIP)
- 4,872
Population outlook (Meriwether County) Hauer SSP2
- Today (2025)
- 19,554 people
- By 2030
- 18,482 · -5.5%
- By 2040
- 16,204 · -17.1%
- By 2050
- 14,030 · -28.2%
- By 2075
- 9,539 · -51.2%
- By 2100
- 6,136 · -68.6%
Race, ethnicity, and origin ACS 2023
- Race & ethnicity
- Black 49% White 48% Two or more races 2%
- Common ancestry
- Portuguese 1% Italian 1% Slovak 1%
- Foreign-born
- 0%
Political lean MEDSL · Meriwether
- 2024 margin
- Strong R (+25.5) · D 37.1% · R 62.6%
- 2008→2024 swing
- -20.0pp toward R · 2008: -5.4pp · 2024: -25.5pp
- All cycles
- 2024: R+25.5 2020: R+20.6 2016: R+15.4 2012: R+5.7 2008: R+5.4
Not yet ingested
- Civics
- —
Market trends
- HPI YoY
- ▲ 23.75%
- Current HPI
- 298.3716
- Rent YoY
- —
- Metro
- —
- State GDP YoY
- ▲ 2.66%
- F500 in state
- 28
Industry mix (Fortune 500 HQ in GA)
| Industry | F500 HQs | Revenue |
|---|---|---|
| Paper / Packaging | 2 | $29B |
|
||
| Retail | 1 | $160B |
|
||
| Transportation / Logistics | 1 | $91B |
|
||
| Airlines | 1 | $62B |
|
||
| Consumer Goods | 1 | $47B |
|
||
| Utilities | 1 | $25B |
|
||
Price history
+75.8% since first listed17 events — show timeline
- 2026-04-13 Listed $122,900 CBOR
- 2026-04-13 Listed $122,900 GAMLS
- 2021-03-18 Sold (Public Records) $82,400 Public Records
- 2021-03-10 Sold (MLS) $82,400 CBOR
- 2021-03-10 Sold (MLS) $82,400 GAMLS
- 2021-01-21 Pending — GAMLS
- 2021-01-13 Relisted — GAMLS
- 2020-12-29 Listing Removed — GAMLS
- 2020-12-22 Price Changed $80,000 GAMLS
- 2020-11-06 Listed $80,000 CBOR
- 2020-11-06 Listed $89,900 GAMLS
- 2014-06-17 Price Changed $41,500 GAMLS
- 2013-07-26 Sold (MLS) $41,500 GAMLS
- 2013-05-16 Pending — GAMLS
- 2013-05-16 Price Changed $47,000 GAMLS
- 2013-03-13 Price Changed $47,000 GAMLS
- 2012-09-14 Listed $69,900 GAMLS
Property tax history
+11.5%/yrLatest (2025): $1,817 · +1.0% YoY. Source: county tax records.
Cash-flow waterfall
monthlySold comps — $/sqft
last 12 mo · ≤1 miLoading sold comps…