 Multi-family
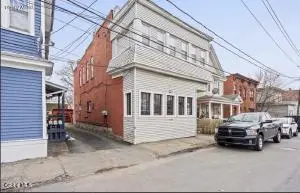
None · Amsterdam, NY
Flood risk 1/10 · Minimal
- FEMA flood zone
- X (unshaded)
- Chance of flooding over 30 yrs
- 0.0%
- Est. flood insurance / yr
- $473 – $860
Fire risk 3/10 · Minor
- Est. fire insurance / yr
- $691 – $1,283
Heat risk 3/10 · Minor
- Hot days now (above 95°F)
- 7 days/yr
- Hot days in 30 yrs
- 16 days/yr
Wind risk 2/10 · Minimal
- Chance of severe wind over 30 yrs
- 4.0%
Air-quality risk 1/10 · Minimal
- Unhealthy air days now
- 0 days/yr
- Unhealthy air days in 30 yrs
- 0 days/yr
Risk factors via First Street. Map © Google.
Why this score? — see what drove the A grade
The composite is a weighted blend of 9 inputs, each scored 0–100. Each bar is that input's sub-score; the figure is the points it added to the 100-point composite (weight × sub-score).
- Cash flow +30.0/30.0
- ARV discount +15.0/15.0
- 1% rule +10.0/10.0
- DSCR +10.0/10.0
- Appreciation +10.0/10.0
- Livability +3.8/5.0
- Schools +3.2/10.0
- Rent growth +2.5/5.0
- Condition / age +2.2/5.0
$119,900
🖨 Deal sheet 📄 Offer letter ✓ Due diligence
Multi-family units
County records classify this as Multi-Family (2-4 Unit). Listing-text estimate: 1 unit. estimate disagrees with records
Listing remarks
This two-unit property has solid investor potential. The first floor unit offers a 1-bedroom layout plus an additional room currently used as a utility space which could potentially be reworked for a 2nd bedroom or another use. The second floor unit features 2 bedrooms plus additional storage space. The layout is functional and the property offers an opportunity for someone looking for an affordable two-unit in the City of Amsterdam. Conveniently located near all the shopping, dining, and local roadways.
Key facts
- Affordable two-unit
- Utility space
- Conveniently located
Tags
Neighborhood map
What this means for you Summary
Snapshot
- This is a 4-bed/2.0-bath multifamily listed at $120k. Condition is rated fair.
Deal economics
- At list price, monthly cash flow is $1k ($16k/yr) — positive.
- The deal already cash-flows at list — no discount required.
- Meets the 1% rule at list price ($3k rent vs $120k).
- Cap rate 19.9% vs local median 6.3% in Amsterdam — top-decile yield for the area; either an underpriced asset or a hidden risk that comps aren't pricing in. Stress-test before assuming the spread holds.
Location & tenants
- Location reads 75/100 on livability (#247 in NY, #3,884 nationally) — a middle-class / working-renter tenant base. Strengths: cost of living A+, housing A+, health & safety A+; Watch: crime F, employment F.
- Amsterdam City School District (town): math 35% / reading 41% proficiency, ranked #546 of 590 in NY (top 92%) — families likely to look elsewhere, expect single-tenant / working-renter base with shorter leases.
- Zoned schools: Amsterdam High School (math 75% / reading 82%, grade A-, #563 of 1,100 statewide, top 52%, 1,179 students, 68% FRL) — zoned schools average 68% FRL vs 40% district-wide (28 pts higher); higher-poverty schools than district average — tighter screening recommended.
- Zoned-school proficiency averages 78% at this address vs 38% district-wide (+40 pts) — the actual schools serving this property are materially stronger than the Amsterdam City School District average implies; a family-tenant draw the district grade alone would hide.
- Market conditions: 164 active listings in the ZIP; 1 comparable units currently listed for rent nearby; 210 units permitted in Montgomery County in 2024 (168 in 5+ unit buildings).
Forward outlook
- In year one you build about $13k of equity ($829 loan paydown + $12k appreciation (10.0% local appreciation)).
- Montgomery County population projected at -11% by 2050 — secular population decline; favor cash flow + early exit over multi-decade hold.
- At projected returns (10.0% appreciation + 3.0% rent growth), your $34k cash investment doubles in ~2 years — after that, you're playing with house money.
- By year 3, paydown + projected appreciation supports a ~$32k cash-out refi (75% LTV) — recoverable capital for the next deal without selling this one.
Negotiation context
- Only 10 days on market — expect competitive offers; lowballing is unlikely to land.
Risks & watch-outs
- Watch-outs: built in 1880 — expect roof / HVAC / electrical / plumbing capex.
Questions for the listing agent
- Have any recent inspections been done? Can we get a copy of the seller's disclosures and any deferred-maintenance estimates?
- Built in 1880 — when were the roof, HVAC, electrical panel, plumbing, and water heater last replaced?
- Is there a deadline driving the sale (1031 exchange, divorce, estate, relocation)? That informs how much negotiation room exists.
- Schools are D-rated, which usually means shorter tenancies and higher turnover. Who's the typical renter profile here, and what's been the actual vacancy rate?
- Crime grade is F in this area — have there been break-ins, vandalism, or insurance claims at this property in the last 3 years? What carrier currently insures it and at what premium?
- What's the average days-on-market for RENTAL listings here right now (not sales)? A rising rental-DOM trend means longer vacancies and softer asking-rent achievability than the comps imply.
- What's the recent tenant-quality profile in this submarket — average credit score on applications, eviction rate, late-payment / NSF rate, and stable-employment percentage? A property-management company in the area should have these aggregated.
- How much new apartment / multifamily construction is in the pipeline within 1–3 miles? Heavy new supply (>2% of stock underway) typically softens rents 12–24 months out; light construction supports rent growth.
Investment metrics
- 1% rule
- 2.31% ✓
- Cap rate
- 19.93%
- Cash-on-cash
- 48.71%
- DSCR
- 3.17
- GRM
- 3.6
CMA / ARV
- ARV (on-the-fly)
- $204,102
- Comps found
- 10
Show comp detail 10 sales within ~0.75 mi
| Address | Dist | Beds/Ba | Sqft | Sold | Price | $/sf | Match |
|---|---|---|---|---|---|---|---|
| 22 1/2 Reid St | 0.00mi | 4/2.0 | 2,346 (0%) | 1mo | $130,000 | $55 | 99 |
| 17-19 Brookside Ave | 0.47mi | 5/2.0 (+1) | 2,400 (+2%) | 2mo | $135,000 | $56 | 68 |
| 28 Gorski St | 0.47mi | 5/2.0 (+1) | 2,388 (+2%) | 7mo | $271,000 | $113 | 64 |
| 20 Milton Ave | 0.43mi | 4/2.0 | 2,286 (-3%) | 18mo | $128,000 | $56 | 60 |
| 280 Church St | 0.65mi | 4/2.0 | 2,132 (-9%) | 2mo | $185,000 | $87 | 53 |
| 35 Locust Ave | 0.47mi | 5/3.0 (+1) | 2,496 (+6%) | 10mo | $232,800 | $93 | 50 |
| 30 High St | 0.41mi | 5/2.0 (+1) | 2,184 (-7%) | 17mo | $200,000 | $92 | 50 |
| 50 Gorski St | 0.52mi | 4/2.0 | 2,160 (-8%) | 23mo | $227,000 | $105 | 43 |
| 2 De Graff St | 0.52mi | 5/2.0 (+1) | 2,160 (-8%) | 19mo | $100,000 | $46 | 42 |
| 249 Forest Ave | 0.67mi | 5/3.0 (+1) | 2,590 (+10%) | 13mo | $175,000 | $68 | 31 |
Match score weights: distance 35% · size 25% · config 20% · recency 20%. Top-matched comps best support the ARV.
Projected returns pro-forma
10.0% appreciation · 3.0% rent growth · sell at horizon
- IRR
- 62.5%
- Equity multiple
- 5.53×
- Total profit
- $152,144
- Equity at exit
- $108,015
- IRR
- 56.1%
- Equity multiple
- 12.31×
- Total profit
- $379,862
- Equity at exit
- $232,939
Cash invested: $33,572 (down + closing). Projections, not guarantees.
Landlord ↔ Tenant lean methodology
- Overall (STATE)
- 15 Strongly Tenant-Friendly
- State New York
- 15 Strongly Tenant-Friendly · D+10
- County
- — inherits STATE
- City
- — inherits STATE
ZIP-level market 12010
- Home prices YoY
- 4.0%
- Active inventory
- 164
- Price-to-rent
- 7.4×
Monthly cashflow live
- Estimated rent
- $2,774 medium interval (Pro) →
- Mortgage (P&I)
- −$629
- Tax est. 1.5%
- −$150 /mo · $1,798/yr
- Insurance
- −$50
- HOA
- −$0
- Vacancy / Maint / Mgmt
- −$583
- Net cashflow
- $1,363
Break-even live
2-unit breakdown (identical units grouped — click to expand)
| Units | Beds | Baths | Est. rent |
|---|---|---|---|
| 1× unit | 1 | 1 | $1,357 |
| 1× unit | 2 | 1 | $1,417 |
| Total (2 units) | $2,774 | ||
UW: 25.0% down · 7.5% · 30yr · 1.5% tax · 5.0% vac · 8.0% maint · 8.0% mgmt
Financing live
Cash to close
- Down payment
- $29,975
- Closing costs
- $3,597
- Reserves months
- —
- Total cash needed
- —
Loan-product check · same deal, 3 products live
Conventional
25% down · 7.5% · 30yr
- Down + closing
- —
- Monthly P&I
- —
- Monthly cashflow
- —
- DSCR
- —
- Eligible?
- —
Personal DTI + credit; lowest rate.
DSCR
20% down · 8.5% · 30yr
- Down + closing
- —
- Monthly P&I
- —
- Monthly cashflow
- —
- DSCR
- —
- Eligible?
- —
No personal income docs; deal must DSCR.
Hard money
10% down · 12.0% · 12mo
- Down + closing
- —
- Monthly P&I
- —
- Monthly cashflow
- —
- DSCR
- —
- Eligible?
- —
Short-term bridge; refi at stabilization.
Rent comps 1 comps
| Address | Beds | Baths | Sqft | Rent | $/sqft | DOM | Units | Dist |
|---|---|---|---|---|---|---|---|---|
| 16 Stewart St Unit 2 Amsterdam, NY | 4.0 | 1.0 | 2800 | $1,650 | $0.59 | 43d | 1 | 1.41mi |
Listing history 2 events
-
2026-04-23status Pending
-
2026-04-13$119,900 Active
ⓘ Source: listings_history table (triggers on properties + properties_extension) + one-shot
backfill from property_details.listing_events for pre-trigger history.
Climate risk First Street
- Flood 1/10 Low FEMA zone X (unshaded) · 0% chance over 30 yrs
- Wildfire 3/10 Moderate
- Heat 3/10 Moderate 7 d/yr ≥95°F today · 16 d/yr by 30 yrs out
- Wind 2/10 Low 4% chance of damaging wind over 30 yrs
- Air quality 1/10 Low 0 unhealthy d/yr today · 0 by 30 yrs out
Nearby sold comps map
Loading sold comps map…
Walkable amenities ~0.75 mi
Loading nearby amenities…
Taxation est. · year 1
- Rental income
- $33,288
- − Mortgage interest
- −$6,716
- − Property taxes
- −$1,798
- − Insurance
- −$600
- − Repairs & maintenance
- −$2,663
- − Management
- −$2,663
- − Depreciation
- −$3,488
- Taxable income
- $15,360
- Est. tax owed @ 24.0%
- −$3,686
- After-tax cash flow
- $12,668/yr
For passive investors: Depreciation is non-cash, so a rental often shows a tax loss while cash-flowing — sheltering income. Rental losses are passive: they offset passive income freely, and up to $25,000/yr can offset ordinary (W-2) income if you actively participate and your MAGI is under $100k (phasing out to $0 by $150k); unused losses carry forward. On sale, claimed depreciation is recaptured at up to 25%, and gains may owe capital-gains tax (a 1031 exchange can defer both). Figures are a year-1 estimate at your 24.0% rate — not tax advice; consult a CPA.
Condition & rehab AI · 12 photos
This two-unit property requires significant updates to its exterior, interior, and landscaping to improve its condition and value. The property has solid investor potential and offers an opportunity for an affordable two-unit in the City of Amsterdam.
Repairs flagged
- Major exterior siding — Significant wear and tear
- Major interior walls/paint — Worn paint and outdated decor
- Major flooring — Worn carpet and outdated flooring
- Major kitchen cabinets — Outdated cabinets
- Major bathroom fixtures — Outdated fixtures
- Major landscaping — Overgrown yard
Value-add opportunities
- Both exterior siding — Enhances curb appeal and value
- Both interior walls/paint — Updates interior and enhances value
- Both flooring — Updates flooring and enhances value
- Both kitchen cabinets — Updates kitchen and enhances value
- Both bathroom fixtures — Updates bathrooms and enhances value
- Both landscaping — Enhances curb appeal and value
Renovation cost estimate screening
| Repair item | Severity | Est. cost |
|---|---|---|
| exterior siding · Significant wear and tear | Major | $15,000–50,000 |
| interior walls/paint · Worn paint and outdated decor | Major | $15,000–50,000 |
| flooring · Worn carpet and outdated flooring | Major | $15,000–50,000 |
| kitchen cabinets · Outdated cabinets | Major | $15,000–50,000 |
| bathroom fixtures · Outdated fixtures | Major | $15,000–50,000 |
| landscaping · Overgrown yard | Major | $15,000–50,000 |
| Total estimated repair cost · 6 items | $90,000–300,000 |
Value-add ROI direction
- Both exterior siding — Enhances curb appeal and value ↑
- Both interior walls/paint — Updates interior and enhances value ↑
- Both flooring — Updates flooring and enhances value ↑
- Both kitchen cabinets — Updates kitchen and enhances value ↑
- Both bathroom fixtures — Updates bathrooms and enhances value ↑
- Both landscaping — Enhances curb appeal and value ↑
ⓘ Cost ranges are severity-bucket heuristics (US national rule-of-thumb). Get contractor quotes + a written scope before underwriting a rehab budget.
Schools (NCES district)
- District
- Amsterdam City School District
- NCES district ID
- 3602970
- Math proficiency
- 35% ▲ 5.00%
- Reading proficiency
- 41% ▲ 10.00%
- Median HH income
- $41,735
- Composite
- 32.03/100
- National rank
- #5824
- State rank
- #546 of 590 in NY
Livability — Amsterdam
- Score
- 75/100
- State rank
- #247
- US rank
- #3884
Category grades
Schools grade is shown separately in the Schools card above.
Census & demographics
- Census place
- Amsterdam, NY
- City population
- 27,339
- Population (ZIP)
- 27,339
Population outlook (Montgomery County) Hauer SSP2
- Today (2025)
- 48,683 people
- By 2030
- 47,785 · -1.8%
- By 2040
- 45,492 · -6.6%
- By 2050
- 43,161 · -11.3%
- By 2075
- 38,134 · -21.7%
- By 2100
- 32,337 · -33.6%
Race, ethnicity, and origin ACS 2023
- Neighborhood character
- Predominantly White (68%)
- Race & ethnicity
- White 68% Hispanic / Latino 23% Two or more races 9% Black 4% Asian 1%
- Hispanic origin (detail)
- Mexican 2% Puerto Rican 18%
- Common ancestry
- Romanian 12% Lithuanian 2% Iranian 2%
- Foreign-born
- 5% · Canada
- Languages at home
- 86% English-only · Spanish 11% Russian/Polish/Slavic 1% Other Indo-European 1%
Political lean MEDSL · Montgomery
- 2024 margin
- Strong R (+28.7) · D 35.6% · R 64.4%
- 2008→2024 swing
- -20.6pp toward R · 2008: -8.1pp · 2024: -28.7pp
- All cycles
- 2024: R+28.7 2020: R+22.6 2016: R+26.5 2012: R+4.4 2008: R+8.1
Not yet ingested
- Civics
- —
Market trends
- HPI YoY
- ▲ 12.12%
- Current HPI
- 312.4966
- Rent YoY
- —
- Metro
- —
- State GDP YoY
- ▲ 2.60%
- F500 in state
- 92
Industry mix (Fortune 500 HQ in NY)
| Industry | F500 HQs | Revenue |
|---|---|---|
| Financial Services | 10 | $950B |
|
||
| Consumer Goods | 9 | $162B |
|
||
| Insurance | 4 | $225B |
|
||
| Telecommunications | 2 | $144B |
|
||
| Pharmaceuticals | 2 | $112B |
|
||
| Media / Entertainment | 2 | $69B |
|
||
Price history
2 events — show timeline
- 2026-04-23 Pending — Global MLS
- 2026-04-13 Listed $119,900 Global MLS
Cash-flow waterfall
monthlySold comps — $/sqft
last 12 mo · ≤1 miLoading sold comps…