 🏷️ Likely Rental
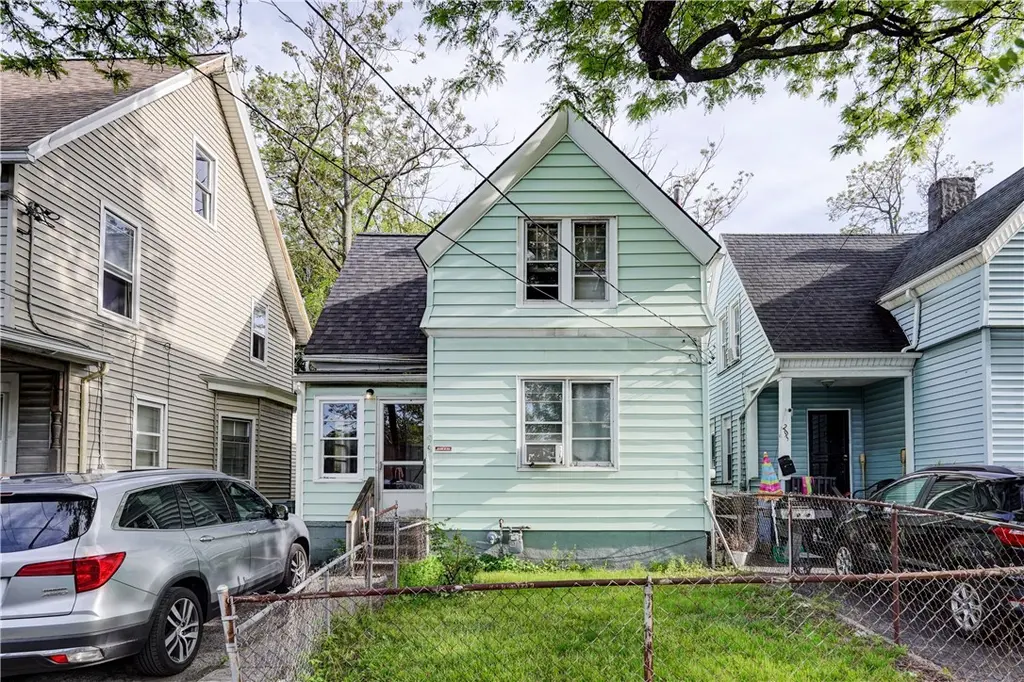
199 Wilder St · Rochester, NY
Flood risk 1/10 · Minimal
- FEMA flood zone
- X (unshaded)
- Chance of flooding over 30 yrs
- 0.0%
- Est. flood insurance / yr
- $473 – $860
Fire risk 1/10 · Minimal
- Est. fire insurance / yr
- $691 – $1,283
Heat risk 2/10 · Minimal
- Hot days now (above 95°F)
- 7 days/yr
- Hot days in 30 yrs
- 15 days/yr
Wind risk 1/10 · Minimal
- Chance of severe wind over 30 yrs
- —
Air-quality risk 2/10 · Minimal
- Unhealthy air days now
- 1 days/yr
- Unhealthy air days in 30 yrs
- 2 days/yr
Risk factors via First Street. Map © Google.
Why this score? — see what drove the D+ grade
The composite is a weighted blend of 9 inputs, each scored 0–100. Each bar is that input's sub-score; the figure is the points it added to the 100-point composite (weight × sub-score).
- Cash flow +15.0/30.0
- ARV discount +7.5/15.0
- 1% rule +5.0/10.0
- DSCR +5.0/10.0
- Rent growth +4.1/5.0
- Livability +3.8/5.0
- Appreciation +3.5/10.0
- Condition / age +2.5/5.0
- Schools +1.9/10.0
$40,000
🖨 Deal sheet 📄 Offer letter ✓ Due diligence
Listing remarks MLS
Single Family House with lots of character and tons of potential. Make ready/cosmetics needed, some plumbing missing. Asking price reflects repairs needed. Property Management in place. Prior tenant paid $795.00 per month. "As Is"
Key facts
- 2,800 sq ft lot
- Parking
- Built 1868
Property features AI
Exterior
- Parking: No garage; Driveway parking
- Utilities: Electricity connected; Sewer connected; Public water connected
- Home design: Single-story; Resale property
- Construction: Vinyl siding; Asphalt roof; Block foundation; Existing construction
- Exterior features: Blacktop driveway; Enclosed porch; Porch; Rectangular lot; 28 x 100 lot dimensions; Main thoroughfare frontage
Interior
- Kitchen: Appliances negotiable
- Bedrooms: 8 total rooms (includes living and laundry areas)
- Flooring: Hardwood; Laminate; Tile; Varies
- Bathrooms: 1 full bathroom
- Heating & cooling: Gas heating; Radiant heat
- Interior features: Separate/formal dining room; Eat-in kitchen; Separate/formal living room; Full basement
- Laundry & utility: Main-level laundry
Neighborhood map
What this means for you Summary
Snapshot
- This is a 3-bed/1.0-bath single-family listed at $40k.
Deal economics
- At list price, monthly cash flow is $1k ($13k/yr) — positive.
- The deal already cash-flows at list — no discount required.
- Meets the 1% rule at list price ($2k rent vs $40k).
- Cap rate 38.1% vs local median 9.3% in Rochester — top-decile yield for the area; either an underpriced asset or a hidden risk that comps aren't pricing in. Stress-test before assuming the spread holds.
Location & tenants
- Location reads 76/100 on livability (#222 in NY, #3,482 nationally) — a middle-class / working-renter tenant base. Strengths: commute A+, cost of living A+, housing A+; Watch: schools D+, crime F, employment F.
- Rochester City School District (urban): math 21% / reading 26% proficiency, ranked #589 of 590 in NY (top 100%) — low school quality limits family demand, transient renter base, plan for 1-2y turnover; 82% free/reduced lunch — lower-income household profile, screen leases tightly.
- Market conditions: Rents rising fast (+6.4%/yr); 78 active listings in the ZIP; 40 comparable units currently listed for rent nearby; rentals at typical pace (median 24d on market — plan ~3-4 weeks tenant-placement turnaround); 40% of comp listings sitting > 30 days — soft ceiling on asking rent; lower-income renter base — watch delinquency; 1,169 units permitted in Monroe County in 2024 (591 in 5+ unit buildings).
- At $1,690/mo this rent would consume 65% of the median local household income ($31k/yr) (locally 2168% of renters already pay >50% of income on rent) — very limited rent-growth headroom before tenants either downsize or default.
Forward outlook
- Local home prices are declining (-2.9%/yr); year-one equity from $277 of loan paydown is wiped out by about $1k of value loss. Plan a longer hold.
- Monroe County population projected to shrink 6% by 2050 — rents likely to lag national; underwrite the cash flow, not the appreciation.
- At projected returns (-2.9% appreciation + 6.4% rent growth), your $11k cash investment doubles in ~1 year — after that, you're playing with house money.
Negotiation context
- Only 8 days on market — expect competitive offers; lowballing is unlikely to land.
- 2 sale attempts since 13y ago with the ask held roughly flat each time — persistent listings suggest the price (not the market) is what's stuck; bring a comps-based counter.
- Current owner paid $15k; list at $40k implies a 167% gain — meaningful room to come down on a strong offer.
Risks & watch-outs
- Watch-outs: built in 1868 — expect roof / HVAC / electrical / plumbing capex.
Questions for the listing agent
- Built in 1868 — when were the roof, HVAC, electrical panel, plumbing, and water heater last replaced?
- Is there a deadline driving the sale (1031 exchange, divorce, estate, relocation)? That informs how much negotiation room exists.
- Schools are D-rated, which usually means shorter tenancies and higher turnover. Who's the typical renter profile here, and what's been the actual vacancy rate?
- Crime grade is F in this area — have there been break-ins, vandalism, or insurance claims at this property in the last 3 years? What carrier currently insures it and at what premium?
- The area grade is low — what's the realistic commute time and amenity access for the typical tenant pool here? Any planned neighborhood developments (good or bad) we should know about?
- What's the average days-on-market for RENTAL listings here right now (not sales)? A rising rental-DOM trend means longer vacancies and softer asking-rent achievability than the comps imply.
- What's the recent tenant-quality profile in this submarket — average credit score on applications, eviction rate, late-payment / NSF rate, and stable-employment percentage? A property-management company in the area should have these aggregated.
- How much new for-sale + rental construction is in the pipeline within 1–3 miles? Heavy new supply typically softens prices + rents 12–24 months out; constrained supply supports both.
Investment metrics
- 1% rule
- 4.22% ✓
- Cap rate
- 38.06%
- Cash-on-cash
- 113.46%
- DSCR
- 6.05
- GRM
- 2.0
CMA / ARV
- ARV (on-the-fly)
- $84,980
- Comps found
- 12
Show comp detail 12 sales within ~0.75 mi
| Address | Dist | Beds/Ba | Sqft | Sold | Price | $/sf | Match |
|---|---|---|---|---|---|---|---|
| 17 Orchard St | 0.05mi | 2/1.0 (-1) | 1,160 (-4%) | 2mo | $40,000 | $34 | 84 |
| 27 Rugraff St | 0.48mi | 3/1.0 | 1,200 (-1%) | 3mo | $123,000 | $103 | 73 |
| 631 Smith St | 0.32mi | 3/1.0 | 1,139 (-6%) | 3mo | $82,500 | $72 | 72 |
| 29 Dengler St | 0.18mi | 3/1.0 | 1,078 (-11%) | 4mo | $95,000 | $88 | 70 |
| 288 Orchard St | 0.36mi | 2/1.0 (-1) | 1,110 (-9%) | 2mo | $63,000 | $57 | 62 |
| 823 Jay St | 0.49mi | 3/2.0 | 1,292 (+6%) | 3mo | $143,000 | $111 | 60 |
| 111 Parkway | 0.73mi | 3/1.0 | 1,242 (+2%) | 4mo | $87,500 | $70 | 59 |
| 6 Marlow St | 0.71mi | 3/1.0 | 1,244 (+2%) | 5mo | $60,000 | $48 | 59 |
| 41 Klueh St | 0.61mi | 2/1.0 (-1) | 1,167 (-4%) | 4mo | $80,000 | $69 | 57 |
| 28 Cedar St | 0.45mi | 3/1.5 | 1,395 (+15%) | 2mo | $90,000 | $65 | 50 |
| 307 Hague St | 0.65mi | 3/1.0 | 1,356 (+12%) | 1mo | $70,000 | $52 | 50 |
| 385 Hague St | 0.68mi | 4/1.0 (+1) | 1,365 (+12%) | 1mo | $120,000 | $88 | 42 |
Match score weights: distance 35% · size 25% · config 20% · recency 20%. Top-matched comps best support the ARV.
Projected returns pro-forma
-2.93% appreciation · 6.37% rent growth · sell at horizon
- IRR
- —
- Equity multiple
- 6.98×
- Total profit
- $67,026
- Equity at exit
- $6,086
- IRR
- —
- Equity multiple
- 16.31×
- Total profit
- $171,459
- Equity at exit
- $3,669
Cash invested: $11,200 (down + closing). Projections, not guarantees.
Landlord ↔ Tenant lean methodology
- Overall (STATE)
- 15 Strongly Tenant-Friendly
- State New York
- 15 Strongly Tenant-Friendly · D+10
- County
- — inherits STATE
- City
- — inherits STATE
ZIP-level market 14611
- Home prices YoY
- -1.1%
- Rents YoY
- 6.4%
- Active inventory
- 78
- Price-to-rent
- 2.0×
Monthly cashflow live
- Estimated rent
- $1,690 high interval (Pro) →
- Mortgage (P&I)
- −$210
- Tax from tax record
- −$49 /mo · $592/yr
- Insurance
- −$17
- HOA
- −$0
- Vacancy / Maint / Mgmt
- −$355
- Net cashflow
- $1,059
Break-even live
UW: 25.0% down · 7.5% · 30yr · 1.5% tax · 5.0% vac · 8.0% maint · 8.0% mgmt
Financing live
Cash to close
- Down payment
- $10,000
- Closing costs
- $1,200
- Reserves months
- —
- Total cash needed
- —
Loan-product check · same deal, 3 products live
Conventional
25% down · 7.5% · 30yr
- Down + closing
- —
- Monthly P&I
- —
- Monthly cashflow
- —
- DSCR
- —
- Eligible?
- —
Personal DTI + credit; lowest rate.
DSCR
20% down · 8.5% · 30yr
- Down + closing
- —
- Monthly P&I
- —
- Monthly cashflow
- —
- DSCR
- —
- Eligible?
- —
No personal income docs; deal must DSCR.
Hard money
10% down · 12.0% · 12mo
- Down + closing
- —
- Monthly P&I
- —
- Monthly cashflow
- —
- DSCR
- —
- Eligible?
- —
Short-term bridge; refi at stabilization.
Rent comps 40 comps
| Address | Beds | Baths | Sqft | Rent | $/sqft | DOM | Units | Dist |
|---|---|---|---|---|---|---|---|---|
| 629 Jay St Rochester, NY | 3.0 | 1.0 | 1193 | $1,250 | $1.05 | 19d | 1 | 0.28mi |
| 658 Smith St Rochester, NY | 2.0 | 1.0 | 981 | $1,500 | $1.53 | 3d | 1 | 0.34mi |
| 710-712 Jay St Unit 3 Rochester, NY | 2.0 | 1.0 | 1252 | $895 | $0.71 | 43d | 1 | 0.38mi |
| 478 Tremont St Rochester, NY | 3.0 | 2.0 | 1424 | $1,500 | $1.05 | 43d | 1 | 0.62mi |
| 91 Reynolds St Unit 6 Rochester, NY | 2.0 | 1.0 | 900 | $1,100 | $1.22 | 43d | 1 | 0.64mi |
| 257 Hague St Unit 257 Rochester, NY | 2.0 | 1.5 | 1080 | $1,500 | $1.39 | 43d | 1 | 0.65mi |
| 39 Parkway Apt 1 Rochester, NY | 2.0 | 1.0 | 700 | $950 | $1.36 | 43d | 1 | 0.66mi |
| 802 Maple St Rochester, NY | 2.0 | 1.5 | 1080 | $1,800 | $1.67 | 43d | 1 | 0.66mi |
| 165 Atkinson St #6 Rochester, NY | 2.0 | 1.0 | 925 | $1,150 | $1.24 | 23d | 1 | 0.71mi |
| 69 Angle St Rochester, NY | 2.0 | 1.0 | 1500 | $1,500 | $1.00 | 14d | 1 | 0.73mi |
| 73 Somerset St Rochester, NY | 4.0 | 1.0 | 1000 | $1,750 | $1.75 | 43d | 1 | 0.79mi |
| 85 Cameron St Unit B Rochester, NY | 3.0 | 1.0 | 1138 | $1,650 | $1.45 | 43d | 1 | 0.79mi |
| 2 Jay St Unit 2 Rochester, NY | 3.0 | 1.0 | 1252 | $1,045 | $0.83 | 43d | 1 | 0.80mi |
| 193 Reynolds St Rochester, NY | 3.0 | 1.5 | 1342 | $1,800 | $1.34 | 21d | 1 | 0.85mi |
| 52 Lorimer St Unit 03 UP Rear Rochester, NY | 2.0 | 1.0 | 700 | $1,000 | $1.43 | 23d | 1 | 0.88mi |
| 190 Warwick Ave Rochester, NY | 3.0 | 1.5 | 1240 | $1,400 | $1.13 | 43d | 1 | 0.90mi |
| 192 Bartlett St Unit 192 Rochester, NY | 3.0 | 1.0 | 1099 | $1,295 | $1.18 | 14d | 1 | 0.91mi |
| 42 S Washington St Rochester, NY | 2.0 | 2.0 | 1298 | $2,300 | $1.77 | 43d | 1 | 0.94mi |
| 42 S Washington St Unit 401 Rochester, NY | 2.0 | 2.0 | 1298 | $2,300 | $1.77 | 23d | 1 | 0.94mi |
| 13 S Fitzhugh St Rochester, NY | 1.0–2.0 | 1.5–2.0 | 890 | $2,098 | $2.36 | 10d | 2 | 1.00mi |
| 95 Troup St Apt 8 Rochester, NY | 2.0 | 1.0 | 800 | $1,785 | $2.23 | 43d | 1 | 1.00mi |
| 25 Karnes St Rochester, NY | 2.0 | 1.0 | 1059 | $1,250 | $1.18 | 21d | 1 | 1.02mi |
| 65 W Broad St Unit 808 Rochester, NY | 2.0 | 1.0 | 796 | $1,679 | $2.11 | 14d | 1 | 1.02mi |
| 39 State St Rochester, NY | 1.0–2.0 | 1.0–2.5 | 1154 | $3,500 | $3.03 | 3d | 8 | 1.03mi |
| 30 W Broad St Unit 307 Rochester, NY | 2.0 | 1.0 | 911 | $1,950 | $2.14 | 43d | 1 | 1.05mi |
| 367 Hawley St Rochester, NY | 4.0 | 1.5 | 1210 | $1,395 | $1.15 | 43d | 1 | 1.06mi |
| 55 Exchange Blvd Rochester, NY | 2.0 | 1.0–2.0 | 952 | $2,695 | $2.83 | 3d | 28 | 1.11mi |
| 84 Twin Beeches Rochester, NY | 2.0 | 1.5 | 1096 | $1,250 | $1.14 | 23d | 1 | 1.19mi |
| 89 Twin Beeches Rochester, NY | 2.0 | 1.5 | 1096 | $1,250 | $1.14 | 43d | 1 | 1.19mi |
| 136 Garfield St Rochester, NY | 3.0 | 1.0 | 1152 | $1,200 | $1.04 | 19d | 1 | 1.20mi |
| 108 Wetmore Park Rochester, NY | 3.0 | 2.0 | 1278 | $1,900 | $1.49 | 10d | 1 | 1.22mi |
| 290 Exchange Blvd Rochester, NY | 2.0 | 1.0–2.0 | 892 | $2,102 | $2.36 | 2d | 15 | 1.25mi |
| 80 St Paul St Rochester, NY | 1.0–2.0 | 1.5–2.5 | 1024 | $1,935 | $1.89 | 3d | 3 | 1.26mi |
| 19 Garland Ave Rochester, NY | 3.0 | 1.0 | 1104 | $1,850 | $1.68 | 2d | 1 | 1.34mi |
| 102 Court St Rochester, NY | 1.0–2.0 | 1.0–2.0 | 952 | $2,570 | $2.70 | 3d | 11 | 1.34mi |
| 194 E Main St Rochester, NY | 1.0–2.0 | 1.0–2.0 | 875 | $2,095 | $2.39 | 14d | 1 | 1.35mi |
| 183 E Main St Rochester, NY | 1.0–2.0 | 1.0 | 1142 | $2,870 | $2.51 | 10d | 28 | 1.36mi |
| 260 E Main St Rochester, NY | 3.0 | 1.0–2.0 | 1144 | $2,999 | $2.62 | 3d | 14 | 1.45mi |
| 686 Seward St Rochester, NY | 3.0 | 1.5 | 1166 | $1,600 | $1.37 | 43d | 1 | 1.47mi |
| 14 Franklin St Rochester, NY | 2.0 | 1.0–2.0 | 1345 | $3,477 | $2.59 | 3d | 8 | 1.49mi |
Listing history 8 events
-
2026-06-05statusdays on market $40,000 Pending 8 DOM
-
2026-06-03days on market $40,000 Active 7 DOM
-
2026-06-03days on market $40,000 Active 6 DOM
-
2026-06-01days on market $40,000 Active 5 DOM
-
2026-05-31days on market $40,000 Active 4 DOM
-
2026-05-27$40,000 Active
-
2013-05-22soldstatus $15,000 240-char remark
Show marketing remark (240 chars)
Single Family House with lots of character and tons of potential. Make ready/cosmetics needed, some plumbing missing. Asking price reflects repairs needed. Property Management in place. Prior tenant paid $795.00 per month. "As Is"
-
2013-01-07$16,900 240-char remark
Show marketing remark (240 chars)
Single Family House with lots of character and tons of potential. Make ready/cosmetics needed, some plumbing missing. Asking price reflects repairs needed. Property Management in place. Prior tenant paid $795.00 per month. "As Is"
ⓘ Source: listings_history table (triggers on properties + properties_extension) + one-shot
backfill from property_details.listing_events for pre-trigger history.
Tax reassessment forecast NY · Partial reset (capped growth)
- Current annual tax
- $592 · $49/mo
- Projected year-2 tax
- $634 · $53/mo
- Expected delta
- +$42/yr (+$3/mo · 7.1%)
ⓘ Screening estimate from a state-policy table — verify with the county assessor before closing.
Climate risk First Street
- Flood 1/10 Low FEMA zone X (unshaded) · 0% chance over 30 yrs
- Wildfire 1/10 Low
- Heat 2/10 Low 7 d/yr ≥95°F today · 15 d/yr by 30 yrs out
- Wind 1/10 Low
- Air quality 2/10 Low 1 unhealthy d/yr today · 2 by 30 yrs out
Nearby sold comps map
Loading sold comps map…
Walkable amenities ~0.75 mi
Loading nearby amenities…
Taxation est. · year 1
- Rental income
- $20,274
- − Mortgage interest
- −$2,241
- − Property taxes
- −$592
- − Insurance
- −$200
- − Repairs & maintenance
- −$1,622
- − Management
- −$1,622
- − Depreciation
- −$1,164
- Taxable income
- $12,834
- Est. tax owed @ 24.0%
- −$3,080
- After-tax cash flow
- $9,627/yr
For passive investors: Depreciation is non-cash, so a rental often shows a tax loss while cash-flowing — sheltering income. Rental losses are passive: they offset passive income freely, and up to $25,000/yr can offset ordinary (W-2) income if you actively participate and your MAGI is under $100k (phasing out to $0 by $150k); unused losses carry forward. On sale, claimed depreciation is recaptured at up to 25%, and gains may owe capital-gains tax (a 1031 exchange can defer both). Figures are a year-1 estimate at your 24.0% rate — not tax advice; consult a CPA.
Schools (NCES district)
- District
- Rochester City School District
- NCES district ID
- 3624750
- Math proficiency
- 21% ▬ 0.00%
- Reading proficiency
- 26% ▲ 4.00%
- Median HH income
- $30,923
- Composite
- 18.98/100
- National rank
- #8850
- State rank
- #589 of 590 in NY
Livability — Rochester
- Score
- 76/100
- State rank
- #222
- US rank
- #3482
Category grades
Schools grade is shown separately in the Schools card above.
Census & demographics
- Census place
- Rochester, NY
- County
- Monroe County · 674,131 people
- City population
- 432,803
- Metro
- Rochester, NY
- Population (ZIP)
- 17,145
- Household income
- $31,376
- Rent vs Own
- Severe rent burden
- 2168.0
Population outlook (Monroe County) Hauer SSP2
- Today (2025)
- 759,460 people
- By 2030
- 757,154 · -0.3%
- By 2040
- 740,644 · -2.5%
- By 2050
- 714,443 · -5.9%
- By 2075
- 645,883 · -15.0%
- By 2100
- 547,084 · -28.0%
Race, ethnicity, and origin ACS 2023
- Neighborhood character
- Diverse neighborhood (Simpson 0.61)
- Race & ethnicity
- Black 55% White 22% Hispanic / Latino 18% Two or more races 13% Asian 1%
- Hispanic origin (detail)
- Puerto Rican 14% Dominican 2%
- Common ancestry
- Romanian 1% Lithuanian 1% Slovak 1%
- Foreign-born
- 3% · Canada
- Languages at home
- 85% English-only · Spanish 12% French/Haitian/Cajun 1% Other Indo-European 1%
Political lean MEDSL · Monroe
- 2024 margin
- D (+19.1) · D 59.5% · R 40.5%
- 2008→2024 swing
- +1.4pp toward D · 2008: 17.7pp · 2024: 19.1pp
- All cycles
- 2024: D+19.1 2020: D+21.0 2016: D+14.1 2012: D+17.4 2008: D+17.7
Not yet ingested
- Civics
- —
Market trends
- HPI YoY
- ▼ -2.93%
- Current HPI
- 262.1549
- Rent YoY
- ▲ 6.37%
- Metro
- Rochester, NY
- State GDP YoY
- ▲ 2.60%
- F500 in state
- 92
Industry mix (Fortune 500 HQ in NY)
| Industry | F500 HQs | Revenue |
|---|---|---|
| Financial Services | 10 | $950B |
|
||
| Consumer Goods | 9 | $162B |
|
||
| Insurance | 4 | $225B |
|
||
| Telecommunications | 2 | $144B |
|
||
| Pharmaceuticals | 2 | $112B |
|
||
| Media / Entertainment | 2 | $69B |
|
||
Price history
+136.7% since first listed3 events — show timeline
- 2026-05-27 Listed $40,000 UNYREIS
- 2013-05-22 Sold (MLS) $15,000 UNYREIS
- 2013-01-07 Listed $16,900 UNYREIS
Property tax history
+5.1%/yrLatest (2025): $592 · +0.0% YoY. Source: county tax records.
Cash-flow waterfall
monthlySold comps — $/sqft
last 12 mo · ≤1 miLoading sold comps…