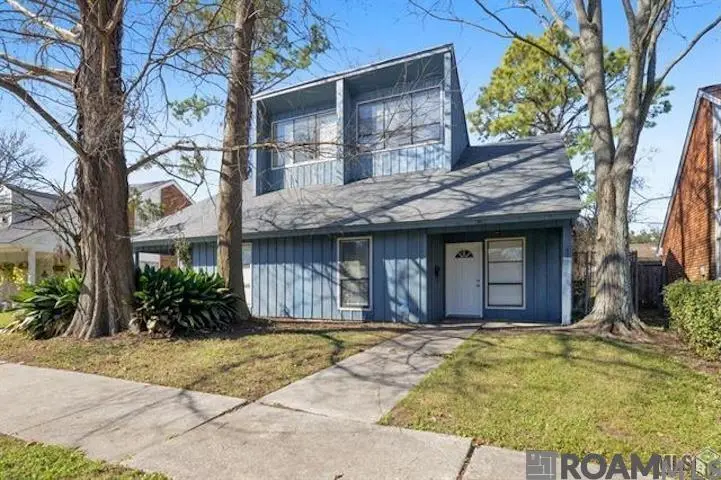
4934 Alvin Dark Ave · Baton Rouge, LA
Flood risk 1/10 · Minimal
- FEMA flood zone
- X
- Chance of flooding over 30 yrs
- 0.0%
- Est. flood insurance / yr
- $507 – $1,088
Fire risk 1/10 · Minimal
- Est. fire insurance / yr
- $1,269 – $2,357
Heat risk 8/10 · Major
- Hot days now (above 108°F)
- 7 days/yr
- Hot days in 30 yrs
- 20 days/yr
Wind risk 9/10 · Severe
- Chance of severe wind over 30 yrs
- 99.0%
Air-quality risk 2/10 · Minimal
- Unhealthy air days now
- 1 days/yr
- Unhealthy air days in 30 yrs
- 1 days/yr
Risk factors via First Street. Map © Google.
Why this score? — see what drove the B- grade
The composite is a weighted blend of 9 inputs, each scored 0–100. Each bar is that input's sub-score; the figure is the points it added to the 100-point composite (weight × sub-score).
- Cash flow +28.7/30.0
- ARV discount +10.7/15.0
- DSCR +10.0/10.0
- 1% rule +7.6/10.0
- Livability +3.7/5.0
- Rent growth +3.2/5.0
- Condition / age +2.5/5.0
- Schools +2.4/10.0
- Appreciation +0.0/10.0
$139,900
🖨 Deal sheet 📄 Offer letter ✓ Due diligence
Listing remarks MLS
Check out this duplex just minutes from LSU! Opportunities like this do not come around often, especially in a location with consistent rental demand. This unit features well-maintained interiors with neutral paint tones that appeal to a wide range of tenants and help keep vacancies low. Located on the LSU bus route, this property sits in a high-demand rental corridor where student and long-term tenants alike continue to drive strong occupancy. A covered carport provides convenient parking, and with no HOA dues, ownership remains straightforward and investor-friendly. Whether you are looking to expand your portfolio, secure a reliable income property near LSU, or take advantage of the recent price adjustment, this is the kind of opportunity serious investors move quickly on.
Key facts
- Lsu bus route
- Covered carport
- No hoa dues
Tags
Neighborhood map
What this means for you Summary
Snapshot
- This is a 3-bed/2.0-bath single-family listed at $140k.
Deal economics
- At list price, monthly cash flow is $468 ($6k/yr) — positive.
- The deal already cash-flows at list — no discount required.
- Meets the 1% rule at list price ($2k rent vs $140k).
- Recommended offer: $136k (3.0% below list) — sets the bar for market timing.
- Cap rate 10.3% vs local median 4.3% in Baton Rouge — top-decile yield for the area; either an underpriced asset or a hidden risk that comps aren't pricing in. Stress-test before assuming the spread holds.
Location & tenants
- Location reads 74/100 on livability (#24 in LA, #4,535 nationally) — a middle-class / working-renter tenant base. Strengths: commute A+, cost of living A+, health & safety A+; Watch: amenities D, crime F, employment D-.
- East Baton Rouge Parish (urban): math 22% / reading 34% proficiency, ranked #47 of 98 in LA (top 48%) — low school quality limits family demand, transient renter base, plan for 1-2y turnover; 77% free/reduced lunch — lower-income household profile, screen leases tightly.
- Market conditions: Rents rising (+2.8%/yr); 315 active listings in the ZIP; 40 comparable units currently listed for rent nearby; rentals at typical pace (median 24d on market — plan ~3-4 weeks tenant-placement turnaround); 2,252 units permitted in East Baton Rouge Parish in 2024 (440 in 5+ unit buildings).
- This rent runs 45% of the median local income ($47k/yr) — at the standard rent-burdened threshold; future hikes will face affordability resistance.
Forward outlook
- Local home prices are declining (-3.0%/yr); year-one equity from $967 of loan paydown is wiped out by about $4k of value loss. Plan a longer hold.
- East Baton Rouge County population projected at +4% by 2050 — modest demand growth; plan on rents tracking national, not racing it.
- At projected returns (-3.0% appreciation + 2.8% rent growth), your $39k cash investment doubles in ~9 years — after that, you're playing with house money.
Negotiation context
- It's been on market 49 days — a 3% lower offer ($136k) is reasonable based on typical stale-listing flexibility.
- 19 sale attempts since 29y ago; this cycle's ask is 9929% above the opening price — seller raised mid-cycle; expect resistance to lowballs.
- Current owner paid $111k; 26% above their basis — modest negotiation headroom, anchor on the comps not their cost.
Risks & watch-outs
- Climate carrying-cost: severe wind risk, 99% chance of damaging wind over 30y; extreme-heat days projected 7→20/yr by 2055 (HVAC capex compounding) — expect insurance premiums to compound above CPI over the hold.
Questions for the listing agent
- It's been on market 49 days. Have you received any prior offers? Is the seller open to a 3% concession, seller financing, or rate buy-down credit?
- Built in 1977 — when were the roof, HVAC, electrical panel, plumbing, and water heater last replaced?
- Is there a deadline driving the sale (1031 exchange, divorce, estate, relocation)? That informs how much negotiation room exists.
- Crime grade is F in this area — have there been break-ins, vandalism, or insurance claims at this property in the last 3 years? What carrier currently insures it and at what premium?
- What's the average days-on-market for RENTAL listings here right now (not sales)? A rising rental-DOM trend means longer vacancies and softer asking-rent achievability than the comps imply.
- What's the recent tenant-quality profile in this submarket — average credit score on applications, eviction rate, late-payment / NSF rate, and stable-employment percentage? A property-management company in the area should have these aggregated.
- How much new for-sale + rental construction is in the pipeline within 1–3 miles? Heavy new supply typically softens prices + rents 12–24 months out; constrained supply supports both.
Investment metrics
- 1% rule
- 1.26% ✓
- Cap rate
- 10.30%
- Cash-on-cash
- 14.32%
- DSCR
- 1.64
- GRM
- 6.6
CMA / ARV
- ARV (median comp)
- $150,574
- List price
- $139,900
- Delta
- -7.09%
- Verdict
- FAIR
- Comps
- 20 within 1.0 mi
Show comp detail 12 sales within ~0.75 mi
| Address | Dist | Beds/Ba | Sqft | Sold | Price | $/sf | Match |
|---|---|---|---|---|---|---|---|
| 1270 Sharlo Ave | 0.05mi | 2/2.0 (-1) | 1,465 (-2%) | 1mo | $140,000 | $96 | 89 |
| 2334 Brightside Dr | 0.18mi | 3/2.0 | 1,482 (-0%) | 2mo | $148,000 | $100 | 88 |
| 2216 Brightside Dr | 0.13mi | 3/2.0 | 1,478 (-1%) | 6mo | $164,000 | $111 | 88 |
| 1517 Sharlo Ave | 0.12mi | 2/2.0 (-1) | 1,444 (-3%) | 9mo | $120,000 | $83 | 77 |
| 1246 Sharlo Ave Unit 8-D-2 | 0.07mi | 4/2.0 (+1) | 1,641 (+10%) | 0mo | $199,000 | $121 | 74 |
| 2344 Brightside Dr | 0.19mi | 3/2.0 | 1,651 (+11%) | 6mo | $179,000 | $108 | 68 |
| 1550 Sharlo Ave | 0.20mi | 2/2.0 (-1) | 1,379 (-7%) | 7mo | $123,500 | $90 | 68 |
| 1310 Sharlo Ave | 0.08mi | 3/2.0 | 1,653 (+11%) | 12mo | $190,000 | $115 | 68 |
| 1318 Sharlo Ave | 0.08mi | 2/2.0 (-1) | 1,363 (-8%) | 14mo | $156,000 | $114 | 65 |
| 1361 Harwich Dr | 0.25mi | 3/2.0 | 1,272 (-15%) | 9mo | $210,000 | $165 | 56 |
| 2405 Brightside Dr Apt 64 | 0.34mi | 2/2.5 (-1) | 1,300 (-13%) | 0mo | $168,000 | $129 | 56 |
| 5132 & 5142 Oleson St | 0.51mi | 4/1.0 (+1) | 1,347 (-10%) | 3mo | $139,900 | $104 | 49 |
Match score weights: distance 35% · size 25% · config 20% · recency 20%. Top-matched comps best support the ARV.
Projected returns pro-forma
-3.0% appreciation · 2.79% rent growth · sell at horizon
- IRR
- 4.5%
- Equity multiple
- 1.17×
- Total profit
- $6,738
- Equity at exit
- $20,860
- IRR
- 13.7%
- Equity multiple
- 2.09×
- Total profit
- $42,696
- Equity at exit
- $12,096
Cash invested: $39,172 (down + closing). Projections, not guarantees.
Landlord ↔ Tenant lean methodology
- Overall (STATE)
- 90 Strongly Landlord-Friendly
- State Louisiana
- 90 Strongly Landlord-Friendly · R+12
- County
- — inherits STATE
- City
- — inherits STATE
ZIP-level market 70820
- Home prices YoY
- -29.9%
- Rents YoY
- 2.8%
- Active inventory
- 315
- Price-to-rent
- 6.6×
Monthly cashflow live
- Estimated rent
- $1,763 high interval (Pro) →
- Mortgage (P&I)
- −$734
- Tax from tax record
- −$133 /mo · $1,597/yr
- Insurance
- −$58
- HOA
- −$0
- Vacancy / Maint / Mgmt
- −$370
- Net cashflow
- $468
Break-even live
UW: 25.0% down · 7.5% · 30yr · 1.5% tax · 5.0% vac · 8.0% maint · 8.0% mgmt
Financing live
Cash to close
- Down payment
- $34,975
- Closing costs
- $4,197
- Reserves months
- —
- Total cash needed
- —
Loan-product check · same deal, 3 products live
Conventional
25% down · 7.5% · 30yr
- Down + closing
- —
- Monthly P&I
- —
- Monthly cashflow
- —
- DSCR
- —
- Eligible?
- —
Personal DTI + credit; lowest rate.
DSCR
20% down · 8.5% · 30yr
- Down + closing
- —
- Monthly P&I
- —
- Monthly cashflow
- —
- DSCR
- —
- Eligible?
- —
No personal income docs; deal must DSCR.
Hard money
10% down · 12.0% · 12mo
- Down + closing
- —
- Monthly P&I
- —
- Monthly cashflow
- —
- DSCR
- —
- Eligible?
- —
Short-term bridge; refi at stabilization.
Rent comps 40 comps
| Address | Beds | Baths | Sqft | Rent | $/sqft | DOM | Units | Dist |
|---|---|---|---|---|---|---|---|---|
| 1274 Sharlo Ave Unit 1519871P Baton Rouge, LA | 3.0 | 2.0 | 1786 | $3,298 | $1.85 | 14d | 1 | 0.06mi |
| 2000 Brightside Dr Baton Rouge, LA | 1.0–3.0 | 1.0–2.0 | 792 | $1,496 | $1.89 | 14d | 1 | 0.10mi |
| 2073 Brightside Dr Baton Rouge, LA | 2.0 | 2.0 | 1100 | $1,200 | $1.09 | 23d | 1 | 0.14mi |
| 5112 Arlington Ct Baton Rouge, LA | 3.0 | 3.0 | 1601 | $1,850 | $1.16 | 43d | 1 | 0.16mi |
| 5124 Brightside View Dr #3 Baton Rouge, LA | 2.0 | 1.5 | 1000 | $875 | $0.88 | 43d | 1 | 0.19mi |
| 5124 Brightside View Dr #4 Baton Rouge, LA | 2.0 | 1.0 | 1000 | $875 | $0.88 | 43d | 1 | 0.19mi |
| 5124 Brightside View Dr #4 Baton Rouge, LA | 2.0 | 1.5 | 1000 | $999 | $1.00 | 23d | 1 | 0.19mi |
| 2452 Brightside Dr Baton Rouge, LA | 2.0 | 2.0 | 1246 | $1,600 | $1.28 | 14d | 1 | 0.21mi |
| 2122 Stonehenge Ave Baton Rouge, LA | 2.0 | 1.5 | 1540 | $1,550 | $1.01 | 43d | 1 | 0.21mi |
| 1345 Harwich Dr Baton Rouge, LA | 3.0 | 2.0 | 1478 | $1,800 | $1.22 | 43d | 1 | 0.25mi |
| 4554 Y A Tittle Ave #2 Baton Rouge, LA | 2.0 | 1.0 | 900 | $825 | $0.92 | 14d | 1 | 0.26mi |
| 5268 S Brightside View Dr Apt 2 Baton Rouge, LA | 3.0 | 2.5 | 1348 | $1,250 | $0.93 | 43d | 1 | 0.27mi |
| 1724 Brightside Dr Apt A Baton Rouge, LA | 2.0 | 1.5 | 1050 | $1,025 | $0.98 | 23d | 1 | 0.29mi |
| 1704 Brightside Dr Unit C Baton Rouge, LA | 2.0 | 2.0 | 1088 | $1,175 | $1.08 | 21d | 1 | 0.30mi |
| 1983 S Brightside View Dr Baton Rouge, LA | 2.0 | 2.0 | 1270 | $1,100 | $0.87 | 21d | 1 | 0.31mi |
| 1983 S Brightside View Dr Unit C Baton Rouge, LA | 2.0 | 2.5 | 1124 | $1,195 | $1.06 | 43d | 1 | 0.31mi |
| 1953 S Brightside View Dr Unit B Baton Rouge, LA | 2.0 | 2.5 | 1218 | $1,300 | $1.07 | 14d | 1 | 0.31mi |
| 4521 Y a Tittle Ave Baton Rouge, LA | 3.0 | 2.0 | 1300 | $1,150 | $0.88 | 14d | 1 | 0.31mi |
| 2021 S Brightside View Dr Unit C Baton Rouge, LA | 2.0 | 2.5 | 1250 | $1,250 | $1.00 | 43d | 1 | 0.31mi |
| 2173 Plantation Ln Baton Rouge, LA | 2.0 | 2.0 | 1374 | $1,200 | $0.87 | 21d | 1 | 0.31mi |
| 1714 Brightside Dr Unit A Baton Rouge, LA | 2.0 | 1.5 | 1050 | $1,025 | $0.98 | 43d | 1 | 0.32mi |
| 1741 Brightside Dr Baton Rouge, LA | 2.0–3.0 | 2.0 | 1436 | $1,850 | $1.29 | 14d | 3 | 0.32mi |
| 5648 Riverstone Dr Unit 94A Baton Rouge, LA | 2.0 | 2.0 | 1603 | $1,250 | $0.78 | 21d | 1 | 0.33mi |
| 1835 S Brightside View Dr Unit C Baton Rouge, LA | 2.0 | 2.5 | 1250 | $1,375 | $1.10 | 23d | 1 | 0.33mi |
| 4445 Alvin Dark Ave Baton Rouge, LA | 1.0–3.0 | 1.0–3.0 | 869 | $1,200 | $1.38 | 14d | 14 | 0.39mi |
| 839 E Boyd Dr Unit C Baton Rouge, LA | 2.0 | 1.5 | 1080 | $1,400 | $1.30 | 19d | 1 | 0.60mi |
| 837 E Boyd Dr Unit A Baton Rouge, LA | 2.0 | 1.5 | 1080 | $1,300 | $1.20 | 19d | 1 | 0.61mi |
| 5107 Nicholson Dr Unit A30 Baton Rouge, LA | 2.0 | 2.0 | 1365 | $1,350 | $0.99 | 23d | 1 | 0.61mi |
| 5111 Nicholson Dr Unit A44 Baton Rouge, LA | 3.0 | 2.0 | 1567 | $1,650 | $1.05 | 23d | 1 | 0.63mi |
| 900 Dean Lee Dr Baton Rouge, LA | 2.0–3.0 | 2.0–3.0 | 1585 | $1,800 | $1.14 | 23d | 3 | 0.71mi |
| 900 Dean Lee Dr Baton Rouge, LA | 2.0–3.0 | 2.0–3.0 | 1585 | $1,800 | $1.14 | 43d | 3 | 0.71mi |
| 5157 Etta St Unit 4G Baton Rouge, LA | 3.0 | 2.0 | 1473 | $1,650 | $1.12 | 43d | 1 | 0.78mi |
| 582 Jennifer Jean Dr Baton Rouge, LA | 3.0 | 2.0 | 1370 | $1,500 | $1.09 | 43d | 1 | 0.78mi |
| 4441 Burbank Dr #108 Baton Rouge, LA | 3.0 | 3.0 | 1500 | $1,725 | $1.15 | 23d | 1 | 0.86mi |
| 436 Jennifer Jean Dr Baton Rouge, LA | 3.0 | 2.0 | 1100 | $1,950 | $1.77 | 14d | 1 | 0.88mi |
| 436 Jennifer Jean Dr Baton Rouge, LA | 3.0 | 2.0 | 1100 | $1,950 | $1.77 | 23d | 1 | 0.88mi |
| 4441 Burbank Dr Baton Rouge, LA | 3.0 | 2.0–3.0 | 1544 | $1,750 | $1.13 | 43d | 2 | 0.90mi |
| 4464 Highland Rd Baton Rouge, LA | 2.0 | 2.0 | 1219 | $1,675 | $1.37 | 43d | 1 | 1.05mi |
| 4264 Oxford Ave Unit 3 Baton Rouge, LA | 2.0 | 1.0 | 1000 | $1,350 | $1.35 | 43d | 1 | 1.15mi |
| 4264 Oxford Ave Unit 4 Baton Rouge, LA | 2.0 | 1.0 | 1000 | $1,295 | $1.29 | 23d | 1 | 1.15mi |
Listing history 34 events
-
2026-05-17price $1,395
-
2026-05-16$1,395
-
2026-05-16historical $1,395
-
2026-05-16$1,395
-
2026-04-17$1,500
-
2026-04-16price $139,900 785-char remark
Show marketing remark (785 chars)
Check out this duplex just minutes from LSU! Opportunities like this do not come around often, especially in a location with consistent rental demand. This unit features well-maintained interiors with neutral paint tones that appeal to a wide range of tenants and help keep vacancies low. Located on the LSU bus route, this property sits in a high-demand rental corridor where student and long-term tenants alike continue to drive strong occupancy. A covered carport provides convenient parking, and with no HOA dues, ownership remains straightforward and investor-friendly. Whether you are looking to expand your portfolio, secure a reliable income property near LSU, or take advantage of the recent price adjustment, this is the kind of opportunity serious investors move quickly on.
-
2026-04-09$149,900 Active 785-char remark
Show marketing remark (785 chars)
Check out this duplex just minutes from LSU! Opportunities like this do not come around often, especially in a location with consistent rental demand. This unit features well-maintained interiors with neutral paint tones that appeal to a wide range of tenants and help keep vacancies low. Located on the LSU bus route, this property sits in a high-demand rental corridor where student and long-term tenants alike continue to drive strong occupancy. A covered carport provides convenient parking, and with no HOA dues, ownership remains straightforward and investor-friendly. Whether you are looking to expand your portfolio, secure a reliable income property near LSU, or take advantage of the recent price adjustment, this is the kind of opportunity serious investors move quickly on.
-
2026-04-02price $274,900
-
2026-04-02price $274,900
-
2026-03-19price $289,900
-
2026-03-19price $289,900
-
2026-03-02$295,000 Active
-
2026-03-02$295,000 Active
-
2023-12-01soldstatus
-
2023-09-01$1,395
-
2022-07-28soldstatus
-
2022-06-22$1,395
-
2021-06-16soldstatus
-
2020-09-02$1,150
-
2020-08-28soldstatus $110,800
-
2014-06-09soldstatus $107,000
-
2014-02-04$112,000
-
2013-02-16$112,000
-
2013-02-16$112,000
-
2012-07-13$118,000
-
2012-07-13$118,000
-
2008-01-10soldstatus $135,000
-
2007-11-12$135,000
-
2001-03-30soldstatus
-
2000-08-02$79,900
-
2000-08-02$79,900
-
1997-02-26$71,900
ⓘ Source: listings_history table (triggers on properties + properties_extension) + one-shot
backfill from property_details.listing_events for pre-trigger history.
Tax reassessment forecast LA · Resets to sale price
- Current annual tax
- $1,597 · $133/mo
- Projected year-2 tax
- $1,597 · $133/mo
- Expected delta
- $0/yr ($0/mo · 0.0%)
ⓘ Screening estimate from a state-policy table — verify with the county assessor before closing.
Climate risk First Street
- Flood 1/10 Low FEMA zone X · 0% chance over 30 yrs
- Wildfire 1/10 Low
- Heat 8/10 Severe 7 d/yr ≥108°F today · 20 d/yr by 30 yrs out
- Wind 9/10 Extreme 99% chance of damaging wind over 30 yrs
- Air quality 2/10 Low 1 unhealthy d/yr today · 1 by 30 yrs out
Nearby sold comps map
Loading sold comps map…
Walkable amenities ~0.75 mi
Loading nearby amenities…
Taxation est. · year 1
- Rental income
- $21,153
- − Mortgage interest
- −$7,837
- − Property taxes
- −$1,597
- − Insurance
- −$700
- − Repairs & maintenance
- −$1,692
- − Management
- −$1,692
- − Depreciation
- −$4,070
- Taxable income
- $3,566
- Est. tax owed @ 24.0%
- −$856
- After-tax cash flow
- $4,755/yr
For passive investors: Depreciation is non-cash, so a rental often shows a tax loss while cash-flowing — sheltering income. Rental losses are passive: they offset passive income freely, and up to $25,000/yr can offset ordinary (W-2) income if you actively participate and your MAGI is under $100k (phasing out to $0 by $150k); unused losses carry forward. On sale, claimed depreciation is recaptured at up to 25%, and gains may owe capital-gains tax (a 1031 exchange can defer both). Figures are a year-1 estimate at your 24.0% rate — not tax advice; consult a CPA.
Schools (NCES district)
- District
- East Baton Rouge Parish
- NCES district ID
- 2200540
- Math proficiency
- 22% ▼ -36.00%
- Reading proficiency
- 34% ▼ -31.00%
- Median HH income
- $46,263
- Composite
- 24.14/100
- National rank
- #7745
- State rank
- #47 of 98 in LA
Livability — Baton Rouge
- Score
- 74/100
- State rank
- #24
- US rank
- #4535
Category grades
Schools grade is shown separately in the Schools card above.
Census & demographics
- Census place
- Baton Rouge, LA
- County
- East Baton Rouge Parish · 399,686 people
- City population
- 351,868
- Metro
- Baton Rouge, LA
- Population (ZIP)
- 23,377
- Household income
- $47,429
- Rent vs Own
- Severe rent burden
- 1879.0
Population outlook (East Baton Rouge County) Hauer SSP2
- Today (2025)
- 464,810 people
- By 2030
- 472,137 · +1.6%
- By 2040
- 480,243 · +3.3%
- By 2050
- 484,422 · +4.2%
- By 2075
- 492,069 · +5.9%
- By 2100
- 476,347 · +2.5%
Race, ethnicity, and origin ACS 2023
- Neighborhood character
- Diverse neighborhood (Simpson 0.63)
- Race & ethnicity
- White 56% Black 21% Hispanic / Latino 13% Asian 7% Two or more races 5% Native American 2%
- Hispanic origin (detail)
- Mexican 3%
- Common ancestry
- Lithuanian 7% Italian 2% Scotch-Irish 1%
- Foreign-born
- 13% · Canada, China, South Korea
- Languages at home
- 84% English-only · Spanish 9% Other Indo-European 3% Chinese 1%
Political lean MEDSL · East Baton Rouge
- 2024 margin
- D (+11.1) · D 54.5% · R 43.4% · Other 2.1%
- 2008→2024 swing
- +8.9pp toward D · 2008: 2.2pp · 2024: 11.1pp
- All cycles
- 2024: D+11.1 2020: D+13.1 2016: D+9.2 2012: D+5.2 2008: D+2.2
Not yet ingested
- Civics
- —
Market trends
- HPI YoY
- ▼ -56.10%
- Current HPI
- 131.5382
- Rent YoY
- ▲ 2.79%
- Metro
- Baton Rouge, LA
- State GDP YoY
- ▲ 3.29%
- F500 in state
- 10
Industry mix (Fortune 500 HQ in LA)
| Industry | F500 HQs | Revenue |
|---|---|---|
| Telecommunications | 2 | $23B |
|
||
| Utilities | 1 | $12B |
|
||
| Wholesale / Distribution | 1 | $5B |
|
||
| Advertising | 1 | $2B |
|
||
Price history
-98.1% since first listed34 events — show timeline
- 2026-05-17 Price Changed $1,395 APPFOLIO
- 2026-05-16 Listed for Rent $1,395 RAAMLS
- 2026-05-16 Rental Removed $1,395 GBRMLS
- 2026-05-16 Listed for Rent $1,395 GBRMLS
- 2026-04-17 Listed for Rent $1,500 APPFOLIO
- 2026-04-16 Price Changed $139,900 AcadianaMLS
- 2026-04-16 Price Changed $139,900 GBRMLS
- 2026-04-09 Listed $149,900 GBRMLS
- 2026-04-09 Listed $149,900 AcadianaMLS
- 2026-04-02 Price Changed $274,900 AcadianaMLS
- 2026-04-02 Price Changed $274,900 GBRMLS
- 2026-03-19 Price Changed $289,900 AcadianaMLS
- 2026-03-19 Price Changed $289,900 GBRMLS
- 2026-03-02 Listed $295,000 GBRMLS
- 2026-03-02 Listed $295,000 AcadianaMLS
- 2023-12-01 Sold (MLS) — GBRMLS
- 2023-09-01 Listed $1,395 GBRMLS
- 2022-07-28 Sold (MLS) — GBRMLS
- 2022-06-22 Listed $1,395 GBRMLS
- 2021-06-16 Sold (MLS) — GBRMLS
- 2020-09-02 Listed $1,150 GBRMLS
- 2020-08-28 Sold (Public Records) $110,800 Public Records
- 2014-06-09 Sold (Public Records) $107,000 Public Records
- 2014-02-04 Listed $112,000 AcadianaMLS
- 2013-02-16 Listed $112,000 AcadianaMLS
- 2013-02-16 Listed $112,000 GBRMLS
- 2012-07-13 Listed $118,000 AcadianaMLS
- 2012-07-13 Listed $118,000 GBRMLS
- 2008-01-10 Sold (Public Records) $135,000 Public Records
- 2007-11-12 Listed $135,000 AcadianaMLS
- 2001-03-30 Sold (MLS) — GBRMLS
- 2000-08-02 Listed $79,900 GBRMLS
- 2000-08-02 Listed $79,900 AcadianaMLS
- 1997-02-26 Listed $71,900 AcadianaMLS
Property tax history
-0.1%/yrLatest (2025): $1,597 · +4.5% YoY. Source: county tax records.
Cash-flow waterfall
monthlySold comps — $/sqft
last 12 mo · ≤1 miLoading sold comps…