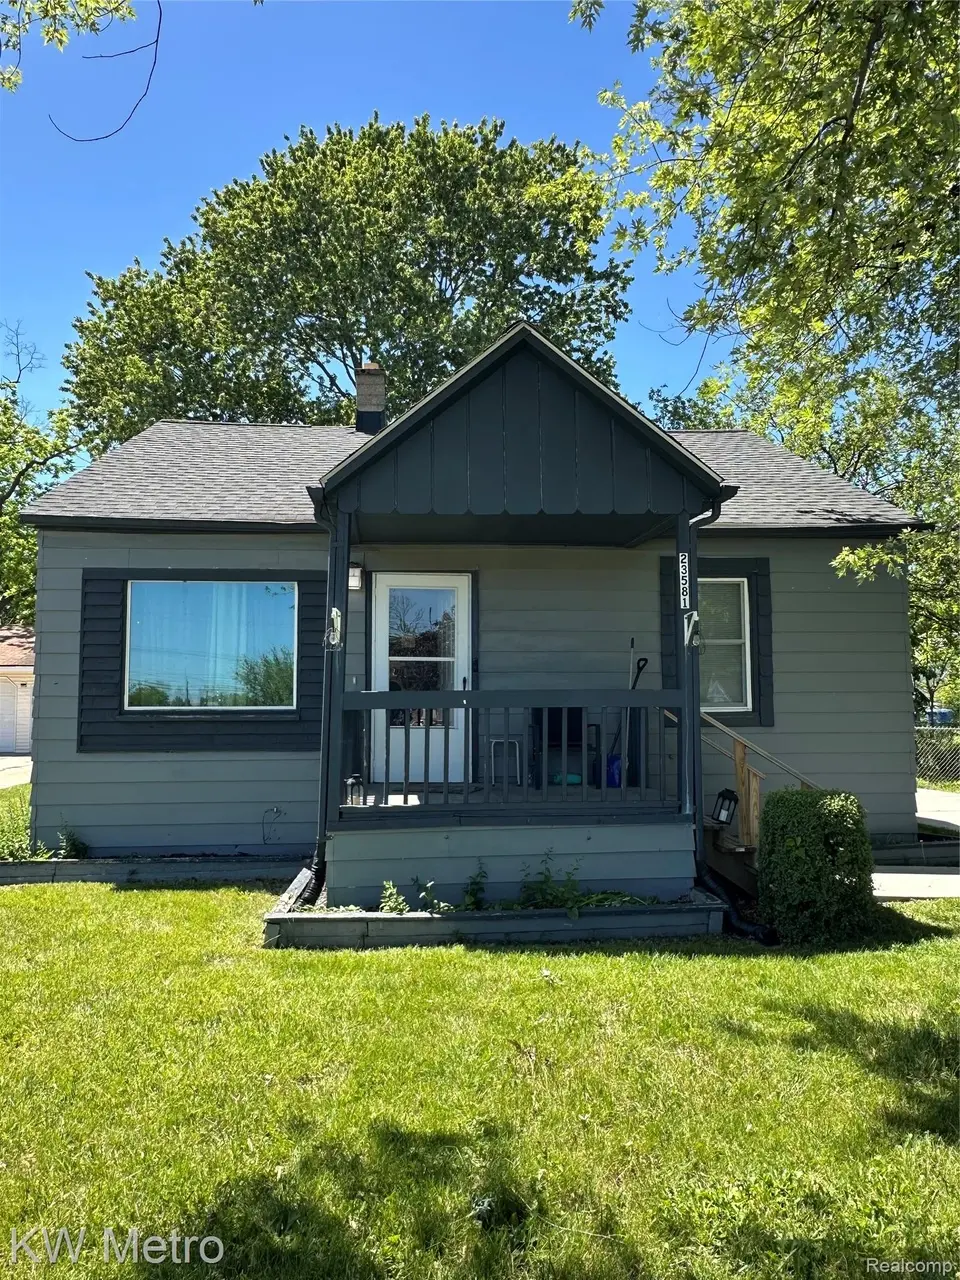
23581 Wagner Ave · Warren, MI
Flood risk 1/10 · Minimal
- FEMA flood zone
- X (unshaded)
- Chance of flooding over 30 yrs
- 0.0%
- Est. flood insurance / yr
- $507 – $1,088
Fire risk 1/10 · Minimal
- Est. fire insurance / yr
- $784 – $1,456
Heat risk 3/10 · Minor
- Hot days now (above 96°F)
- 7 days/yr
- Hot days in 30 yrs
- 14 days/yr
Wind risk 1/10 · Minimal
- Chance of severe wind over 30 yrs
- —
Air-quality risk 3/10 · Minor
- Unhealthy air days now
- 3 days/yr
- Unhealthy air days in 30 yrs
- 4 days/yr
Risk factors via First Street. Map © Google.
Why this score? — see what drove the C- grade
The composite is a weighted blend of 9 inputs, each scored 0–100. Each bar is that input's sub-score; the figure is the points it added to the 100-point composite (weight × sub-score).
- Cash flow +20.4/30.0
- ARV discount +10.0/15.0
- DSCR +6.5/10.0
- 1% rule +6.2/10.0
- Livability +3.7/5.0
- Rent growth +3.2/5.0
- Condition / age +2.5/5.0
- Schools +1.0/10.0
- Appreciation +0.0/10.0
$115,000
🖨 Deal sheet (PDF) 📄 Offer letter ✓ Due diligence
Listing remarks MLS
Large 2 bedroom home in quiet neighborhood with extra large lots. Most everything had been updated in 2022 including the kitchen (cabinets & countertops), all flooring throughout, fresh paint, new roof and windows, hot water tank, new electrical service outside and new panel inside, large section of driveway is new concrete along with the sidewalk to house. All appliances are newer and included in the sale. Unfinished attic with pull down stairs is huge and great for storage, maybe one day it could be finished for a 3rd bedroom. This house passed C of O in 2022 and has a current landlord license. Pictures prior to tenant moving in, all C of O docs, and approved permits are available upon request. Agent owned.
Key facts
- Updated kitchen
- New panel
- Extra large lots
Tags
Property features AI
Exterior
- Parking: No garage
- Utilities: Public water; Public sewer
- Home design: Single-family residence; One story; Ground-level entry with steps
- Construction: Aluminum siding
- Exterior features: Outdoor lighting; Deck; Fenced yard; Paved road access
Interior
- Kitchen: Dishwasher; Disposal; Free-standing gas range; Free-standing refrigerator; Microwave
- Bedrooms: 6 total rooms (includes bedrooms and living spaces)
- Bathrooms: 1 full bathroom
- Heating & cooling: Forced air heating (natural gas); Has heating; No cooling
- Interior features: Smart thermostat; Crawl space basement
- Laundry & utility: Laundry room; Washer; Dryer; Gas water heater
Neighborhood map
What this means for you Summary
Snapshot
- This is a 2-bed/1.0-bath single-family listed at $115k.
Deal economics
- At list price, monthly cash flow is $150 ($2k/yr) — positive.
- The deal already cash-flows at list — no discount required.
- Meets the 1% rule at list price ($1k rent vs $115k).
- Recommended offer: $113k (1.5% below list) — sets the bar for market timing.
- Cap rate 7.9% vs local median 5.2% in Warren — top-decile yield for the area; either an underpriced asset or a hidden risk that comps aren't pricing in. Stress-test before assuming the spread holds.
Location & tenants
- Location reads 74/100 on livability (#171 in MI, #4,491 nationally) — a middle-class / working-renter tenant base. Strengths: commute A+, cost of living A+, housing A+; Watch: schools D, amenities D, employment D.
- Van Dyke Public Schools (urban): math 7% / reading 19% proficiency, ranked #512 of 540 in MI (top 95%) — low school quality limits family demand, transient renter base, plan for 1-2y turnover; 80% free/reduced lunch — lower-income household profile, screen leases tightly.
- Market conditions: Rents rising (+2.9%/yr); 168 active listings in the ZIP; 35 comparable units currently listed for rent nearby; rentals at typical pace (median 25d on market — plan ~3-4 weeks tenant-placement turnaround); 1,321 units permitted in Macomb County in 2024 (86 in 5+ unit buildings).
Forward outlook
- Local home prices are declining (-3.0%/yr); year-one equity from $795 of loan paydown is wiped out by about $3k of value loss. Plan a longer hold.
- Macomb County population projected at +9% by 2050 — modest demand growth; plan on rents tracking national, not racing it.
Negotiation context
- It's been on market 21 days — a 2% lower offer ($113k) is reasonable based on typical stale-listing flexibility.
- 18 sale attempts since 30y ago with the ask held roughly flat each time — persistent listings suggest the price (not the market) is what's stuck; bring a comps-based counter.
Risks & watch-outs
- Watch-outs: built in 1938 — expect roof / HVAC / electrical / plumbing capex.
Questions for the listing agent
- Built in 1938 — when were the roof, HVAC, electrical panel, plumbing, and water heater last replaced?
- Is there a deadline driving the sale (1031 exchange, divorce, estate, relocation)? That informs how much negotiation room exists.
- Schools are D-rated, which usually means shorter tenancies and higher turnover. Who's the typical renter profile here, and what's been the actual vacancy rate?
- Crime grade is D in this area — have there been break-ins, vandalism, or insurance claims at this property in the last 3 years? What carrier currently insures it and at what premium?
- What's the average days-on-market for RENTAL listings here right now (not sales)? A rising rental-DOM trend means longer vacancies and softer asking-rent achievability than the comps imply.
- What's the recent tenant-quality profile in this submarket — average credit score on applications, eviction rate, late-payment / NSF rate, and stable-employment percentage? A property-management company in the area should have these aggregated.
- How much new for-sale + rental construction is in the pipeline within 1–3 miles? Heavy new supply typically softens prices + rents 12–24 months out; constrained supply supports both.
Investment metrics
- 1% rule
- 1.12% ✓
- Cap rate
- 7.86%
- Cash-on-cash
- 5.60%
- DSCR
- 1.25
- GRM
- 7.5
CMA / ARV
- ARV (on-the-fly)
- $121,810
- Comps found
- 12
Show comp detail 12 sales within ~0.75 mi
| Address | Dist | Beds/Ba | Sqft | Sold | Price | $/sf | Match |
|---|---|---|---|---|---|---|---|
| 12110 Belmont Ave | 0.05mi | 3/1.0 (+1) | 912 (-3%) | 4mo | $143,000 | $157 | 85 |
| 23721 Wagner Ave | 0.09mi | 3/1.0 (+1) | 946 (+1%) | 6mo | $137,000 | $145 | 84 |
| 12036 Belmont Ave | 0.08mi | 3/1.0 (+1) | 1,000 (+7%) | 8mo | $142,500 | $143 | 74 |
| 11811 Timken Ave | 0.17mi | 3/1.5 (+1) | 1,019 (+9%) | 6mo | $80,000 | $79 | 66 |
| 11108 Essex Ave | 0.67mi | 3/1.0 (+1) | 946 (+1%) | 0mo | $114,900 | $121 | 62 |
| 11051 Timken Ave | 0.72mi | 3/1.0 (+1) | 960 (+2%) | 3mo | $125,000 | $130 | 55 |
| 22803 Sharrow Ave | 0.67mi | 3/1.0 (+1) | 972 (+4%) | 7mo | $95,000 | $98 | 52 |
| 11219 Maxwell Ave | 0.73mi | 3/1.0 (+1) | 894 (-5%) | 3mo | $116,000 | $130 | 51 |
| 11276 Ocalla Dr | 0.62mi | 2/1.0 | 1,064 (+14%) | 2mo | $163,000 | $153 | 47 |
| 11259 Chapp Ave | 0.61mi | 2/1.0 | 814 (-13%) | 4mo | $65,000 | $80 | 47 |
| 11234 Essex Ave | 0.61mi | 2/1.0 | 800 (-15%) | 4mo | $99,900 | $125 | 44 |
| 11169 Ocalla Dr | 0.71mi | 3/1.0 (+1) | 1,064 (+14%) | 2mo | $160,000 | $150 | 37 |
Match score weights: distance 35% · size 25% · config 20% · recency 20%. Top-matched comps best support the ARV.
Projected returns pro-forma
-3.0% appreciation · 2.94% rent growth · sell at horizon
- IRR
- -7.7%
- Equity multiple
- 0.72×
- Total profit
- $-9,087
- Equity at exit
- $17,147
- IRR
- 1.9%
- Equity multiple
- 1.13×
- Total profit
- $4,337
- Equity at exit
- $9,943
Cash invested: $32,200 (down + closing). Projections, not guarantees.
Landlord ↔ Tenant lean methodology
- Overall (STATE)
- 62 Landlord-Friendly
- State Michigan
- 62 Landlord-Friendly · EVEN
- County
- — inherits STATE
- City
- — inherits STATE
ZIP-level market 48089
- Rents YoY
- 2.9%
- Active inventory
- 168
- Price-to-rent
- 7.5×
Monthly cashflow live
- Estimated rent
- $1,285 high interval (Pro) →
- Mortgage (P&I)
- −$603
- Tax from tax record
- −$214 /mo · $2,565/yr
- Insurance
- −$48
- HOA
- −$0
- Vacancy / Maint / Mgmt
- −$270
- Net cashflow
- $150
Break-even live
Sensitivity live
| Price | -10% $215 | -5% $183 | +0% $150 | +5% $118 | +10% $85 |
|---|---|---|---|---|---|
| Rent | -10% $49 | -5% $99 | +0% $150 | +5% $201 | +10% $252 |
| Rate | -1.0pp $208 | -0.5pp $179 | base $150 | +0.5pp $120 | +1.0pp $90 |
UW: 25.0% down · 7.5% · 30yr · 1.5% tax · 5.0% vac · 8.0% maint · 8.0% mgmt
Financing live
Cash to close
- Down payment
- $28,750
- Closing costs
- $3,450
- Reserves months
- —
- Total cash needed
- —
Loan-product check · same deal, 3 products live
Conventional
25% down · 7.5% · 30yr
- Down + closing
- —
- Monthly P&I
- —
- Monthly cashflow
- —
- DSCR
- —
- Eligible?
- —
Personal DTI + credit; lowest rate.
DSCR
20% down · 8.5% · 30yr
- Down + closing
- —
- Monthly P&I
- —
- Monthly cashflow
- —
- DSCR
- —
- Eligible?
- —
No personal income docs; deal must DSCR.
Hard money
10% down · 12.0% · 12mo
- Down + closing
- —
- Monthly P&I
- —
- Monthly cashflow
- —
- DSCR
- —
- Eligible?
- —
Short-term bridge; refi at stabilization.
Rent comps 35 comps
| Address | Beds | Baths | Sqft | Rent | $/sqft | DOM | Units | Dist |
|---|---|---|---|---|---|---|---|---|
| 11331 Continental Ave Warren, MI | 2.0 | 1.0 | 765 | $1,250 | $1.63 | 25d | 1 | 0.54mi |
| 11359 Maxwell Ave Unit 11359 Warren, MI | 2.0 | 1.0 | 900 | $1,000 | $1.11 | 4d | 1 | 0.64mi |
| 11130 Stephens Rd Warren, MI | 2.0 | 1.0 | 750 | $1,275 | $1.70 | 0d | 1 | 0.67mi |
| 22852 Sharrow Ave Warren, MI | 3.0 | 1.0 | 1000 | $1,400 | $1.40 | 5d | 1 | 0.68mi |
| 8716 Timken Ave Warren, MI | 3.0 | 1.0 | 1008 | $1,400 | $1.39 | 25d | 1 | 0.78mi |
| 25146 Wagner Ave Warren, MI | 3.0 | 1.0 | 906 | $1,900 | $2.10 | 25d | 1 | 0.82mi |
| 8707 Continental Ave Warren, MI | 3.0 | 1.0 | 1100 | $1,200 | $1.09 | 5d | 1 | 0.82mi |
| 8707 Continental Ave Warren, MI | 3.0 | 1.0 | 968 | $1,200 | $1.24 | 18d | 1 | 0.82mi |
| 25108 Hoover Rd Warren, MI | 1.0–2.0 | 1.0 | 702 | $1,324 | $1.88 | 0d | 61 | 0.82mi |
| 11476 Warren Blvd Unit 114 Warren, MI | 1.0 | 1.0 | 800 | $1,125 | $1.41 | 44d | 1 | 0.84mi |
| 8693 Paige Ave Warren, MI | 3.0 | 1.0 | 900 | $1,300 | $1.44 | 25d | 1 | 0.85mi |
| 11500 Warren Blvd Warren, MI | 1.0 | 1.0 | 800 | $1,125 | $1.41 | 15d | 1 | 0.87mi |
| 11404 Warren Blvd Unit 102 Warren, MI | 2.0 | 1.0 | 900 | $1,250 | $1.39 | 25d | 1 | 0.88mi |
| 8636 Republic Ave Warren, MI | 2.0 | 1.0 | 800 | $1,250 | $1.56 | 15d | 1 | 0.88mi |
| 11319 Chalmers Ave Warren, MI | 3.0 | 1.0 | 975 | $1,500 | $1.54 | 25d | 1 | 0.92mi |
| 11236 Studebaker Ave Warren, MI | 2.0 | 1.0 | 672 | $1,175 | $1.75 | 44d | 1 | 0.93mi |
| 11076 Hudson Ave Warren, MI | 3.0 | 1.0 | 936 | $1,395 | $1.49 | 4d | 1 | 0.95mi |
| 8509 Paige Ave Warren, MI | 3.0 | 1.0 | 950 | $1,300 | $1.37 | 25d | 1 | 0.96mi |
| 13050 Couwlier Ave Warren, MI | 3.0 | 1.0 | 850 | $1,350 | $1.59 | 25d | 1 | 1.00mi |
| 21412 Waltham Rd Warren, MI | 2.0 | 1.0 | 696 | $1,225 | $1.76 | 44d | 1 | 1.00mi |
| 8428 Timken Ave Warren, MI | 3.0 | 1.0 | 860 | $1,250 | $1.45 | 25d | 1 | 1.01mi |
| 8632 Studebaker Ave Warren, MI | 3.0 | 1.0 | 761 | $1,300 | $1.71 | 4d | 1 | 1.13mi |
| 8212 Timken Ave Warren, MI | 2.0 | 1.0 | 756 | $1,320 | $1.75 | 25d | 1 | 1.15mi |
| 8640 Chalmers Ave Warren, MI | 3.0 | 1.0 | 804 | $1,423 | $1.77 | 25d | 1 | 1.16mi |
| 8125 Timken Ave Warren, MI | 3.0 | 1.0 | 948 | $1,270 | $1.34 | 5d | 1 | 1.19mi |
| 8103 Lozier Ave Unit 2 Warren, MI | 1.0 | 1.0 | 600 | $650 | $1.08 | 44d | 1 | 1.21mi |
| 11228 Sherman Ave Warren, MI | 2.0 | 1.0 | 1000 | $1,200 | $1.20 | 13d | 1 | 1.25mi |
| 12846 Georgiana Ave Warren, MI | 3.0 | 1.0 | 912 | $1,300 | $1.43 | 25d | 1 | 1.27mi |
| 8251 Hudson Ave Warren, MI | 3.0 | 1.0 | 908 | $1,400 | $1.54 | 25d | 1 | 1.29mi |
| 12807 Coleen Ave Warren, MI | 3.0 | 1.0 | 1080 | $1,250 | $1.16 | 25d | 1 | 1.29mi |
| 13501 Vernon Ave Warren, MI | 2.0 | 1.0 | 850 | $1,300 | $1.53 | 25d | 1 | 1.33mi |
| 20553 Hamburg St Detroit, MI | 3.0 | 1.0 | 1074 | $1,300 | $1.21 | 4d | 1 | 1.38mi |
| 8036 Hupp Ave Warren, MI | 2.0 | 1.0 | 680 | $1,150 | $1.69 | 44d | 1 | 1.40mi |
| 8162 Orchard Ave Warren, MI | 2.0 | 1.0 | 900 | $1,000 | $1.11 | 44d | 1 | 1.45mi |
| 20296 Waltham St Detroit, MI | 3.0 | 1.5 | 986 | $1,300 | $1.32 | 18d | 1 | 1.49mi |
Listing history 15 events
-
2026-06-21days on market $115,000 Active 21 DOM
-
2026-06-18days on market $115,000 Active 18 DOM
-
2026-06-17days on market $115,000 Active 17 DOM
-
2026-06-16days on market $115,000 Active 16 DOM
-
2026-06-15days on market $115,000 Active 15 DOM
-
2026-06-13days on market $115,000 Active 13 DOM
-
2026-06-13days on market $115,000 Active 12 DOM
-
2026-06-09days on market $115,000 Active 9 DOM
-
2026-06-08days on market $115,000 Active 8 DOM
-
2026-06-07days on market $115,000 Active 7 DOM
-
2026-06-04days on market $115,000 Active 4 DOM
-
2026-06-03days on market $115,000 Active 3 DOM
-
2026-06-02days on market $115,000 Active 2 DOM
-
2026-06-01remarks 695-char remark
-
2026-06-01$115,000 Active 1 DOM
ⓘ Source: listings_history table (triggers on properties + properties_extension) + one-shot
backfill from property_details.listing_events for pre-trigger history.
Tax reassessment forecast MI · Partial reset (capped growth)
- Current annual tax
- $2,565 · $214/mo
- Projected year-2 tax
- $2,565 · $214/mo
- Expected delta
- $0/yr ($0/mo · 0.0%)
ⓘ Screening estimate from a state-policy table — verify with the county assessor before closing.
Climate risk First Street
- Flood 1/10 Low FEMA zone X (unshaded) · 0% chance over 30 yrs
- Wildfire 1/10 Low
- Heat 3/10 Moderate 7 d/yr ≥96°F today · 14 d/yr by 30 yrs out
- Wind 1/10 Low
- Air quality 3/10 Moderate 3 unhealthy d/yr today · 4 by 30 yrs out
Nearby sold comps map
Loading sold comps map…
Walkable amenities ~0.75 mi
Loading nearby amenities…
Taxation est. · year 1
- Rental income
- $15,416
- − Mortgage interest
- −$6,442
- − Property taxes
- −$2,565
- − Insurance
- −$575
- − Repairs & maintenance
- −$1,233
- − Management
- −$1,233
- − Depreciation
- −$3,345
- Taxable income
- $22
- Est. tax owed @ 24.0%
- −$5
- After-tax cash flow
- $1,796/yr
For passive investors: Depreciation is non-cash, so a rental often shows a tax loss while cash-flowing — sheltering income. Rental losses are passive: they offset passive income freely, and up to $25,000/yr can offset ordinary (W-2) income if you actively participate and your MAGI is under $100k (phasing out to $0 by $150k); unused losses carry forward. On sale, claimed depreciation is recaptured at up to 25%, and gains may owe capital-gains tax (a 1031 exchange can defer both). Figures are a year-1 estimate at your 24.0% rate — not tax advice; consult a CPA.
Schools (NCES district)
- District
- Van Dyke Public Schools
- NCES district ID
- 2634680
- Math proficiency
- 7% ▼ -11.00%
- Reading proficiency
- 19% ▼ -5.00%
- Median HH income
- $33,231
- Composite
- 10.46/100
- National rank
- #9784
- State rank
- #512 of 540 in MI
Livability — Warren
- Score
- 74/100
- State rank
- #171
- US rank
- #4491
Category grades
Schools grade is shown separately in the Schools card above.
Census & demographics
- Census place
- Warren, MI
- County
- Macomb County · 638,552 people
- City population
- 114,937
- Metro
- Detroit-Warren-Dearborn, MI
- Population (ZIP)
- 31,853
- Household income
- $52,366
- Rent vs Own
- Severe rent burden
- 1754.0
Population outlook (Macomb County) Hauer SSP2
- Today (2025)
- 925,296 people
- By 2030
- 948,226 · +2.5%
- By 2040
- 983,961 · +6.3%
- By 2050
- 1,010,200 · +9.2%
- By 2075
- 1,076,222 · +16.3%
- By 2100
- 1,077,065 · +16.4%
Race, ethnicity, and origin ACS 2023
- Neighborhood character
- Diverse neighborhood (Simpson 0.61)
- Race & ethnicity
- White 53% Black 31% Asian 7% Two or more races 6% Hispanic / Latino 3%
- Common ancestry
- Romanian 11% Lithuanian 3% Slovak 2%
- Foreign-born
- 5% · Canada
- Languages at home
- 92% English-only · Other Asian/Pacific 3% Other Indo-European 2% Arabic 1%
Political lean MEDSL · Macomb
- 2024 margin
- R (+13.7) · D 42.2% · R 55.9% · Other 1.9%
- 2008→2024 swing
- -22.3pp toward R · 2008: 8.6pp · 2024: -13.7pp
- All cycles
- 2024: R+13.7 2020: R+8.1 2016: R+11.6 2012: D+4.0 2008: D+8.6
Not yet ingested
- Civics
- —
Market trends
- HPI YoY
- ▼ -211.46%
- Current HPI
- 154.8325
- Rent YoY
- ▲ 2.94%
- Metro
- Detroit-Warren-Dearborn, MI
- State GDP YoY
- ▲ 1.37%
- F500 in state
- 28
Industry mix (Fortune 500 HQ in MI)
| Industry | F500 HQs | Revenue |
|---|---|---|
| Automotive Parts | 3 | $48B |
|
||
| Automotive | 2 | $372B |
|
||
| Chemicals | 1 | $45B |
|
||
| Automotive Retail | 1 | $29B |
|
||
| Healthcare / Medical Devices | 1 | $23B |
|
||
| Automotive Technology | 1 | $20B |
|
||
Price history
+156.1% since first listed44 events — show timeline
- 2026-05-31 Listed $115,000 REALCOMP
- 2026-05-31 Listed $115,000 MiRealSource-MiMLS
- 2025-12-05 Listing Removed — REALCOMP
- 2025-12-05 Listing Removed — MiRealSource-MiMLS
- 2025-10-24 Price Changed $123,900 MiRealSource-MiMLS
- 2025-10-24 Price Changed $123,900 REALCOMP
- 2025-10-04 Listed $124,900 REALCOMP
- 2025-10-04 Listed $124,900 MiRealSource-MiMLS
- 2022-08-09 Sold (Public Records) $108,500 Public Records
- 2022-07-21 Sold (MLS) $108,500 MiRealSource-MiMLS
- 2022-07-21 Sold (MLS) $108,500 REALCOMP
- 2022-07-06 Pending — MiRealSource-MiMLS
- 2022-07-06 Pending — REALCOMP
- 2022-07-01 Listed $119,900 REALCOMP
- 2022-06-30 Listed $119,900 MiRealSource-MiMLS
- 2019-11-12 Sold (MLS) $33,900 REALCOMP
- 2019-10-17 Pending — MiRealSource-MiMLS
- 2019-10-17 Pending — REALCOMP
- 2019-10-10 Listed $37,500 MiRealSource-MiMLS
- 2019-10-10 Listed $37,500 REALCOMP
- 2017-04-24 Sold (MLS) $32,000 MiRealSource-MiMLS
- 2017-04-24 Sold (MLS) $32,000 REALCOMP
- 2017-03-08 Relisted — MiRealSource-MiMLS
- 2017-03-08 Relisted — REALCOMP
- 2017-02-21 Pending — MiRealSource-MiMLS
- 2017-02-20 Pending — REALCOMP
- 2017-02-06 Listed $40,000 MiRealSource-MiMLS
- 2017-02-06 Listed $40,000 REALCOMP
- 2013-04-29 Listing Removed — MiRealSource-MiMLS
- 2012-10-30 Listing Removed — REALCOMP
- 2012-10-30 Listing Removed — MiRealSource-MiMLS
- 2012-07-03 Listed $23,000 REALCOMP
- 2012-07-03 Listed $23,000 MiRealSource-MiMLS
- 2012-07-03 Listed $23,000 MiRealSource-MiMLS
- 2010-01-14 Sold (MLS) $7,000 REALCOMP
- 2010-01-14 Sold (MLS) $7,000 MiRealSource-MiMLS
- 2009-12-22 Listing Removed — MiRealSource-MiMLS
- 2009-12-09 Listed $9,900 REALCOMP
- 2009-12-09 Listed $9,900 MiRealSource-MiMLS
- 2000-12-21 Sold (Public Records) $65,835 Public Records
- 1996-08-15 Sold (Public Records) $40,000 Public Records
- 1996-06-04 Sold (MLS) $40,000 MiRealSource-MiMLS
- 1996-05-20 Listing Removed — MiRealSource-MiMLS
- 1996-04-21 Listed $44,900 MiRealSource-MiMLS
Property tax history
+6.5%/yrLatest (2025): $2,565 · -23.4% YoY. Source: county tax records.
Cash-flow waterfall
monthlySold comps — $/sqft
last 12 mo · ≤1 miLoading sold comps…