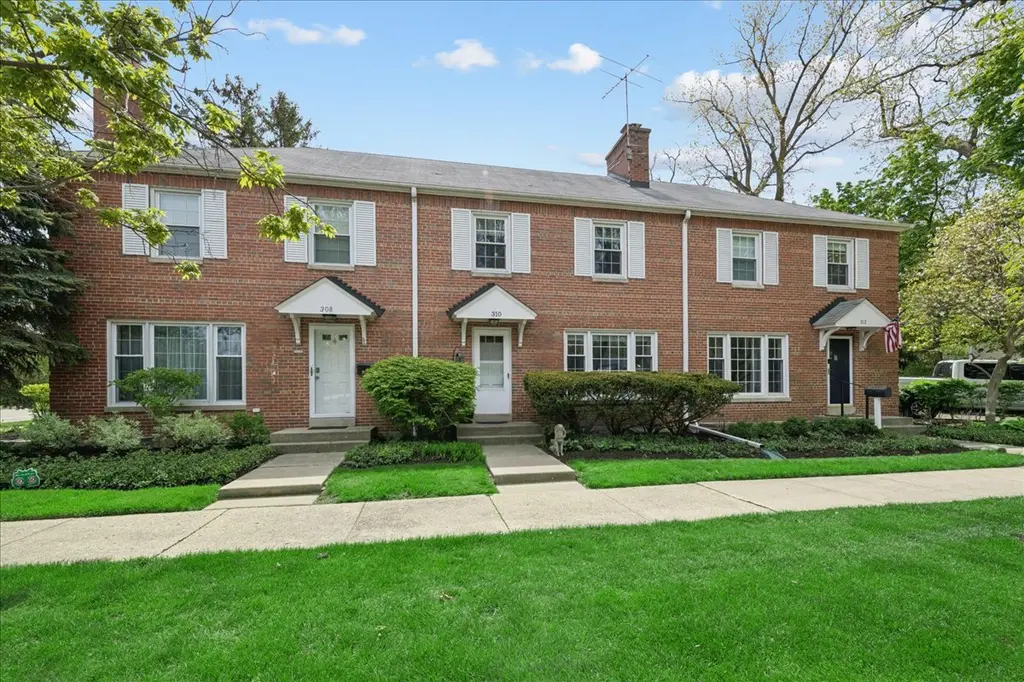
310 Jackson Ave · Glencoe, IL
Flood risk 1/10 · Minimal
- FEMA flood zone
- X (unshaded)
- Chance of flooding over 30 yrs
- 0.0%
- Est. flood insurance / yr
- $507 – $1,088
Fire risk 1/10 · Minimal
- Est. fire insurance / yr
- $804 – $1,492
Heat risk 2/10 · Minimal
- Hot days now (above 98°F)
- 7 days/yr
- Hot days in 30 yrs
- 14 days/yr
Wind risk 2/10 · Minimal
- Chance of severe wind over 30 yrs
- 1.0%
Air-quality risk 3/10 · Minor
- Unhealthy air days now
- 4 days/yr
- Unhealthy air days in 30 yrs
- 4 days/yr
Risk factors via First Street. Map © Google.
Why this score? — see what drove the F grade
The composite is a weighted blend of 9 inputs, each scored 0–100. Each bar is that input's sub-score; the figure is the points it added to the 100-point composite (weight × sub-score).
- Schools +7.7/10.0
- ARV discount +7.5/15.0
- Cash flow +5.4/30.0
- Livability +4.0/5.0
- Rent growth +2.5/5.0
- Condition / age +2.5/5.0
- 1% rule +1.8/10.0
- DSCR +0.0/10.0
- Appreciation +0.0/10.0
$385,000
🖨 Deal sheet 📄 Offer letter ✓ Due diligence
Listing remarks MLS
ATTRACTIVE BRICK TOWNHOME JUST NORTH OF HUBBARD WOODS, NEAR METRA, OVERLOOKING PARK; IMMEDIATE OCCUPANCEY; FINISHED LOWER LEVEL AND BONUS FINISHED LOFT ON 3RD FLOOR W/ SKY LIGHT. CHARMING TRADITIONAL DETAILS INCLUDE WOOD-BURNING FIREPLACE, HARDWOOD FLOORS, MOLDINGS; APPROX 1700 SQ FT OF LIVING SPACE; CENTRAL AIR; SHOWS BEAUTIFULLY. LOW ASSESSMENT AND TAXES.
Key facts
- Brick townhome
- Attic loft
- Gas range
Tags
Neighborhood map
What this means for you Summary
Snapshot
- This is a 2-bed/2.0-bath townhouse listed at $385k.
Deal economics
- At list price, monthly cash flow is $-834 ($-10k/yr) — negative.
- To cash-flow at today's rent, offer at most $238k (38.3% below list).
- To meet the 1% rule (rent ≥ 1% of price), the offer needs to be $264k (31.5% below list).
- Recommended offer: $238k (38.3% below list) — sets the bar for cash-flow.
- Cap rate 3.7% vs local median 1.6% in Glencoe — top-decile yield for the area; either an underpriced asset or a hidden risk that comps aren't pricing in. Stress-test before assuming the spread holds.
Location & tenants
- Location reads 79/100 on livability (#119 in IL, #2,064 nationally) — a middle-class / working-renter tenant base. Strengths: schools A+, crime A+, commute A+; Watch: amenities D+, cost of living F.
- New Trier Twp Hsd 203 (suburban): math 76% / reading 80% proficiency, ranked #2 of 620 in IL (top 0%) — strong family-tenant draw, lease renewals of 3-5y typical.
- Market conditions: 41 active listings in the ZIP; 40 comparable units currently listed for rent nearby; rentals at typical pace (median 18d on market — plan ~3-4 weeks tenant-placement turnaround); 6,272 units permitted in Cook County in 2024 (4,658 in 5+ unit buildings).
Forward outlook
- Local home prices are declining (-3.0%/yr); year-one equity from $3k of loan paydown is wiped out by about $12k of value loss. Plan a longer hold.
Negotiation context
- Only 8 days on market — expect competitive offers; lowballing is unlikely to land.
- Current owner paid $270k; 43% above their basis — modest negotiation headroom, anchor on the comps not their cost.
Risks & watch-outs
- Watch-outs: built in 1948 — expect roof / HVAC / electrical / plumbing capex.
Questions for the listing agent
- What do current leases actually rent for vs. the listed asking? Can we see a recent rent roll and the last 12 months of T-12 income?
- Built in 1948 — when were the roof, HVAC, electrical panel, plumbing, and water heater last replaced?
- What does the HOA fee cover, when was the last increase, and are there any pending special assessments or reserve-fund shortfalls?
- Is there a deadline driving the sale (1031 exchange, divorce, estate, relocation)? That informs how much negotiation room exists.
- Schools are A-rated — typically a magnet for longer-tenancy family renters. What's the average tenant stay here, and is there a school-zone premium baked into asking?
- The area grade is low — what's the realistic commute time and amenity access for the typical tenant pool here? Any planned neighborhood developments (good or bad) we should know about?
- What's the average days-on-market for RENTAL listings here right now (not sales)? A rising rental-DOM trend means longer vacancies and softer asking-rent achievability than the comps imply.
- What's the recent tenant-quality profile in this submarket — average credit score on applications, eviction rate, late-payment / NSF rate, and stable-employment percentage? A property-management company in the area should have these aggregated.
- How much new for-sale + rental construction is in the pipeline within 1–3 miles? Heavy new supply typically softens prices + rents 12–24 months out; constrained supply supports both.
Investment metrics
- 1% rule
- 0.68% ✗
- Cap rate
- 3.69%
- Cash-on-cash
- -9.29%
- DSCR
- 0.59
- GRM
- 12.2
CMA / ARV
No comps found within radius.
Show comp detail 12 sales within ~0.75 mi
| Address | Dist | Beds/Ba | Sqft | Sold | Price | $/sf | Match |
|---|---|---|---|---|---|---|---|
| 146 Green Bay Rd #1 | 0.10mi | 2/2.0 | 1,150 | 4mo | $340,000 | $296 | 80 |
| 312 Jackson Ave | 0.00mi | 2/1.0 | 1,464 | 9mo | $330,000 | $225 | 76 |
| 148 Green Bay Rd #1 | 0.11mi | 2/2.0 | 1,200 | 16mo | $260,000 | $217 | 69 |
| 1101 Merrill St Unit M1 | 0.36mi | 2/1.0 | — | 8mo | $261,000 | — | 60 |
| 78 Linden St | 0.24mi | 3/2.5 (+1) | 1,642 | 16mo | $714,000 | $435 | 56 |
| 400 Green Bay Rd #107 | 0.38mi | 2/1.0 | 800 | 13mo | $215,000 | $269 | 55 |
| 1099 Merril St #2 | 0.35mi | 1/1.0 (-1) | 627 | 16mo | $260,000 | $415 | 49 |
| 316 Adams Ave | 0.42mi | 2/1.5 | 1,100 | 22mo | $328,000 | $298 | 48 |
| 590 Green Bay Rd | 0.75mi | 2/1.5 | 1,200 | 5mo | $299,000 | $249 | 47 |
| 580 Green Bay Rd | 0.74mi | 2/1.5 | — | 8mo | $300,000 | — | 45 |
| 1095 Merril St Unit D2 | 0.36mi | 1/1.0 (-1) | — | 24mo | $210,000 | — | 42 |
| 312 South Ave | 0.58mi | 3/3.5 (+1) | 3,800 | 13mo | $1,150,000 | $303 | 39 |
Match score weights: distance 35% · size 25% · config 20% · recency 20%. Top-matched comps best support the ARV.
Projected returns pro-forma
-3.0% appreciation · 3.0% rent growth · sell at horizon
- IRR
- -32.8%
- Equity multiple
- -0.07×
- Total profit
- $-115,318
- Equity at exit
- $57,405
- IRR
- -38.5%
- Equity multiple
- -0.56×
- Total profit
- $-168,029
- Equity at exit
- $33,288
Cash invested: $107,800 (down + closing). Projections, not guarantees.
Landlord ↔ Tenant lean methodology
- Overall (STATE)
- 43 Moderately Tenant-Leaning
- State Illinois
- 43 Moderately Tenant-Leaning · D+7
- County
- — inherits STATE
- City
- — inherits STATE
ZIP-level market 60022
- Active inventory
- 41
- Price-to-rent
- 12.2×
Monthly cashflow live
- Estimated rent
- $2,636 high interval (Pro) →
- Mortgage (P&I)
- −$2,019
- Tax from tax record
- −$315 /mo · $3,780/yr
- Insurance
- −$160
- HOA
- −$422
- Vacancy / Maint / Mgmt
- −$554
- Net cashflow
- $-834
Break-even live
UW: 25.0% down · 7.5% · 30yr · 1.5% tax · 5.0% vac · 8.0% maint · 8.0% mgmt
Financing live
Cash to close
- Down payment
- $96,250
- Closing costs
- $11,550
- Reserves months
- —
- Total cash needed
- —
Loan-product check · same deal, 3 products live
Conventional
25% down · 7.5% · 30yr
- Down + closing
- —
- Monthly P&I
- —
- Monthly cashflow
- —
- DSCR
- —
- Eligible?
- —
Personal DTI + credit; lowest rate.
DSCR
20% down · 8.5% · 30yr
- Down + closing
- —
- Monthly P&I
- —
- Monthly cashflow
- —
- DSCR
- —
- Eligible?
- —
No personal income docs; deal must DSCR.
Hard money
10% down · 12.0% · 12mo
- Down + closing
- —
- Monthly P&I
- —
- Monthly cashflow
- —
- DSCR
- —
- Eligible?
- —
Short-term bridge; refi at stabilization.
Rent comps 40 comps
| Address | Beds | Baths | Sqft | Rent | $/sqft | DOM | Units | Dist |
|---|---|---|---|---|---|---|---|---|
| 158 Green Bay Rd Glencoe, IL | 3.0 | 2.0 | 1550 | $4,245 | $2.74 | 15d | 1 | 0.08mi |
| 158 Green Bay Rd Glencoe, IL | 3.0 | 2.0 | 1550 | $4,245 | $2.74 | 14d | 1 | 0.08mi |
| 158 Green Bay Rd Glencoe, IL | 3.0 | 2.5 | 1550 | $4,245 | $2.74 | 14d | 1 | 0.08mi |
| 918 Green Bay Rd Unit G5 Winnetka, IL | 1.0 | 1.0 | 700 | $1,930 | $2.76 | 7d | 1 | 0.50mi |
| 918 Green Bay Rd Unit 2L Winnetka, IL | 1.0 | 1.0 | 1000 | $1,895 | $1.90 | 15d | 1 | 0.50mi |
| 918 Green Bay Rd Unit 3G Winnetka, IL | 1.0 | 1.0 | 700 | $1,930 | $2.76 | 21d | 1 | 0.50mi |
| 918 Green Bay Rd Unit 3A Winnetka, IL | 1.0 | 1.0 | 700 | $1,795 | $2.56 | 15d | 1 | 0.50mi |
| 918 Green Bay Rd Unit DL2 Winnetka, IL | 1.0 | 1.0 | 700 | $1,845 | $2.64 | 7d | 1 | 0.50mi |
| 918 Green Bay Rd Unit 2 Winnetka, IL | 1.0 | 1.0 | 750 | $1,770 | $2.36 | 24d | 1 | 0.50mi |
| 918 Green Bay Rd Winnetka, IL | 1.0 | 1.0 | 750 | $1,945 | $2.59 | 24d | 1 | 0.50mi |
| 918 Green Bay Rd Unit 2L Winnetka, IL | 1.0 | 1.0 | 750 | $1,895 | $2.53 | 24d | 1 | 0.50mi |
| 918 Green Bay Rd Unit 2E Winnetka, IL | 1.0 | 1.0 | 700 | $1,845 | $2.64 | 24d | 1 | 0.50mi |
| 918 Green Bay Rd Unit 3A Winnetka, IL | 1.0 | 1.0 | 700 | $1,795 | $2.56 | 24d | 1 | 0.50mi |
| 918 Green Bay Rd Unit 2F Winnetka, IL | 1.0 | 1.0 | 700 | $1,595 | $2.28 | 24d | 1 | 0.50mi |
| 918 Green Bay Rd Unit 3G Winnetka, IL | 1.0 | 1.0 | — | $1,930 | — | 14d | 1 | 0.50mi |
| 918 Green Bay Rd Unit 3G Winnetka, IL | 1.0 | 1.0 | 750 | $1,930 | $2.57 | 24d | 1 | 0.50mi |
| 918 Green Bay Rd Unit 2F Winnetka, IL | 1.0 | 1.0 | 700 | $1,595 | $2.28 | 15d | 1 | 0.50mi |
| 918 Green Bay Rd Unit 2E Winnetka, IL | 1.0 | 1.0 | 750 | $1,945 | $2.59 | 17d | 1 | 0.50mi |
| 918 Green Bay Rd Unit 3E Winnetka, IL | 1.0 | 1.0 | 700 | $1,770 | $2.53 | 15d | 1 | 0.50mi |
| 918 Green Bay Rd Unit 3G Winnetka, IL | 1.0 | 1.0 | 700 | $1,930 | $2.76 | 15d | 1 | 0.50mi |
| 916 Green Bay Rd Winnetka, IL | 1.0 | 1.0 | — | $1,930 | — | 24d | 1 | 0.50mi |
| 916 Green Bay Rd Unit 918-2L Winnetka, IL | 1.0 | 1.0 | — | $1,770 | — | 24d | 1 | 0.50mi |
| 913 Green Bay Rd Unit E3 Winnetka, IL | 1.0 | 1.0 | — | $1,945 | — | 24d | 1 | 0.51mi |
| 913 Green Bay Rd Unit A4 Winnetka, IL | 1.0 | 1.0 | — | $1,795 | — | 24d | 1 | 0.52mi |
| 913 Green Bay Rd Unit F3 Winnetka, IL | 1.0 | 1.0 | — | $1,595 | — | 24d | 1 | 0.52mi |
| 913 Green Bay Rd Unit E4 Winnetka, IL | 1.0 | 1.0 | — | $1,770 | — | 15d | 1 | 0.52mi |
| 913 Green Bay Rd Unit L2 Winnetka, IL | 1.0 | 1.0 | — | $1,845 | — | 14d | 1 | 0.52mi |
| 913 Green Bay Rd Unit G4 Winnetka, IL | 1.0 | 1.0 | — | $1,930 | — | 24d | 1 | 0.52mi |
| 909 Green Bay Rd Unit 2S Winnetka, IL | 2.0 | 1.0 | 771 | $2,000 | $2.59 | 24d | 1 | 0.52mi |
| 368 Hazel Ave Unit A2 Glencoe, IL | 1.0 | 1.0 | — | $1,950 | — | 24d | 1 | 0.86mi |
| 373 Hazel Ave Glencoe, IL | 1.0 | 1.0 | — | $1,950 | — | 24d | 1 | 0.90mi |
| 338 Park Ave Unit 30 Glencoe, IL | 1.0 | 1.0 | — | $1,750 | — | 17d | 1 | 0.96mi |
| 338 Park Ave Unit 70 Glencoe, IL | 1.0 | 1.0 | — | $1,695 | — | 17d | 1 | 0.96mi |
| 342 Park Ave Unit 3 Glencoe, IL | 3.0 | 1.0 | — | $2,395 | — | 17d | 1 | 0.96mi |
| 343 Park Ave Glencoe, IL | 1.0 | 1.0 | — | $1,722 | — | 15d | 2 | 0.99mi |
| 343 Park Ave Glencoe, IL | 1.0 | 1.0 | — | $1,722 | — | 7d | 2 | 0.99mi |
| 343 Park Ave Glencoe, IL | 1.0 | 1.0 | — | $1,750 | — | 14d | 3 | 0.99mi |
| 343 Park Ave Glencoe, IL | 1.0 | 1.0 | 700 | $1,850 | $2.64 | 17d | 4 | 0.99mi |
| 343 Park Ave Glencoe, IL | 1.0 | 1.0 | — | $1,750 | — | 6d | 3 | 0.99mi |
| 353 Park Ave Glencoe, IL | 3.0 | 1.0 | — | $3,395 | — | 6d | 1 | 0.99mi |
HOA detail
- Monthly dues
- $422 · $5,064/yr
Listing history 15 events
-
2026-06-18days on market $385,000 Active 8 DOM
-
2026-06-17days on market $385,000 Active 7 DOM
-
2026-06-16days on market $385,000 Active 6 DOM
-
2026-06-15days on market $385,000 Active 5 DOM
-
2026-06-13days on market $385,000 Active 3 DOM
-
2026-06-13pricestatusdays on market $385,000 Active 2 DOM
-
2026-05-12status Active Under Contract
-
2008-02-25soldstatus $270,000 359-char remark
Show marketing remark (359 chars)
ATTRACTIVE BRICK TOWNHOME JUST NORTH OF HUBBARD WOODS, NEAR METRA, OVERLOOKING PARK; IMMEDIATE OCCUPANCEY; FINISHED LOWER LEVEL AND BONUS FINISHED LOFT ON 3RD FLOOR W/ SKY LIGHT. CHARMING TRADITIONAL DETAILS INCLUDE WOOD-BURNING FIREPLACE, HARDWOOD FLOORS, MOLDINGS; APPROX 1700 SQ FT OF LIVING SPACE; CENTRAL AIR; SHOWS BEAUTIFULLY. LOW ASSESSMENT AND TAXES.
-
2008-02-12historical 359-char remark
Show marketing remark (359 chars)
ATTRACTIVE BRICK TOWNHOME JUST NORTH OF HUBBARD WOODS, NEAR METRA, OVERLOOKING PARK; IMMEDIATE OCCUPANCEY; FINISHED LOWER LEVEL AND BONUS FINISHED LOFT ON 3RD FLOOR W/ SKY LIGHT. CHARMING TRADITIONAL DETAILS INCLUDE WOOD-BURNING FIREPLACE, HARDWOOD FLOORS, MOLDINGS; APPROX 1700 SQ FT OF LIVING SPACE; CENTRAL AIR; SHOWS BEAUTIFULLY. LOW ASSESSMENT AND TAXES.
-
2007-11-19$299,000 359-char remark
Show marketing remark (359 chars)
ATTRACTIVE BRICK TOWNHOME JUST NORTH OF HUBBARD WOODS, NEAR METRA, OVERLOOKING PARK; IMMEDIATE OCCUPANCEY; FINISHED LOWER LEVEL AND BONUS FINISHED LOFT ON 3RD FLOOR W/ SKY LIGHT. CHARMING TRADITIONAL DETAILS INCLUDE WOOD-BURNING FIREPLACE, HARDWOOD FLOORS, MOLDINGS; APPROX 1700 SQ FT OF LIVING SPACE; CENTRAL AIR; SHOWS BEAUTIFULLY. LOW ASSESSMENT AND TAXES.
-
2002-10-01soldstatus $265,000
-
1998-04-20soldstatus $140,000
-
1991-10-31soldstatus $129,500
-
1986-07-03soldstatus $90,000
-
1983-09-19soldstatus $70,000
ⓘ Source: listings_history table (triggers on properties + properties_extension) + one-shot
backfill from property_details.listing_events for pre-trigger history.
Tax reassessment forecast IL · Partial reset (capped growth)
- Current annual tax
- $3,780 · $315/mo
- Projected year-2 tax
- $6,260 · $522/mo
- Expected delta
- +$2,480/yr (+$207/mo · 65.6%)
ⓘ Screening estimate from a state-policy table — verify with the county assessor before closing.
Climate risk First Street
- Flood 1/10 Low FEMA zone X (unshaded) · 0% chance over 30 yrs
- Wildfire 1/10 Low
- Heat 2/10 Low 7 d/yr ≥98°F today · 14 d/yr by 30 yrs out
- Wind 2/10 Low 100% chance of damaging wind over 30 yrs
- Air quality 3/10 Moderate 4 unhealthy d/yr today · 4 by 30 yrs out
Nearby sold comps map
Loading sold comps map…
Walkable amenities ~0.75 mi
Loading nearby amenities…
Taxation est. · year 1
- Rental income
- $31,629
- − Mortgage interest
- −$21,566
- − Property taxes
- −$3,780
- − Insurance
- −$1,925
- − Repairs & maintenance
- −$2,530
- − Management
- −$2,530
- − HOA
- −$5,064
- − Depreciation
- −$11,200
- Taxable loss
- −$16,967
- Est. tax savings @ 24.0%
- +$4,072
- After-tax cash flow
- $-5,938/yr
For passive investors: Depreciation is non-cash, so a rental often shows a tax loss while cash-flowing — sheltering income. Rental losses are passive: they offset passive income freely, and up to $25,000/yr can offset ordinary (W-2) income if you actively participate and your MAGI is under $100k (phasing out to $0 by $150k); unused losses carry forward. On sale, claimed depreciation is recaptured at up to 25%, and gains may owe capital-gains tax (a 1031 exchange can defer both). Figures are a year-1 estimate at your 24.0% rate — not tax advice; consult a CPA.
Schools (NCES district)
- District
- New Trier Twp Hsd 203
- NCES district ID
- 1728200
- Math proficiency
- 76% ▼ -4.00%
- Reading proficiency
- 80% ▼ -1.00%
- Median HH income
- $164,521
- Composite
- 76.94/100
- National rank
- #103
- State rank
- #2 of 620 in IL
Livability — Glencoe
- Score
- 79/100
- State rank
- #119
- US rank
- #2064
Category grades
Schools grade is shown separately in the Schools card above.
Census & demographics
- Census place
- Glencoe, IL
- City population
- 8,415
- Population (ZIP)
- 8,415
Population outlook (Cook County) Hauer SSP2
- Today (2025)
- 5,347,519 people
- By 2030
- 5,357,703 · +0.2%
- By 2040
- 5,324,924 · -0.4%
- By 2050
- 5,230,762 · -2.2%
- By 2075
- 4,785,735 · -10.5%
- By 2100
- 4,188,836 · -21.7%
Race, ethnicity, and origin ACS 2023
- Neighborhood character
- Predominantly White (93%)
- Race & ethnicity
- White 93% Two or more races 2% Hispanic / Latino 2% Black 2% Asian 2%
- Common ancestry
- Scotch-Irish 14% Romanian 7% Subsaharan African 3%
- Foreign-born
- 6% · Canada, Jamaica, South Korea
- Languages at home
- 93% English-only · Russian/Polish/Slavic 2% Spanish 1% French/Haitian/Cajun 1%
Political lean MEDSL · Cook
- 2024 margin
- Solid D (+42.0) · D 70.4% · R 28.4% · Other 1.2%
- 2008→2024 swing
- -11.4pp toward R · 2008: 53.4pp · 2024: 42.0pp
- All cycles
- 2024: D+42.0 2020: D+50.3 2016: D+53.0 2012: D+49.4 2008: D+53.4
Not yet ingested
- Civics
- —
Market trends
- HPI YoY
- ▼ -177.44%
- Current HPI
- 188.4335
- Rent YoY
- —
- Metro
- —
- State GDP YoY
- ▲ 1.59%
- F500 in state
- 60
Industry mix (Fortune 500 HQ in IL)
| Industry | F500 HQs | Revenue |
|---|---|---|
| Insurance | 4 | $201B |
|
||
| Consumer Goods | 4 | $87B |
|
||
| Industrial Machinery | 3 | $64B |
|
||
| Healthcare | 2 | $55B |
|
||
| Retail / Pharmacy | 1 | $148B |
|
||
| Agriculture / Food | 1 | $86B |
|
||
Price history
+285.7% since first listed9 events — show timeline
- 2026-05-12 Pending — MRED as Distributed by MLS Grid
- 2008-02-25 Sold (MLS) $270,000 MRED as Distributed by MLS Grid
- 2008-02-12 Listing Removed — MRED as Distributed by MLS Grid
- 2007-11-19 Listed $299,000 MRED as Distributed by MLS Grid
- 2002-10-01 Sold (Public Records) $265,000 Public Records
- 1998-04-20 Sold (Public Records) $140,000 Public Records
- 1991-10-31 Sold (Public Records) $129,500 Public Records
- 1986-07-03 Sold (Public Records) $90,000 Public Records
- 1983-09-19 Sold (Public Records) $70,000 Public Records
Property tax history
+1.4%/yrLatest (2023): $3,780 · +13.5% YoY. Source: county tax records.
Cash-flow waterfall
monthlySold comps — $/sqft
last 12 mo · ≤1 miLoading sold comps…