 🏷️ Likely Rental
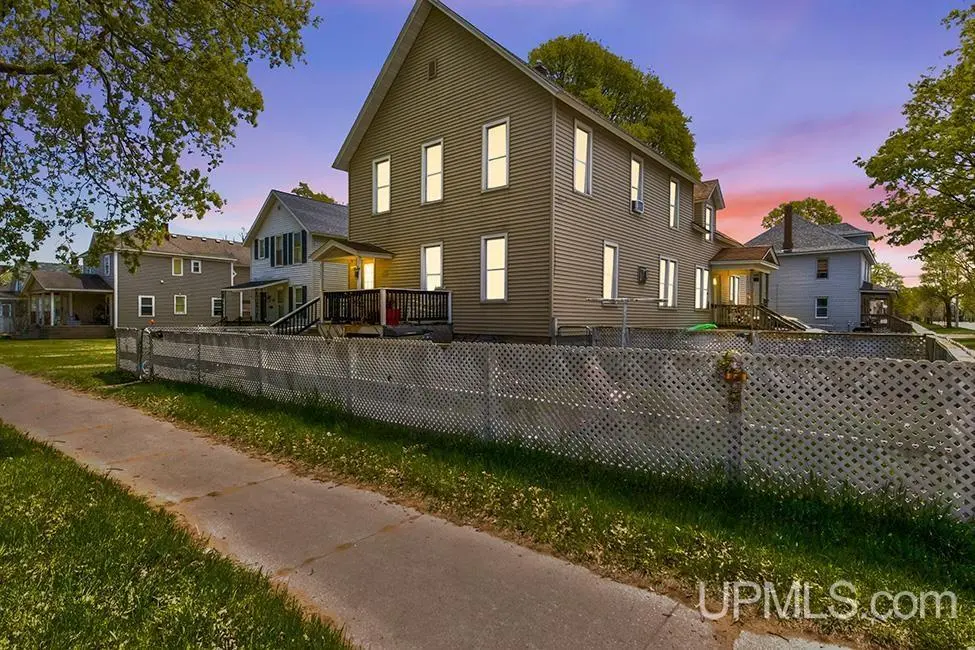
1321 S 1st Ave · Escanaba, MI
Flood risk No data
- FEMA flood zone
- —
- Chance of flooding over 30 yrs
- —
- Est. flood insurance / yr
- —
Fire risk No data
- Est. fire insurance / yr
- —
Heat risk No data
- Hot days now (above threshold)
- —
- Hot days in 30 yrs
- —
Wind risk No data
- Chance of severe wind over 30 yrs
- —
Air-quality risk No data
- Unhealthy air days now
- —
- Unhealthy air days in 30 yrs
- —
Risk factors via First Street. Map © Google.
Why this score? — see what drove the B grade
The composite is a weighted blend of 9 inputs, each scored 0–100. Each bar is that input's sub-score; the figure is the points it added to the 100-point composite (weight × sub-score).
- Cash flow +27.0/30.0
- ARV discount +15.0/15.0
- DSCR +9.4/10.0
- 1% rule +7.0/10.0
- Livability +3.8/5.0
- Schools +3.2/10.0
- Rent growth +2.5/5.0
- Condition / age +2.5/5.0
- Appreciation +0.0/10.0
$140,000
🖨 Deal sheet 📄 Offer letter ✓ Due diligence
Listing remarks MLS
Exceptional opportunity to own a spacious side-by-side duplex offering just over 3,000 square feet of living space, functionality, character, and income potential. The first unit features four bedrooms and one bathroom with all family gathering spaces conveniently located on the main level. A large foyer entrance welcomes you into an expansive living room, warm dining area with a cozy gas fireplace, and a nicely appointed kitchen with access to its own private basement complete with laundry and storage space. The second unit offers three bedrooms and one bathroom and is currently occupied by a long-term tenant, providing immediate rental income. The main floor hosts comfortable gathering spaces including a spacious dining area, landing space, and kitchen, while all three bedrooms and the bathroom are located upstairs for added privacy. This unit also features its own separate basement with laundry and additional storage. Whether you are looking to expand your investment portfolio or occupy one side while generating rental income from the other, this large duplex presents endless potential.
Key facts
- 4,356 sq ft lot
- 3 parking spots
- Built 1906
Property features AI
Finance
- Financial info: Two-unit building with both units occupied; Unit 1 rent: $1,050 per month; Unit 2 rent: $900 per month; Month-to-month leases; pets allowed
- HOA & community: Landlord pays taxes
Exterior
- Parking: Paved driveway with 3 or more spaces
- Utilities: Public water; Public sanitary sewer; Electricity connected (circuit breakers); Natural gas connected; Cable available
- Home design: Multi-family property (1 to 4 units); 2-story conventional frame; Built in 1906; Residential zoning
- Construction: Basement foundation
- Exterior features: Vinyl siding and vinyl trim; Owned fence; Sidewalks; Corner lot on a main street; City location with paved, curbed streets and year-round access
Interior
- Kitchen: Range/oven; Refrigerator; Formal dining room
- Bedrooms: Multiple bedrooms located on the second floor (unit-level details indicate bedrooms on second floor for both units)
- Flooring: Hardwood; Concrete (noted for a bedroom)
- Bathrooms: 2 full bathrooms (total)
- Heating & cooling: Forced air heating; Ceiling fan(s); Natural gas fuel
- Interior features: Fireplace (gas, located in dining room); Cable/Internet available; Hardwood floors; Living room
- Laundry & utility: Full poured basement; Separate utilities for units (separate heat, water, electric); Gas water heater
Neighborhood map
What this means for you Summary
Snapshot
- This is a 4-bed/2.0-bath single-family listed at $140k.
Deal economics
- At list price, monthly cash flow is $393 ($5k/yr) — positive.
- The deal already cash-flows at list — no discount required.
- Meets the 1% rule at list price ($2k rent vs $140k).
- Cap rate 9.7% vs local median 4.9% in Escanaba — top-decile yield for the area; either an underpriced asset or a hidden risk that comps aren't pricing in. Stress-test before assuming the spread holds.
Location & tenants
- Location reads 75/100 on livability (#161 in MI, #4,089 nationally) — a middle-class / working-renter tenant base. Strengths: amenities A+, cost of living A+, housing A+; Watch: crime D+, commute F, employment F.
- Escanaba Area Public Schools (town): math 31% / reading 46% proficiency, ranked #243 of 540 in MI (top 45%) — families likely to look elsewhere, expect single-tenant / working-renter base with shorter leases.
- Market conditions: 63 active listings in the ZIP; 38 units permitted in Delta County in 2024 (0 in 5+ unit buildings).
Forward outlook
- Local home prices are declining (-3.0%/yr); year-one equity from $968 of loan paydown is wiped out by about $4k of value loss. Plan a longer hold.
- Delta County population projected at -22% by 2050 — secular population decline; favor cash flow + early exit over multi-decade hold.
- At projected returns (-3.0% appreciation + 3.0% rent growth), your $39k cash investment doubles in ~10 years — after that, you're playing with house money.
Negotiation context
- Only 7 days on market — expect competitive offers; lowballing is unlikely to land.
- 2 sale attempts with the ask held roughly flat each time — persistent listings suggest the price (not the market) is what's stuck; bring a comps-based counter.
- Current owner paid $41k; list at $140k implies a 243% gain — meaningful room to come down on a strong offer.
Risks & watch-outs
- Watch-outs: built in 1906 — expect roof / HVAC / electrical / plumbing capex.
Questions for the listing agent
- Built in 1906 — when were the roof, HVAC, electrical panel, plumbing, and water heater last replaced?
- Is there a deadline driving the sale (1031 exchange, divorce, estate, relocation)? That informs how much negotiation room exists.
- Schools are B-rated — typically a magnet for longer-tenancy family renters. What's the average tenant stay here, and is there a school-zone premium baked into asking?
- Crime grade is D in this area — have there been break-ins, vandalism, or insurance claims at this property in the last 3 years? What carrier currently insures it and at what premium?
- What's the average days-on-market for RENTAL listings here right now (not sales)? A rising rental-DOM trend means longer vacancies and softer asking-rent achievability than the comps imply.
- What's the recent tenant-quality profile in this submarket — average credit score on applications, eviction rate, late-payment / NSF rate, and stable-employment percentage? A property-management company in the area should have these aggregated.
- How much new for-sale + rental construction is in the pipeline within 1–3 miles? Heavy new supply typically softens prices + rents 12–24 months out; constrained supply supports both.
Investment metrics
- 1% rule
- 1.20% ✓
- Cap rate
- 9.66%
- Cash-on-cash
- 12.03%
- DSCR
- 1.54
- GRM
- 6.9
CMA / ARV
- ARV (on-the-fly)
- $230,888
- Comps found
- 3
Show comp detail 3 sales within ~0.75 mi
| Address | Dist | Beds/Ba | Sqft | Sold | Price | $/sf | Match |
|---|---|---|---|---|---|---|---|
| 512 S 13th St | 0.29mi | 4/2.0 | 3,032 (-0%) | 22mo | $229,000 | $76 | 68 |
| 702 S 12th St | 0.44mi | 5/2.0 (+1) | 3,130 (+3%) | 23mo | $220,000 | $70 | 50 |
| 420 S Lake Shore Dr | 0.69mi | 4/3.5 | 2,658 (-12%) | 24mo | $670,000 | $252 | 21 |
Match score weights: distance 35% · size 25% · config 20% · recency 20%. Top-matched comps best support the ARV.
Projected returns pro-forma
-3.0% appreciation · 3.0% rent growth · sell at horizon
- IRR
- 1.6%
- Equity multiple
- 1.06×
- Total profit
- $2,351
- Equity at exit
- $20,874
- IRR
- 11.2%
- Equity multiple
- 1.88×
- Total profit
- $34,301
- Equity at exit
- $12,105
Cash invested: $39,200 (down + closing). Projections, not guarantees.
Landlord ↔ Tenant lean methodology
- Overall (STATE)
- 62 Landlord-Friendly
- State Michigan
- 62 Landlord-Friendly · EVEN
- County
- — inherits STATE
- City
- — inherits STATE
ZIP-level market 49829
- Home prices YoY
- -25.6%
- Active inventory
- 63
- Price-to-rent
- 6.9×
Monthly cashflow live
- Estimated rent
- $1,682 medium interval (Pro) →
- Mortgage (P&I)
- −$734
- Tax from tax record
- −$143 /mo · $1,714/yr
- Insurance
- −$58
- HOA
- −$0
- Vacancy / Maint / Mgmt
- −$353
- Net cashflow
- $393
Break-even live
UW: 25.0% down · 7.5% · 30yr · 1.5% tax · 5.0% vac · 8.0% maint · 8.0% mgmt
Financing live
Cash to close
- Down payment
- $35,000
- Closing costs
- $4,200
- Reserves months
- —
- Total cash needed
- —
Loan-product check · same deal, 3 products live
Conventional
25% down · 7.5% · 30yr
- Down + closing
- —
- Monthly P&I
- —
- Monthly cashflow
- —
- DSCR
- —
- Eligible?
- —
Personal DTI + credit; lowest rate.
DSCR
20% down · 8.5% · 30yr
- Down + closing
- —
- Monthly P&I
- —
- Monthly cashflow
- —
- DSCR
- —
- Eligible?
- —
No personal income docs; deal must DSCR.
Hard money
10% down · 12.0% · 12mo
- Down + closing
- —
- Monthly P&I
- —
- Monthly cashflow
- —
- DSCR
- —
- Eligible?
- —
Short-term bridge; refi at stabilization.
Listing history 8 events
-
2026-06-04days on market $140,000 Active 7 DOM
-
2026-06-02days on market $140,000 Active 6 DOM
-
2026-06-01days on market $140,000 Active 5 DOM
-
2026-05-31days on market $140,000 Active 4 DOM
-
2026-05-31days on market $140,000 Active 3 DOM
-
2026-05-28$140,000 Active 1106-char remark
Show marketing remark (1106 chars)
Exceptional opportunity to own a spacious side-by-side duplex offering just over 3,000 square feet of living space, functionality, character, and income potential. The first unit features four bedrooms and one bathroom with all family gathering spaces conveniently located on the main level. A large foyer entrance welcomes you into an expansive living room, warm dining area with a cozy gas fireplace, and a nicely appointed kitchen with access to its own private basement complete with laundry and storage space. The second unit offers three bedrooms and one bathroom and is currently occupied by a long-term tenant, providing immediate rental income. The main floor hosts comfortable gathering spaces including a spacious dining area, landing space, and kitchen, while all three bedrooms and the bathroom are located upstairs for added privacy. This unit also features its own separate basement with laundry and additional storage. Whether you are looking to expand your investment portfolio or occupy one side while generating rental income from the other, this large duplex presents endless potential.
-
2026-05-26$140,000 Active 1106-char remark
Show marketing remark (1106 chars)
Exceptional opportunity to own a spacious side-by-side duplex offering just over 3,000 square feet of living space, functionality, character, and income potential. The first unit features four bedrooms and one bathroom with all family gathering spaces conveniently located on the main level. A large foyer entrance welcomes you into an expansive living room, warm dining area with a cozy gas fireplace, and a nicely appointed kitchen with access to its own private basement complete with laundry and storage space. The second unit offers three bedrooms and one bathroom and is currently occupied by a long-term tenant, providing immediate rental income. The main floor hosts comfortable gathering spaces including a spacious dining area, landing space, and kitchen, while all three bedrooms and the bathroom are located upstairs for added privacy. This unit also features its own separate basement with laundry and additional storage. Whether you are looking to expand your investment portfolio or occupy one side while generating rental income from the other, this large duplex presents endless potential.
-
2003-09-29soldstatus $40,800
ⓘ Source: listings_history table (triggers on properties + properties_extension) + one-shot
backfill from property_details.listing_events for pre-trigger history.
Tax reassessment forecast MI · Partial reset (capped growth)
- Current annual tax
- $1,714 · $143/mo
- Projected year-2 tax
- $1,935 · $161/mo
- Expected delta
- +$221/yr (+$18/mo · 12.9%)
ⓘ Screening estimate from a state-policy table — verify with the county assessor before closing.
Nearby sold comps map
Loading sold comps map…
Walkable amenities ~0.75 mi
Loading nearby amenities…
Taxation est. · year 1
- Rental income
- $20,178
- − Mortgage interest
- −$7,842
- − Property taxes
- −$1,714
- − Insurance
- −$700
- − Repairs & maintenance
- −$1,614
- − Management
- −$1,614
- − Depreciation
- −$4,073
- Taxable income
- $2,620
- Est. tax owed @ 24.0%
- −$629
- After-tax cash flow
- $4,087/yr
For passive investors: Depreciation is non-cash, so a rental often shows a tax loss while cash-flowing — sheltering income. Rental losses are passive: they offset passive income freely, and up to $25,000/yr can offset ordinary (W-2) income if you actively participate and your MAGI is under $100k (phasing out to $0 by $150k); unused losses carry forward. On sale, claimed depreciation is recaptured at up to 25%, and gains may owe capital-gains tax (a 1031 exchange can defer both). Figures are a year-1 estimate at your 24.0% rate — not tax advice; consult a CPA.
Schools (NCES district)
- District
- Escanaba Area Public Schools
- NCES district ID
- 2613500
- Math proficiency
- 31% ▼ -8.00%
- Reading proficiency
- 46% ▼ -1.00%
- Median HH income
- $37,187
- Composite
- 31.97/100
- National rank
- #5841
- State rank
- #243 of 540 in MI
Livability — Escanaba
- Score
- 75/100
- State rank
- #161
- US rank
- #4089
Category grades
Schools grade is shown separately in the Schools card above.
Census & demographics
- Census place
- Escanaba, MI
- Population (ZIP)
- 16,859
Population outlook (Delta County) Hauer SSP2
- Today (2025)
- 34,431 people
- By 2030
- 33,003 · -4.1%
- By 2040
- 29,748 · -13.6%
- By 2050
- 26,753 · -22.3%
- By 2075
- 20,962 · -39.1%
- By 2100
- 15,616 · -54.6%
Race, ethnicity, and origin ACS 2023
- Neighborhood character
- Predominantly White (88%)
- Race & ethnicity
- White 88% Two or more races 9% Hispanic / Latino 2% Native American 2%
- Common ancestry
- Lithuanian 14% Italian 4% Romanian 4%
- Foreign-born
- 1% · Canada
Political lean MEDSL · Delta
- 2024 margin
- Solid R (+30.4) · D 34.1% · R 64.5% · Other 1.4%
- 2008→2024 swing
- -36.7pp toward R · 2008: 6.3pp · 2024: -30.4pp
- All cycles
- 2024: R+30.4 2020: R+26.5 2016: R+25.4 2012: R+6.7 2008: D+6.3
Not yet ingested
- Civics
- —
Market trends
- HPI YoY
- ▼ -85.16%
- Current HPI
- 247.9676
- Rent YoY
- —
- Metro
- —
- State GDP YoY
- ▲ 1.37%
- F500 in state
- 28
Industry mix (Fortune 500 HQ in MI)
| Industry | F500 HQs | Revenue |
|---|---|---|
| Automotive Parts | 3 | $48B |
|
||
| Automotive | 2 | $372B |
|
||
| Chemicals | 1 | $45B |
|
||
| Automotive Retail | 1 | $29B |
|
||
| Healthcare / Medical Devices | 1 | $23B |
|
||
| Automotive Technology | 1 | $20B |
|
||
Price history
+243.1% since first listed3 events — show timeline
- 2026-05-28 Listed $140,000 UPAR
- 2026-05-26 Listed $140,000 MiRealSource-MiMLS
- 2003-09-29 Sold (Public Records) $40,800 Public Records
Property tax history
+1.2%/yrLatest (2025): $1,714 · -45.8% YoY. Source: county tax records.
Cash-flow waterfall
monthlySold comps — $/sqft
last 12 mo · ≤1 miLoading sold comps…