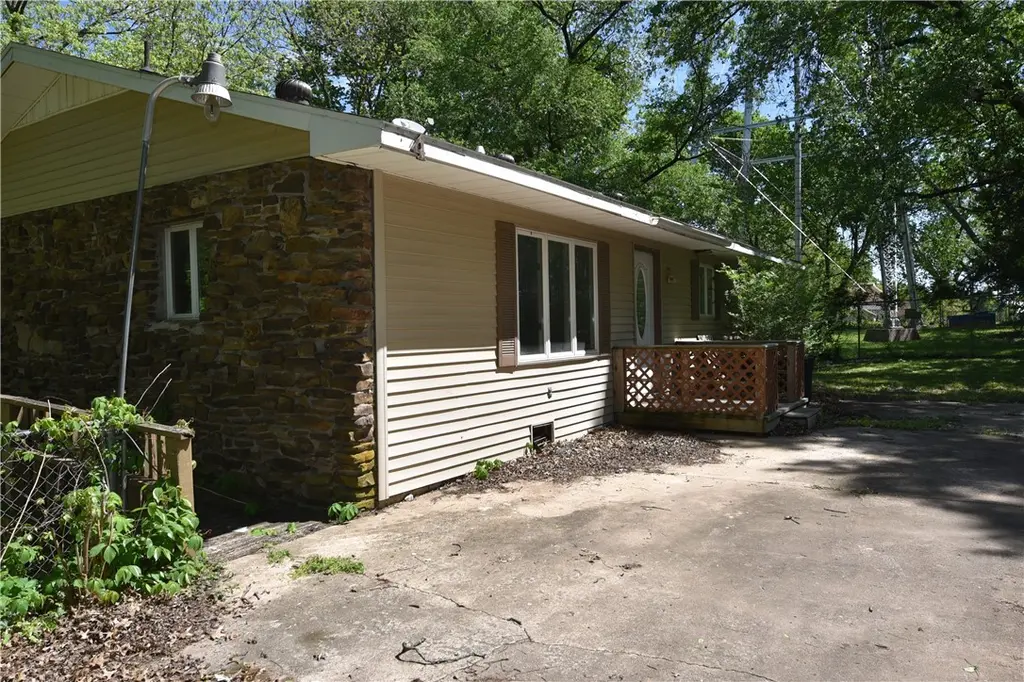
142 Patton St · Pea Ridge, AR
Flood risk 1/10 · Minimal
- FEMA flood zone
- X (unshaded)
- Chance of flooding over 30 yrs
- 0.0%
- Est. flood insurance / yr
- $507 – $1,088
Fire risk 5/10 · Moderate
- Est. fire insurance / yr
- $1,499 – $2,785
Heat risk 4/10 · Minor
- Hot days now (above 105°F)
- 7 days/yr
- Hot days in 30 yrs
- 21 days/yr
Wind risk 2/10 · Minimal
- Chance of severe wind over 30 yrs
- 2.0%
Air-quality risk 2/10 · Minimal
- Unhealthy air days now
- 1 days/yr
- Unhealthy air days in 30 yrs
- 1 days/yr
Risk factors via First Street. Map © Google.
Why this score? — see what drove the B- grade
The composite is a weighted blend of 9 inputs, each scored 0–100. Each bar is that input's sub-score; the figure is the points it added to the 100-point composite (weight × sub-score).
- Cash flow +19.8/30.0
- ARV discount +14.3/15.0
- Appreciation +8.7/10.0
- DSCR +6.3/10.0
- 1% rule +4.0/10.0
- Schools +3.7/10.0
- Livability +3.4/5.0
- Rent growth +2.5/5.0
- Condition / age +2.5/5.0
$199,000
🖨 Deal sheet 📄 Offer letter ✓ Due diligence
Listing remarks MLS
Located in the center of Pea Ridge, this property is close to every thing! Two lots included with (+/-) . 68 acres of beautiful cleared land. A fixer upper waiting for some TLC! Would be great as an investment or rental. Snag this property today!
Key facts
- 0.68 acre lot
- Garage
- Listed 36 days
Neighborhood map
What this means for you Summary
Snapshot
- This is a 3-bed/1.0-bath single-family listed at $199k.
Deal economics
- At list price, monthly cash flow is $238 ($3k/yr) — positive.
- The deal already cash-flows at list — no discount required.
- To meet the 1% rule (rent ≥ 1% of price), the offer needs to be $180k (9.5% below list).
- Recommended offer: $180k (9.5% below list) — sets the bar for 1% rule.
- Cap rate 7.7% vs local median 3.4% in Pea Ridge — top-decile yield for the area; either an underpriced asset or a hidden risk that comps aren't pricing in. Stress-test before assuming the spread holds.
Location & tenants
- Location reads 67/100 on livability (#98 in AR) — a middle-class / working-renter tenant base. Strengths: employment A+, housing A+, cost of living A-; Watch: amenities F, commute F.
- Pea Ridge School District (suburban): math 43% / reading 42% proficiency, ranked #43 of 238 in AR (top 18%) — families likely to look elsewhere, expect single-tenant / working-renter base with shorter leases.
- Market conditions: 423 active listings in the ZIP; 32 comparable units currently listed for rent nearby; rentals at typical pace (median 23d on market — plan ~3-4 weeks tenant-placement turnaround); 44% of comp listings sitting > 30 days — soft ceiling on asking rent; solid renter incomes; 4,359 units permitted in Benton County in 2024 (402 in 5+ unit buildings).
Forward outlook
- In year one you build about $16k of equity ($1k loan paydown + $15k appreciation (7.5% local appreciation)).
- Benton County population projected at +56% by 2050 — long-run rental-demand tailwind backs the buy-and-hold thesis.
- At projected returns (7.5% appreciation + 3.0% rent growth), your $56k cash investment doubles in ~3 years — after that, you're playing with house money.
- By year 3, paydown + projected appreciation supports a ~$40k cash-out refi (75% LTV) — recoverable capital for the next deal without selling this one.
Negotiation context
- It's been on market 36 days — a 3% lower offer ($193k) is reasonable based on typical stale-listing flexibility.
- Current owner paid $72k; list at $199k implies a 176% gain — meaningful room to come down on a strong offer.
Risks & watch-outs
- Climate carrying-cost: moderate wildfire risk — expect insurance premiums to compound above CPI over the hold.
Questions for the listing agent
- It's been on market 36 days. Have you received any prior offers? Is the seller open to a 10% concession, seller financing, or rate buy-down credit?
- Is there a deadline driving the sale (1031 exchange, divorce, estate, relocation)? That informs how much negotiation room exists.
- What's the average days-on-market for RENTAL listings here right now (not sales)? A rising rental-DOM trend means longer vacancies and softer asking-rent achievability than the comps imply.
- What's the recent tenant-quality profile in this submarket — average credit score on applications, eviction rate, late-payment / NSF rate, and stable-employment percentage? A property-management company in the area should have these aggregated.
- How much new for-sale + rental construction is in the pipeline within 1–3 miles? Heavy new supply typically softens prices + rents 12–24 months out; constrained supply supports both.
Investment metrics
- 1% rule
- 0.90% ✗
- Cap rate
- 7.73%
- Cash-on-cash
- 5.13%
- DSCR
- 1.23
- GRM
- 9.2
CMA / ARV
- ARV (median comp)
- $234,433
- List price
- $199,000
- Delta
- -15.11%
- Verdict
- UNDERPRICED
- Comps
- 20 within 1.0 mi
Show comp detail 12 sales within ~0.75 mi
| Address | Dist | Beds/Ba | Sqft | Sold | Price | $/sf | Match |
|---|---|---|---|---|---|---|---|
| 134 Mcculloch St | 0.14mi | 3/1.0 | 1,294 (-2%) | 1mo | $237,500 | $184 | 90 |
| 1051 Asboth St | 0.13mi | 2/1.5 (-1) | 1,392 (+6%) | 5mo | $215,000 | $154 | 73 |
| 940 Eagle Crest Dr | 0.44mi | 3/2.0 | 1,338 (+2%) | 1mo | $257,000 | $192 | 72 |
| 446 W Pickens Rd | 0.53mi | 3/1.5 | 1,300 (-1%) | 4mo | $216,000 | $166 | 68 |
| 117 Van Dorn St | 0.08mi | 3/2.0 | 1,486 (+13%) | 5mo | $165,000 | $111 | 67 |
| 465 Greene St | 0.39mi | 3/2.0 | 1,224 (-7%) | 1mo | $215,000 | $176 | 65 |
| 522 Lee Town Dr | 0.49mi | 2/1.5 (-1) | 1,284 (-2%) | 1mo | $246,900 | $192 | 65 |
| 360 Benton Dr | 0.57mi | 3/2.0 | 1,270 (-4%) | 0mo | $263,000 | $207 | 63 |
| 1893 Hayden Rd | 0.68mi | 3/2.0 | 1,304 (-1%) | 2mo | $254,900 | $195 | 61 |
| 339 Davis St | 0.43mi | 4/1.5 (+1) | 1,431 (+9%) | 2mo | $220,000 | $154 | 57 |
| 2018 Hayden Rd | 0.75mi | 3/1.5 | 1,260 (-4%) | 2mo | $225,000 | $179 | 54 |
| 106 Henry Little Cir | 0.73mi | 3/1.5 | 1,410 (+7%) | 1mo | $275,000 | $195 | 51 |
Match score weights: distance 35% · size 25% · config 20% · recency 20%. Top-matched comps best support the ARV.
Projected returns pro-forma
7.48% appreciation · 3.0% rent growth · sell at horizon
- IRR
- 22.8%
- Equity multiple
- 2.62×
- Total profit
- $90,449
- Equity at exit
- $144,159
- IRR
- 21.0%
- Equity multiple
- 5.50×
- Total profit
- $250,960
- Equity at exit
- $279,700
Cash invested: $55,720 (down + closing). Projections, not guarantees.
Landlord ↔ Tenant lean methodology
- Overall (STATE)
- 92 Strongly Landlord-Friendly
- State Arkansas
- 92 Strongly Landlord-Friendly · R+14
- County
- — inherits STATE
- City
- — inherits STATE
ZIP-level market 72751
- Home prices YoY
- 2.2%
- Active inventory
- 423
- Price-to-rent
- 9.2×
Monthly cashflow live
- Estimated rent
- $1,801 high interval (Pro) →
- Mortgage (P&I)
- −$1,044
- Tax from tax record
- −$58 /mo · $695/yr
- Insurance
- −$83
- HOA
- −$0
- Vacancy / Maint / Mgmt
- −$378
- Net cashflow
- $238
Break-even live
UW: 25.0% down · 7.5% · 30yr · 1.5% tax · 5.0% vac · 8.0% maint · 8.0% mgmt
Financing live
Cash to close
- Down payment
- $49,750
- Closing costs
- $5,970
- Reserves months
- —
- Total cash needed
- —
Loan-product check · same deal, 3 products live
Conventional
25% down · 7.5% · 30yr
- Down + closing
- —
- Monthly P&I
- —
- Monthly cashflow
- —
- DSCR
- —
- Eligible?
- —
Personal DTI + credit; lowest rate.
DSCR
20% down · 8.5% · 30yr
- Down + closing
- —
- Monthly P&I
- —
- Monthly cashflow
- —
- DSCR
- —
- Eligible?
- —
No personal income docs; deal must DSCR.
Hard money
10% down · 12.0% · 12mo
- Down + closing
- —
- Monthly P&I
- —
- Monthly cashflow
- —
- DSCR
- —
- Eligible?
- —
Short-term bridge; refi at stabilization.
Rent comps 32 comps
| Address | Beds | Baths | Sqft | Rent | $/sqft | DOM | Units | Dist |
|---|---|---|---|---|---|---|---|---|
| 585 Lynn Dr Pea Ridge, AR | 3.0 | 2.0 | 1804 | $1,650 | $0.91 | 43d | 1 | 0.29mi |
| 521 W Pickens Rd Pea Ridge, AR | 3.0 | 2.5 | 1500 | $1,600 | $1.07 | 14d | 1 | 0.52mi |
| 533 W Pickens Rd Pea Ridge, AR | 3.0 | 2.5 | 1500 | $1,600 | $1.07 | 14d | 1 | 0.53mi |
| 547 W Pickens Rd Pea Ridge, AR | 3.0 | 2.5 | 1500 | $1,600 | $1.07 | 14d | 1 | 0.53mi |
| 575 W Pickens Rd Pea Ridge, AR | 3.0 | 2.5 | 1500 | $1,600 | $1.07 | 43d | 1 | 0.54mi |
| 581 W Pickens Rd Pea Ridge, AR | 3.0 | 2.5 | 1500 | $1,600 | $1.07 | 43d | 1 | 0.55mi |
| 890 Choate Place Cir Pea Ridge, AR | 3.0 | 2.0 | 1820 | $1,900 | $1.04 | 43d | 1 | 0.62mi |
| 200 Ryan Rd Pea Ridge, AR | 1.0–2.0 | 1.0–2.0 | 895 | $1,405 | $1.57 | 13d | 18 | 0.66mi |
| 1713 Cuppett Cir Pea Ridge, AR | 3.0 | 2.5 | 1503 | $1,650 | $1.10 | 23d | 1 | 0.67mi |
| 1711 Cuppett Cir Pea Ridge, AR | 3.0 | 2.5 | 1604 | $1,750 | $1.09 | 23d | 1 | 0.67mi |
| 1703 Booker Cir Pea Ridge, AR | 3.0 | 2.0 | 1056 | $1,525 | $1.44 | 14d | 1 | 0.73mi |
| 1914 Booker Cir Pea Ridge, AR | 2.0 | 2.0 | 1052 | $1,525 | $1.45 | 21d | 1 | 0.74mi |
| 1723 Booker Cir Pea Ridge, AR | 3.0 | 2.0 | 1056 | $1,650 | $1.56 | 23d | 1 | 0.78mi |
| 1393 Hutchinson St Pea Ridge, AR | 3.0 | 2.0 | 1580 | $1,675 | $1.06 | 43d | 1 | 0.78mi |
| 1803 Booker Cir Pea Ridge, AR | 3.0 | 2.0 | 1056 | $1,525 | $1.44 | 14d | 1 | 0.79mi |
| 1801 Booker Cir Pea Ridge, AR | 3.0 | 2.0 | 1056 | $1,525 | $1.44 | 43d | 1 | 0.79mi |
| 1735 Booker Cir Pea Ridge, AR | 3.0 | 2.0 | 1056 | $1,525 | $1.44 | 21d | 1 | 0.80mi |
| 536 Lewis St Pea Ridge, AR | 3.0 | 2.0 | 1649 | $1,995 | $1.21 | 21d | 1 | 0.85mi |
| 801 Lewis St Pea Ridge, AR | 3.0 | 2.0 | 1744 | $2,000 | $1.15 | 13d | 1 | 0.87mi |
| 112 Alder St Pea Ridge, AR | 3.0 | 2.0 | 1350 | $1,625 | $1.20 | 44d | 1 | 0.93mi |
| 308 Alder St Pea Ridge, AR | 3.0 | 2.0 | 1425 | $1,625 | $1.14 | 43d | 1 | 1.01mi |
| 308 Alder St Pea Ridge, AR | 3.0 | 2.0 | 1425 | $1,625 | $1.14 | 23d | 1 | 1.01mi |
| 1812 Seay Cir Pea Ridge, AR | 4.0 | 2.5 | 1854 | $1,900 | $1.02 | 44d | 1 | 1.08mi |
| 938 Seaborn Way Pea Ridge, AR | 3.0 | 2.5 | 1750 | $1,650 | $0.94 | 23d | 1 | 1.09mi |
| 938 Seaborn Way Pea Ridge, AR | 3.0 | 2.5 | 1750 | $1,650 | $0.94 | 43d | 1 | 1.09mi |
| 940 Seaborn Way Pea Ridge, AR | 3.0 | 2.5 | 1750 | $1,650 | $0.94 | 43d | 1 | 1.10mi |
| 942 Seaborn Way Pea Ridge, AR | 3.0 | 2.5 | 1750 | $1,650 | $0.94 | 43d | 1 | 1.10mi |
| 1002 Seaborn Way Pea Ridge, AR | 3.0 | 2.0 | 1750 | $1,650 | $0.94 | 43d | 1 | 1.12mi |
| 1400 Hickery St Pea Ridge, AR | 3.0 | 2.0 | 1400 | $1,700 | $1.21 | 21d | 1 | 1.12mi |
| 1006 Seaborn Way Pea Ridge, AR | 3.0 | 2.5 | 1750 | $1,650 | $0.94 | 43d | 1 | 1.13mi |
| 1808 Edwards St Pea Ridge, AR | 4.0 | 2.0 | 1660 | $2,025 | $1.22 | 13d | 1 | 1.26mi |
| 1902 Edwards St Pea Ridge, AR | 3.0 | 2.0 | 1674 | $2,025 | $1.21 | 13d | 1 | 1.33mi |
Listing history 4 events
-
2026-05-13price $199,000 246-char remark
Show marketing remark (246 chars)
Located in the center of Pea Ridge, this property is close to every thing! Two lots included with (+/-) . 68 acres of beautiful cleared land. A fixer upper waiting for some TLC! Would be great as an investment or rental. Snag this property today!
-
2026-04-22$235,000 Active 246-char remark
Show marketing remark (246 chars)
Located in the center of Pea Ridge, this property is close to every thing! Two lots included with (+/-) . 68 acres of beautiful cleared land. A fixer upper waiting for some TLC! Would be great as an investment or rental. Snag this property today!
-
2024-08-20price $189,900
-
2000-06-27soldstatus $72,000
ⓘ Source: listings_history table (triggers on properties + properties_extension) + one-shot
backfill from property_details.listing_events for pre-trigger history.
Tax reassessment forecast AR · Resets to sale price
- Current annual tax
- $695 · $58/mo
- Projected year-2 tax
- $1,274 · $106/mo
- Expected delta
- +$579/yr (+$48/mo · 83.3%)
ⓘ Screening estimate from a state-policy table — verify with the county assessor before closing.
Climate risk First Street
- Flood 1/10 Low FEMA zone X (unshaded) · 0% chance over 30 yrs
- Wildfire 5/10 Major
- Heat 4/10 Moderate 7 d/yr ≥105°F today · 21 d/yr by 30 yrs out
- Wind 2/10 Low 2% chance of damaging wind over 30 yrs
- Air quality 2/10 Low 1 unhealthy d/yr today · 1 by 30 yrs out
Nearby sold comps map
Loading sold comps map…
Walkable amenities ~0.75 mi
Loading nearby amenities…
Taxation est. · year 1
- Rental income
- $21,609
- − Mortgage interest
- −$11,147
- − Property taxes
- −$695
- − Insurance
- −$995
- − Repairs & maintenance
- −$1,729
- − Management
- −$1,729
- − Depreciation
- −$5,789
- Taxable loss
- −$475
- Est. tax savings @ 24.0%
- +$114
- After-tax cash flow
- $2,972/yr
For passive investors: Depreciation is non-cash, so a rental often shows a tax loss while cash-flowing — sheltering income. Rental losses are passive: they offset passive income freely, and up to $25,000/yr can offset ordinary (W-2) income if you actively participate and your MAGI is under $100k (phasing out to $0 by $150k); unused losses carry forward. On sale, claimed depreciation is recaptured at up to 25%, and gains may owe capital-gains tax (a 1031 exchange can defer both). Figures are a year-1 estimate at your 24.0% rate — not tax advice; consult a CPA.
Schools (NCES district)
- District
- Pea Ridge School District
- NCES district ID
- 0503030
- Math proficiency
- 43% ▼ -3.00%
- Reading proficiency
- 42% ▼ -8.00%
- Median HH income
- $53,156
- Composite
- 36.88/100
- National rank
- #4546
- State rank
- #43 of 238 in AR
Livability — Pea Ridge
- Score
- 67/100
- State rank
- #98
- US rank
- #10429
Category grades
Schools grade is shown separately in the Schools card above.
Census & demographics
- Census place
- Pea Ridge, AR
- County
- Benton County · 259,241 people
- City population
- 9,997
- Metro
- Fayetteville-Springdale-Rogers, AR
- Population (ZIP)
- 9,997
- Household income
- $95,299
- Rent vs Own
- Severe rent burden
- 83.0
Population outlook (Benton County) Hauer SSP2
- Today (2025)
- 318,683 people
- By 2030
- 353,481 · +10.9%
- By 2040
- 425,280 · +33.4%
- By 2050
- 497,239 · +56.0%
- By 2075
- 662,114 · +107.8%
- By 2100
- 776,431 · +143.6%
Race, ethnicity, and origin ACS 2023
- Neighborhood character
- Predominantly White (72%)
- Race & ethnicity
- White 72% Two or more races 17% Hispanic / Latino 7% Black 3%
- Hispanic origin (detail)
- Mexican 5%
- Common ancestry
- Slovak 4% Scottish 2% Lithuanian 2%
- Foreign-born
- 7% · Canada, Vietnam
- Languages at home
- 97% English-only · Spanish 2% Vietnamese 1%
Political lean MEDSL · Benton
- 2024 margin
- Strong R (+27.0) · D 35.2% · R 62.1% · Other 2.7%
- 2008→2024 swing
- +9.6pp toward D · 2008: -36.5pp · 2024: -27.0pp
- All cycles
- 2024: R+27.0 2020: R+26.4 2016: R+34.9 2012: R+40.4 2008: R+36.5
Not yet ingested
- Civics
- —
Market trends
- HPI YoY
- ▲ 7.48%
- Current HPI
- 352.7133
- Rent YoY
- —
- Metro
- Fayetteville-Springdale-Rogers, AR
- State GDP YoY
- ▲ 3.80%
- F500 in state
- 10
Industry mix (Fortune 500 HQ in AR)
| Industry | F500 HQs | Revenue |
|---|---|---|
| Retail | 1 | $681B |
|
||
| Food / Agriculture | 1 | $53B |
|
||
| Retail / Energy | 1 | $22B |
|
||
| Transportation / Logistics | 1 | $12B |
|
||
| Energy | 1 | $4B |
|
||
Price history
+176.4% since first listed4 events — show timeline
- 2026-05-13 Price Changed $199,000 NWARMLS
- 2026-04-22 Listed $235,000 NWARMLS
- 2024-08-20 Price Changed $189,900 NWARMLS
- 2000-06-27 Sold (Public Records) $72,000 Public Records
Property tax history
+8.0%/yrLatest (2025): $695 · +465.5% YoY. Source: county tax records.
Cash-flow waterfall
monthlySold comps — $/sqft
last 12 mo · ≤1 miLoading sold comps…