 🏗️ New Construction
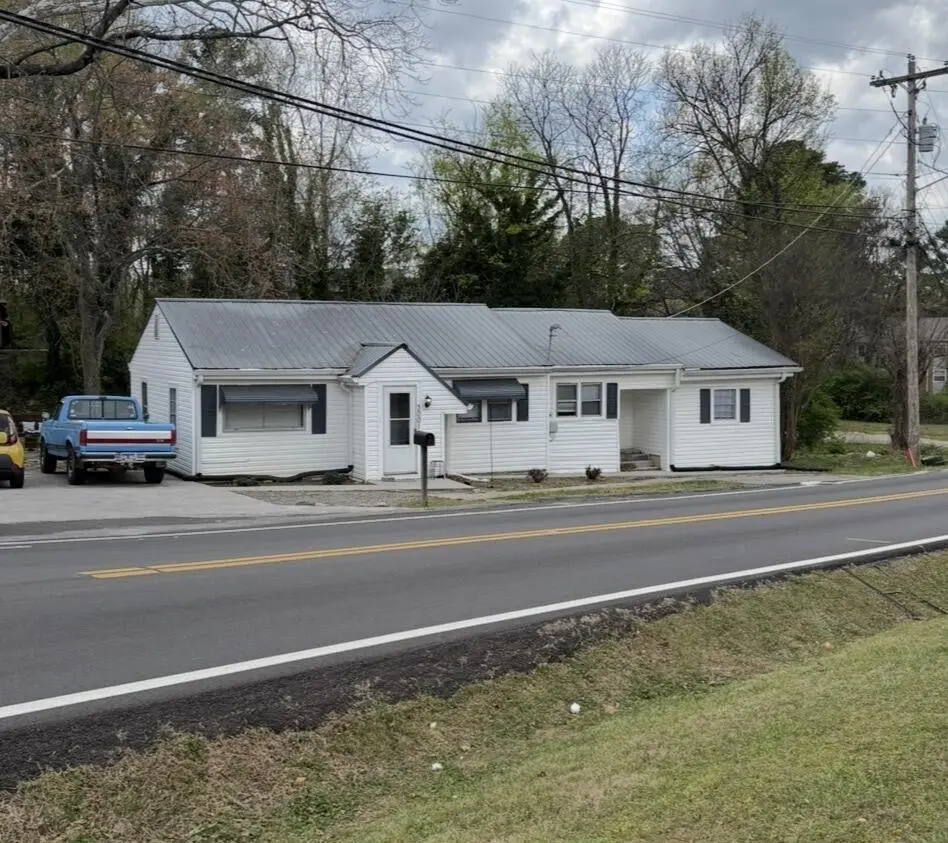
3001 Henderson Ave NW · Cleveland, TN
Flood risk 1/10 · Minimal
- FEMA flood zone
- X (unshaded)
- Chance of flooding over 30 yrs
- 0.0%
- Est. flood insurance / yr
- $507 – $1,088
Fire risk 1/10 · Minimal
- Est. fire insurance / yr
- $949 – $1,763
Heat risk 6/10 · Moderate
- Hot days now (above 104°F)
- 7 days/yr
- Hot days in 30 yrs
- 19 days/yr
Wind risk 3/10 · Minor
- Chance of severe wind over 30 yrs
- 5.0%
Air-quality risk 3/10 · Minor
- Unhealthy air days now
- 2 days/yr
- Unhealthy air days in 30 yrs
- 3 days/yr
Risk factors via First Street. Map © Google.
Why this score? — see what drove the F grade
The composite is a weighted blend of 9 inputs, each scored 0–100. Each bar is that input's sub-score; the figure is the points it added to the 100-point composite (weight × sub-score).
- Cash flow +7.7/30.0
- ARV discount +7.5/15.0
- Livability +3.5/5.0
- Rent growth +2.5/5.0
- Condition / age +2.5/5.0
- Schools +2.1/10.0
- DSCR +1.8/10.0
- 1% rule +1.0/10.0
- Appreciation +0.0/10.0
$175,000
🖨 Deal sheet 📄 Offer letter ✓ Due diligence
Listing remarks MLS
Priced $119,900.. .. .Take a look at this 3 bedroom, 1 bath Ranch Home that has been freshly painted, lg. eat-in kitchen complete with major appliances, lots of storage space, located conveniently near shopping areas and schools. Take a look today!
Key facts
- Zoned r2
- 0.29 acre lot
- Built 1948
Tags
Property features AI
Finance
- Financial info: Annual tax listed
- HOA & community: No community features listed
Exterior
- Parking: Driveway
- Security: Smoke detector(s)
- Utilities: Public water; Public sewer; Natural gas available
- Home design: Single family residence; New construction; One story; Raised foundation
- Construction: Vinyl siding; Metal roof; Raised foundation; New construction
- Exterior features: Level lot; Asphalt road frontage on a city street; Public maintained road; No patio/porch; No pool; No other structures
Interior
- Kitchen: Dishwasher; Electric range; Refrigerator
- Bedrooms: Single-family residence (one level)
- Flooring: Vinyl
- Bathrooms: 1 full bathroom
- Heating & cooling: Central heating; Central air; Ceiling fans; Attic fan
- Interior features: Breakfast bar; Ceiling fan(s); Smoke detector(s)
- Laundry & utility: Laundry closet
Neighborhood map
What this means for you Summary
Snapshot
- This is a 3-bed/1.0-bath single-family listed at $175k.
Deal economics
- At list price, monthly cash flow is $-344 ($-4k/yr) — negative.
- The deal already cash-flows at list — no discount required.
- Meets the 1% rule at list price ($2k rent vs $175k).
- Recommended offer: $172k (1.5% below list) — sets the bar for market timing.
- Cap rate 4.9% vs local median 3.5% in Cleveland — top-decile yield for the area; either an underpriced asset or a hidden risk that comps aren't pricing in. Stress-test before assuming the spread holds.
Location & tenants
- Location reads 70/100 on livability (#55 in TN) — a middle-class / working-renter tenant base. Strengths: cost of living A+, health & safety A+, housing A; Watch: schools D, employment D, crime F.
- Cleveland (urban): math 23% / reading 28% proficiency, ranked #85 of 139 in TN (top 61%) — low school quality limits family demand, transient renter base, plan for 1-2y turnover.
- Market conditions: Rents flat; 549 active listings in the ZIP; solid renter incomes; 768 units permitted in Bradley County in 2024 (0 in 5+ unit buildings).
Forward outlook
- Local home prices are declining (-3.0%/yr); year-one equity from $2k of loan paydown is wiped out by about $9k of value loss. Plan a longer hold.
- Bradley County population projected at +21% by 2050 — long-run rental-demand tailwind backs the buy-and-hold thesis.
Negotiation context
- It's been on market 22 days — a 2% lower offer ($172k) is reasonable based on typical stale-listing flexibility.
- 7 sale attempts since 7y ago with the ask held roughly flat each time — persistent listings suggest the price (not the market) is what's stuck; bring a comps-based counter.
- Current owner paid $139k; 26% above their basis — modest negotiation headroom, anchor on the comps not their cost.
Risks & watch-outs
- Watch-outs: built in 1948 — expect roof / HVAC / electrical / plumbing capex.
- Climate carrying-cost: extreme-heat days projected 7→19/yr by 2055 (HVAC capex compounding) — expect insurance premiums to compound above CPI over the hold.
Questions for the listing agent
- What do current leases actually rent for vs. the listed asking? Can we see a recent rent roll and the last 12 months of T-12 income?
- Built in 1948 — when were the roof, HVAC, electrical panel, plumbing, and water heater last replaced?
- Is there a deadline driving the sale (1031 exchange, divorce, estate, relocation)? That informs how much negotiation room exists.
- Schools are D-rated, which usually means shorter tenancies and higher turnover. Who's the typical renter profile here, and what's been the actual vacancy rate?
- Crime grade is F in this area — have there been break-ins, vandalism, or insurance claims at this property in the last 3 years? What carrier currently insures it and at what premium?
- The area grade is low — what's the realistic commute time and amenity access for the typical tenant pool here? Any planned neighborhood developments (good or bad) we should know about?
- What's the average days-on-market for RENTAL listings here right now (not sales)? A rising rental-DOM trend means longer vacancies and softer asking-rent achievability than the comps imply.
- What's the recent tenant-quality profile in this submarket — average credit score on applications, eviction rate, late-payment / NSF rate, and stable-employment percentage? A property-management company in the area should have these aggregated.
- How much new for-sale + rental construction is in the pipeline within 1–3 miles? Heavy new supply typically softens prices + rents 12–24 months out; constrained supply supports both.
Investment metrics
- 1% rule
- 0.60% ✗
- Cap rate
- 4.91%
- Cash-on-cash
- -4.95%
- DSCR
- 0.78
- GRM
- 13.8
CMA / ARV
- ARV (on-the-fly)
- $297,705
- Comps found
- 12
Show comp detail 12 sales within ~0.75 mi
| Address | Dist | Beds/Ba | Sqft | Sold | Price | $/sf | Match |
|---|---|---|---|---|---|---|---|
| 3190 Cottage Grove Cir NW | 0.09mi | 3/2.0 | 1,345 (+1%) | 17mo | $300,000 | $223 | 76 |
| 3190 Cottage Grove Cir | 0.09mi | 3/2.0 | 1,345 (+1%) | 17mo | $300,000 | $223 | 76 |
| 3132 Cottage Grove Cir NW | 0.15mi | 3/2.5 | 1,300 (-3%) | 13mo | $298,500 | $230 | 72 |
| 441 Barberry Dr NW | 0.14mi | 3/2.5 | 1,455 (+9%) | 7mo | $340,000 | $234 | 66 |
| 3010 Clearwater Dr NE | 0.68mi | 3/2.0 | 1,332 (-0%) | 4mo | $290,000 | $218 | 61 |
| 2620 Mac St NW | 0.34mi | 3/2.0 | 1,512 (+13%) | 4mo | $270,000 | $179 | 55 |
| 166 Mcnabb Dr | 0.17mi | 2/2.5 (-1) | 1,529 (+14%) | 9mo | $269,900 | $177 | 49 |
| 2636 Willow Run Trl NW Lot 6 | 0.60mi | 3/2.0 | 1,500 (+12%) | 1mo | $379,900 | $253 | 47 |
| 2612 Mac St NW | 0.36mi | 3/2.0 | 1,531 (+15%) | 17mo | $350,000 | $229 | 41 |
| 3125 Clearwater Dr | 0.64mi | 3/2.0 | 1,495 (+12%) | 13mo | $311,500 | $208 | 36 |
| 3225 Weeks Horizon Pl NE | 0.70mi | 3/3.0 | 1,474 (+10%) | 15mo | $235,000 | $159 | 30 |
| 3223 Weeks Horizon Pl NE | 0.71mi | 3/3.0 | 1,474 (+10%) | 15mo | $235,000 | $159 | 30 |
Match score weights: distance 35% · size 25% · config 20% · recency 20%. Top-matched comps best support the ARV.
Projected returns pro-forma
-3.0% appreciation · 0.15% rent growth · sell at horizon
- IRR
- -27.4%
- Equity multiple
- 0.10×
- Total profit
- $-75,286
- Equity at exit
- $44,389
- IRR
- -37.2%
- Equity multiple
- -0.36×
- Total profit
- $-113,775
- Equity at exit
- $25,740
Cash invested: $83,357 (down + closing). Projections, not guarantees.
Landlord ↔ Tenant lean methodology
- Overall (STATE)
- 87 Strongly Landlord-Friendly
- State Tennessee
- 87 Strongly Landlord-Friendly · R+13
- County
- — inherits STATE
- City
- — inherits STATE
ZIP-level market 37312
- Rents YoY
- 0.1%
- Active inventory
- 549
- Price-to-rent
- 8.1×
Monthly cashflow live
- Estimated rent
- $1,797 medium interval (Pro) →
- Mortgage (P&I)
- −$1,561
- Tax from tax record
- −$78 /mo · $931/yr
- Insurance
- −$124
- HOA
- −$0
- Vacancy / Maint / Mgmt
- −$377
- Net cashflow
- $-344
Break-even live
UW: 25.0% down · 7.5% · 30yr · 1.5% tax · 5.0% vac · 8.0% maint · 8.0% mgmt
Financing live
Cash to close
- Down payment
- $74,426
- Closing costs
- $8,931
- Reserves months
- —
- Total cash needed
- —
Loan-product check · same deal, 3 products live
Conventional
25% down · 7.5% · 30yr
- Down + closing
- —
- Monthly P&I
- —
- Monthly cashflow
- —
- DSCR
- —
- Eligible?
- —
Personal DTI + credit; lowest rate.
DSCR
20% down · 8.5% · 30yr
- Down + closing
- —
- Monthly P&I
- —
- Monthly cashflow
- —
- DSCR
- —
- Eligible?
- —
No personal income docs; deal must DSCR.
Hard money
10% down · 12.0% · 12mo
- Down + closing
- —
- Monthly P&I
- —
- Monthly cashflow
- —
- DSCR
- —
- Eligible?
- —
Short-term bridge; refi at stabilization.
Listing history 35 events
-
2026-06-19days on market $175,000 Active 22 DOM
-
2026-06-18days on market $175,000 Active 21 DOM
-
2026-06-18price $175,000 Active 20 DOM
-
2026-06-17days on market $179,900 Active 20 DOM
-
2026-06-16days on market $179,900 Active 19 DOM
-
2026-06-15days on market $179,900 Active 18 DOM
-
2026-06-14days on market $179,900 Active 16 DOM
-
2026-06-13days on market $179,900 Active 15 DOM
-
2026-06-10days on market $179,900 Active 13 DOM
-
2026-06-09days on market $179,900 Active 12 DOM
-
2026-06-08days on market $179,900 Active 11 DOM
-
2026-06-07days on market $179,900 Active 10 DOM
-
2026-06-05days on market $179,900 Active 7 DOM
-
2026-06-03days on market $179,900 Active 6 DOM
-
2026-06-02days on market $179,900 Active 5 DOM
-
2026-06-01days on market $179,900 Active 4 DOM
-
2026-05-31days on market $179,900 Active 3 DOM
-
2026-05-30days on market $179,900 Active 2 DOM
-
2026-04-06$179,900 Active
-
2026-02-28historical $1,400
-
2026-02-04$1,400
-
2024-06-23historical $1,500
-
2024-06-20$1,500
-
2024-06-16historical $1,500
-
2024-06-14$1,500
-
2023-08-21soldstatus $138,503
-
2021-08-20soldstatus $132,000
-
2021-08-19soldstatus $109,900 248-char remark
Show marketing remark (248 chars)
Priced $119,900.. .. .Take a look at this 3 bedroom, 1 bath Ranch Home that has been freshly painted, lg. eat-in kitchen complete with major appliances, lots of storage space, located conveniently near shopping areas and schools. Take a look today!
-
2021-08-09$119,900 248-char remark
Show marketing remark (248 chars)
Priced $119,900.. .. .Take a look at this 3 bedroom, 1 bath Ranch Home that has been freshly painted, lg. eat-in kitchen complete with major appliances, lots of storage space, located conveniently near shopping areas and schools. Take a look today!
-
2019-02-06soldstatus $58,000 84-char remark
Show marketing remark (84 chars)
3 Bedroom, 1 Bath fixer upper home in the middle of Cleveland. Investors take note!!
-
2019-02-06soldstatus $58,000
Show marketing remark (84 chars)
3 Bedroom, 1 Bath fixer upper home in the middle of Cleveland. Investors take note!!
-
2019-02-06soldstatus $58,000
Show marketing remark (84 chars)
3 Bedroom, 1 Bath fixer upper home in the middle of Cleveland. Investors take note!!
-
2019-01-28$63,500 84-char remark
Show marketing remark (84 chars)
3 Bedroom, 1 Bath fixer upper home in the middle of Cleveland. Investors take note!!
-
2019-01-28$63,500
Show marketing remark (84 chars)
3 Bedroom, 1 Bath fixer upper home in the middle of Cleveland. Investors take note!!
-
1996-09-25soldstatus $37,700
ⓘ Source: listings_history table (triggers on properties + properties_extension) + one-shot
backfill from property_details.listing_events for pre-trigger history.
Tax reassessment forecast TN · Resets to sale price
- Current annual tax
- $931 · $78/mo
- Projected year-2 tax
- $1,242 · $104/mo
- Expected delta
- +$312/yr (+$26/mo · 33.5%)
ⓘ Screening estimate from a state-policy table — verify with the county assessor before closing.
Climate risk First Street
- Flood 1/10 Low FEMA zone X (unshaded) · 0% chance over 30 yrs
- Wildfire 1/10 Low
- Heat 6/10 Major 7 d/yr ≥104°F today · 19 d/yr by 30 yrs out
- Wind 3/10 Moderate 5% chance of damaging wind over 30 yrs
- Air quality 3/10 Moderate 2 unhealthy d/yr today · 3 by 30 yrs out
Nearby sold comps map
Loading sold comps map…
Walkable amenities ~0.75 mi
Loading nearby amenities…
Taxation est. · year 1
- Rental income
- $21,558
- − Mortgage interest
- −$16,676
- − Property taxes
- −$931
- − Insurance
- −$1,489
- − Repairs & maintenance
- −$1,725
- − Management
- −$1,725
- − Depreciation
- −$8,661
- Taxable loss
- −$9,647
- Est. tax savings @ 24.0%
- +$2,315
- After-tax cash flow
- $-1,807/yr
For passive investors: Depreciation is non-cash, so a rental often shows a tax loss while cash-flowing — sheltering income. Rental losses are passive: they offset passive income freely, and up to $25,000/yr can offset ordinary (W-2) income if you actively participate and your MAGI is under $100k (phasing out to $0 by $150k); unused losses carry forward. On sale, claimed depreciation is recaptured at up to 25%, and gains may owe capital-gains tax (a 1031 exchange can defer both). Figures are a year-1 estimate at your 24.0% rate — not tax advice; consult a CPA.
Schools (NCES district)
- District
- Cleveland
- NCES district ID
- 4700690
- Math proficiency
- 23% ▼ -9.00%
- Reading proficiency
- 28% ▼ -6.00%
- Median HH income
- $37,612
- Composite
- 21.28/100
- National rank
- #8394
- State rank
- #85 of 139 in TN
Livability — Cleveland
- Score
- 70/100
- State rank
- #55
- US rank
- #7689
Category grades
Schools grade is shown separately in the Schools card above.
Census & demographics
- Census place
- Cleveland, TN
- County
- Bradley County · 99,337 people
- City population
- 99,337
- Metro
- Cleveland, TN
- Population (ZIP)
- 36,669
- Household income
- $78,261
- Rent vs Own
- Severe rent burden
- 908.0
Population outlook (Bradley County) Hauer SSP2
- Today (2025)
- 114,901 people
- By 2030
- 120,137 · +4.6%
- By 2040
- 130,125 · +13.2%
- By 2050
- 139,257 · +21.2%
- By 2075
- 161,664 · +40.7%
- By 2100
- 179,767 · +56.5%
Race, ethnicity, and origin ACS 2023
- Neighborhood character
- Predominantly White (82%)
- Race & ethnicity
- White 82% Hispanic / Latino 7% Two or more races 6% Black 4% Asian 3%
- Hispanic origin (detail)
- Mexican 3% Puerto Rican 1%
- Common ancestry
- Serbian 3% Slovak 2% Italian 2%
- Foreign-born
- 7% · Canada, South Korea
- Languages at home
- 92% English-only · Spanish 4% Other Indo-European 2% Russian/Polish/Slavic 1%
Political lean MEDSL · Bradley
- 2024 margin
- Solid R (+58.9) · D 20.0% · R 78.9% · Other 1.1%
- 2008→2024 swing
- -9.2pp toward R · 2008: -49.7pp · 2024: -58.9pp
- All cycles
- 2024: R+58.9 2020: R+55.3 2016: R+59.1 2012: R+53.9 2008: R+49.7
Not yet ingested
- Civics
- —
Market trends
- HPI YoY
- ▼ -206.27%
- Current HPI
- 260.8746
- Rent YoY
- ▲ 0.15%
- Metro
- Cleveland, TN
- State GDP YoY
- ▲ 2.78%
- F500 in state
- 22
Industry mix (Fortune 500 HQ in TN)
| Industry | F500 HQs | Revenue |
|---|---|---|
| Healthcare | 3 | $91B |
|
||
| Retail | 3 | $72B |
|
||
| Transportation / Logistics | 1 | $88B |
|
||
| Paper / Packaging | 1 | $19B |
|
||
| Insurance | 1 | $13B |
|
||
| Energy | 1 | $12B |
|
||
Price history
+377.2% since first listed17 events — show timeline
- 2026-04-06 Listed $179,900 RCAOR
- 2026-02-28 Rental Removed $1,400 APPFOLIO
- 2026-02-04 Listed for Rent $1,400 APPFOLIO
- 2024-06-23 Rental Removed $1,500 APPFOLIO
- 2024-06-20 Listed for Rent $1,500 APPFOLIO
- 2024-06-16 Rental Removed $1,500 APPFOLIO
- 2024-06-14 Listed for Rent $1,500 APPFOLIO
- 2023-08-21 Sold (Public Records) $138,503 Public Records
- 2021-08-20 Sold (Public Records) $132,000 Public Records
- 2021-08-19 Sold (MLS) $109,900 RCAOR
- 2021-08-09 Listed $119,900 RCAOR
- 2019-02-06 Sold (Public Records) $58,000 Public Records
- 2019-02-06 Sold (MLS) $58,000 REALTRACS as Distributed by MLS Grid
- 2019-02-06 Sold (MLS) $58,000 RCAOR
- 2019-01-28 Listed $63,500 RCAOR
- 2019-01-28 Listed $63,500 REALTRACS as Distributed by MLS Grid
- 1996-09-25 Sold (Public Records) $37,700 Public Records
Property tax history
+4.0%/yrLatest (2025): $931 · +18.0% YoY. Source: county tax records.
Cash-flow waterfall
monthlySold comps — $/sqft
last 12 mo · ≤1 miLoading sold comps…