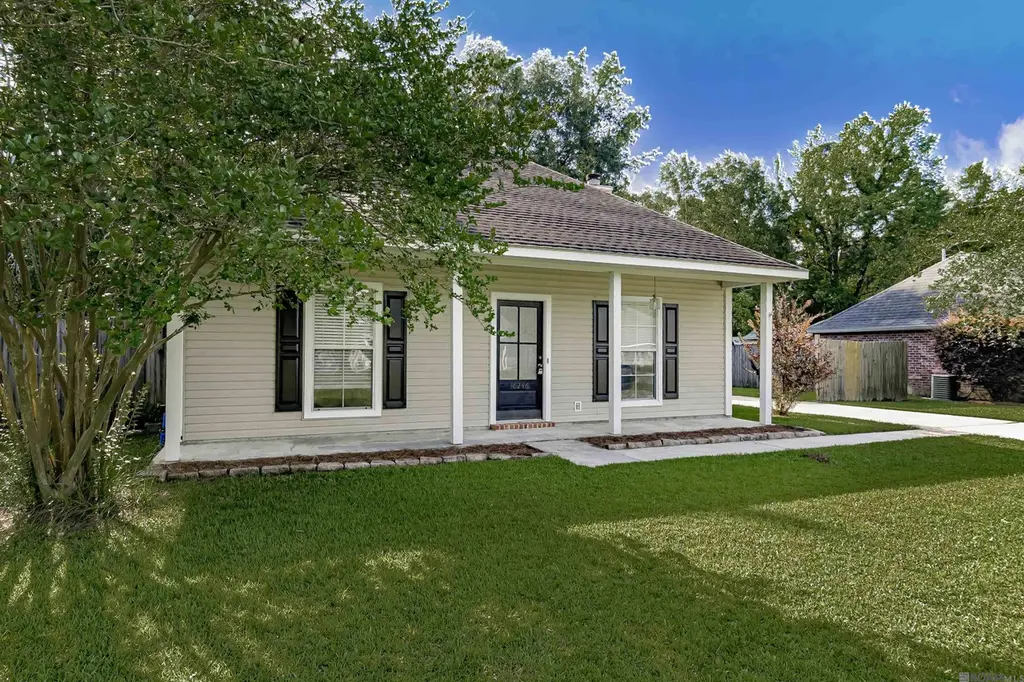
36246 Greenville Ave · Watson, LA
Flood risk 1/10 · Minimal
- FEMA flood zone
- X (unshaded)
- Chance of flooding over 30 yrs
- 0.0%
- Est. flood insurance / yr
- $507 – $1,088
Fire risk 3/10 · Minor
- Est. fire insurance / yr
- $1,269 – $2,357
Heat risk 8/10 · Major
- Hot days now (above 108°F)
- 7 days/yr
- Hot days in 30 yrs
- 20 days/yr
Wind risk 9/10 · Severe
- Chance of severe wind over 30 yrs
- 99.0%
Air-quality risk 3/10 · Minor
- Unhealthy air days now
- 2 days/yr
- Unhealthy air days in 30 yrs
- 3 days/yr
Risk factors via First Street. Map © Google.
Why this score? — see what drove the D- grade
The composite is a weighted blend of 9 inputs, each scored 0–100. Each bar is that input's sub-score; the figure is the points it added to the 100-point composite (weight × sub-score).
- Cash flow +12.2/30.0
- ARV discount +7.8/15.0
- Schools +4.0/10.0
- DSCR +3.6/10.0
- Livability +3.6/5.0
- 1% rule +2.9/10.0
- Rent growth +2.5/5.0
- Condition / age +2.5/5.0
- Appreciation +0.0/10.0
$205,000
🖨 Deal sheet 📄 Offer letter ✓ Due diligence
Listing remarks MLS
Charming Home in Sought-After Crestwood Subdivision Welcome to this beautifully maintained 3-bedroom, 2-bath home in the highly desirable Crestwood neighborhood--just minutes from Live Oak School, parks, and local shopping. Featuring a spacious open floor plan, this home is ideal for both entertaining and everyday living. Step inside to a freshly painted interior, a cozy fireplace, and no carpet throughout for easy maintenance and modern appeal. The fully fenced backyard offers privacy and plenty of space to relax or host gatherings. Perfect for first-time homebuyers or investors, this property qualifies for 100% financing, has no HOA, and--best of all--is located outside of a flood zone and has never flooded. Don't miss your chance to own this move-in ready gem in a prime location!
Key facts
- Cozy fireplace
- Move in ready
- 0.25 acre lot
Tags
Neighborhood map
What this means for you Summary
Snapshot
- This is a 3-bed/2.0-bath single-family listed at $205k.
Deal economics
- At list price, monthly cash flow is $-40 ($-483/yr) — negative.
- To cash-flow at today's rent, offer at most $198k (3.5% below list).
- To meet the 1% rule (rent ≥ 1% of price), the offer needs to be $163k (20.5% below list).
- Recommended offer: $163k (20.5% below list) — sets the bar for 1% rule.
- Cap rate 6.1% vs local median 4.8% in Watson — meaningfully above typical; check what's discounted (condition, days-on-market, listing class) to confirm the premium yield is real.
Location & tenants
- Location reads 71/100 on livability (#50 in LA) — a middle-class / working-renter tenant base. Strengths: schools A+, crime A+, employment A+; Watch: amenities F, commute F, health & safety F.
- Livingston Parish (suburban): math 40% / reading 52% proficiency, ranked #13 of 98 in LA (top 13%) — families likely to look elsewhere, expect single-tenant / working-renter base with shorter leases.
- Market conditions: 342 active listings in the ZIP; 2 comparable units currently listed for rent nearby; 794 units permitted in Livingston Parish in 2024 (99 in 5+ unit buildings).
Forward outlook
- Local home prices are declining (-3.0%/yr); year-one equity from $1k of loan paydown is wiped out by about $6k of value loss. Plan a longer hold.
- Livingston County population projected at +27% by 2050 — long-run rental-demand tailwind backs the buy-and-hold thesis.
Negotiation context
- It's been on market 23 days — a 2% lower offer ($202k) is reasonable based on typical stale-listing flexibility.
- 8 sale attempts since 26y ago with the ask held roughly flat each time — persistent listings suggest the price (not the market) is what's stuck; bring a comps-based counter.
- Current owner paid $150k; 37% above their basis — modest negotiation headroom, anchor on the comps not their cost.
Risks & watch-outs
- Climate carrying-cost: severe wind risk, 99% chance of damaging wind over 30y; extreme-heat days projected 7→20/yr by 2055 (HVAC capex compounding) — expect insurance premiums to compound above CPI over the hold.
Questions for the listing agent
- What do current leases actually rent for vs. the listed asking? Can we see a recent rent roll and the last 12 months of T-12 income?
- Is there a deadline driving the sale (1031 exchange, divorce, estate, relocation)? That informs how much negotiation room exists.
- Schools are A-rated — typically a magnet for longer-tenancy family renters. What's the average tenant stay here, and is there a school-zone premium baked into asking?
- The area grade is low — what's the realistic commute time and amenity access for the typical tenant pool here? Any planned neighborhood developments (good or bad) we should know about?
- What's the average days-on-market for RENTAL listings here right now (not sales)? A rising rental-DOM trend means longer vacancies and softer asking-rent achievability than the comps imply.
- What's the recent tenant-quality profile in this submarket — average credit score on applications, eviction rate, late-payment / NSF rate, and stable-employment percentage? A property-management company in the area should have these aggregated.
- How much new for-sale + rental construction is in the pipeline within 1–3 miles? Heavy new supply typically softens prices + rents 12–24 months out; constrained supply supports both.
Investment metrics
- 1% rule
- 0.79% ✗
- Cap rate
- 6.06%
- Cash-on-cash
- -0.84%
- DSCR
- 0.96
- GRM
- 10.5
CMA / ARV
- ARV (on-the-fly)
- $206,538
- Comps found
- 12
Show comp detail 12 sales within ~0.75 mi
| Address | Dist | Beds/Ba | Sqft | Sold | Price | $/sf | Match |
|---|---|---|---|---|---|---|---|
| 36246 Greenville Ave | 0.00mi | 3/2.0 | 1,187 (0%) | 1mo | $200,000 | $168 | 99 |
| 36221 Lynchburg Dr | 0.16mi | 3/2.0 | 1,189 (+0%) | 3mo | $207,000 | $174 | 90 |
| 36238 Greenville Ave | 0.01mi | 3/2.0 | 1,184 (-0%) | 19mo | $207,000 | $175 | 83 |
| 36140 Lynchburg Dr | 0.28mi | 3/2.0 | 1,186 (-0%) | 10mo | $210,000 | $177 | 79 |
| 10130 Memphis Ct | 0.25mi | 3/2.0 | 1,181 (-0%) | 11mo | $207,000 | $175 | 78 |
| 10130 Nashville Ct | 0.28mi | 3/2.0 | 1,203 (+1%) | 9mo | $225,000 | $187 | 77 |
| 10019 Lexington Dr | 0.20mi | 3/2.0 | 1,285 (+8%) | 3mo | $217,500 | $169 | 74 |
| 36287 Greenville Ave | 0.08mi | 3/2.0 | 1,301 (+10%) | 13mo | $224,900 | $173 | 70 |
| 37053 Fore Rd | 0.71mi | 2/2.0 (-1) | 1,185 (-0%) | 3mo | $180,000 | $152 | 59 |
| 10004 Asheville Dr | 0.38mi | 3/2.0 | 1,278 (+8%) | 14mo | $225,000 | $176 | 58 |
| 10082 Lexington Dr | 0.26mi | 3/2.0 | 1,341 (+13%) | 10mo | $212,000 | $158 | 58 |
| 36101 Greenville Ave | 0.27mi | 3/2.0 | 1,344 (+13%) | 10mo | $233,150 | $173 | 57 |
Match score weights: distance 35% · size 25% · config 20% · recency 20%. Top-matched comps best support the ARV.
Projected returns pro-forma
-3.0% appreciation · 3.0% rent growth · sell at horizon
- IRR
- -17.7%
- Equity multiple
- 0.38×
- Total profit
- $-35,813
- Equity at exit
- $30,566
- IRR
- -9.9%
- Equity multiple
- 0.40×
- Total profit
- $-34,610
- Equity at exit
- $17,725
Cash invested: $57,400 (down + closing). Projections, not guarantees.
Landlord ↔ Tenant lean methodology
- Overall (STATE)
- 90 Strongly Landlord-Friendly
- State Louisiana
- 90 Strongly Landlord-Friendly · R+12
- County
- — inherits STATE
- City
- — inherits STATE
ZIP-level market 70706
- Active inventory
- 342
- Price-to-rent
- 10.5×
Monthly cashflow live
- Estimated rent
- $1,630 medium interval (Pro) →
- Mortgage (P&I)
- −$1,075
- Tax from tax record
- −$167 /mo · $2,007/yr
- Insurance
- −$85
- HOA
- −$0
- Vacancy / Maint / Mgmt
- −$342
- Net cashflow
- $-40
Break-even live
UW: 25.0% down · 7.5% · 30yr · 1.5% tax · 5.0% vac · 8.0% maint · 8.0% mgmt
Financing live
Cash to close
- Down payment
- $51,250
- Closing costs
- $6,150
- Reserves months
- —
- Total cash needed
- —
Loan-product check · same deal, 3 products live
Conventional
25% down · 7.5% · 30yr
- Down + closing
- —
- Monthly P&I
- —
- Monthly cashflow
- —
- DSCR
- —
- Eligible?
- —
Personal DTI + credit; lowest rate.
DSCR
20% down · 8.5% · 30yr
- Down + closing
- —
- Monthly P&I
- —
- Monthly cashflow
- —
- DSCR
- —
- Eligible?
- —
No personal income docs; deal must DSCR.
Hard money
10% down · 12.0% · 12mo
- Down + closing
- —
- Monthly P&I
- —
- Monthly cashflow
- —
- DSCR
- —
- Eligible?
- —
Short-term bridge; refi at stabilization.
Rent comps 2 comps
| Address | Beds | Baths | Sqft | Rent | $/sqft | DOM | Units | Dist |
|---|---|---|---|---|---|---|---|---|
| 10124 Nashville Ct Denham Springs, LA | 3.0 | 2.0 | 1165 | $1,600 | $1.37 | 43d | 1 | 0.32mi |
| 10552 Tumbleweed Dr Denham Springs, LA | 3.0 | 2.0 | 1463 | $1,750 | $1.20 | 43d | 1 | 1.07mi |
Listing history 17 events
-
2026-04-25status Pending 793-char remark
Show marketing remark (793 chars)
Charming Home in Sought-After Crestwood Subdivision Welcome to this beautifully maintained 3-bedroom, 2-bath home in the highly desirable Crestwood neighborhood--just minutes from Live Oak School, parks, and local shopping. Featuring a spacious open floor plan, this home is ideal for both entertaining and everyday living. Step inside to a freshly painted interior, a cozy fireplace, and no carpet throughout for easy maintenance and modern appeal. The fully fenced backyard offers privacy and plenty of space to relax or host gatherings. Perfect for first-time homebuyers or investors, this property qualifies for 100% financing, has no HOA, and--best of all--is located outside of a flood zone and has never flooded. Don't miss your chance to own this move-in ready gem in a prime location!
-
2026-04-24status Pending
-
2026-04-01$205,000 Active 793-char remark
Show marketing remark (793 chars)
Charming Home in Sought-After Crestwood Subdivision Welcome to this beautifully maintained 3-bedroom, 2-bath home in the highly desirable Crestwood neighborhood--just minutes from Live Oak School, parks, and local shopping. Featuring a spacious open floor plan, this home is ideal for both entertaining and everyday living. Step inside to a freshly painted interior, a cozy fireplace, and no carpet throughout for easy maintenance and modern appeal. The fully fenced backyard offers privacy and plenty of space to relax or host gatherings. Perfect for first-time homebuyers or investors, this property qualifies for 100% financing, has no HOA, and--best of all--is located outside of a flood zone and has never flooded. Don't miss your chance to own this move-in ready gem in a prime location!
-
2026-04-01$205,000 Active
Show marketing remark (793 chars)
Charming Home in Sought-After Crestwood Subdivision Welcome to this beautifully maintained 3-bedroom, 2-bath home in the highly desirable Crestwood neighborhood--just minutes from Live Oak School, parks, and local shopping. Featuring a spacious open floor plan, this home is ideal for both entertaining and everyday living. Step inside to a freshly painted interior, a cozy fireplace, and no carpet throughout for easy maintenance and modern appeal. The fully fenced backyard offers privacy and plenty of space to relax or host gatherings. Perfect for first-time homebuyers or investors, this property qualifies for 100% financing, has no HOA, and--best of all--is located outside of a flood zone and has never flooded. Don't miss your chance to own this move-in ready gem in a prime location!
-
2025-06-04status Pending
-
2025-05-30$205,000 Active
-
2025-05-30$205,000 Active
-
2018-07-16soldstatus $150,000
-
2018-07-13soldstatus Sold
-
2018-06-10status Pending
-
2018-06-07price $152,999
-
2018-06-01$155,000 Active
-
2018-06-01$152,999
-
2014-09-29soldstatus $128,000
-
2001-03-27soldstatus
-
2000-11-21$90,600
-
2000-11-21$90,600
ⓘ Source: listings_history table (triggers on properties + properties_extension) + one-shot
backfill from property_details.listing_events for pre-trigger history.
Tax reassessment forecast LA · Resets to sale price
- Current annual tax
- $2,007 · $167/mo
- Projected year-2 tax
- $2,007 · $167/mo
- Expected delta
- $0/yr ($0/mo · 0.0%)
ⓘ Screening estimate from a state-policy table — verify with the county assessor before closing.
Climate risk First Street
- Flood 1/10 Low FEMA zone X (unshaded) · 0% chance over 30 yrs
- Wildfire 3/10 Moderate
- Heat 8/10 Severe 7 d/yr ≥108°F today · 20 d/yr by 30 yrs out
- Wind 9/10 Extreme 99% chance of damaging wind over 30 yrs
- Air quality 3/10 Moderate 2 unhealthy d/yr today · 3 by 30 yrs out
Nearby sold comps map
Loading sold comps map…
Walkable amenities ~0.75 mi
Loading nearby amenities…
Taxation est. · year 1
- Rental income
- $19,556
- − Mortgage interest
- −$11,483
- − Property taxes
- −$2,007
- − Insurance
- −$1,025
- − Repairs & maintenance
- −$1,564
- − Management
- −$1,564
- − Depreciation
- −$5,964
- Taxable loss
- −$4,052
- Est. tax savings @ 24.0%
- +$972
- After-tax cash flow
- $489/yr
For passive investors: Depreciation is non-cash, so a rental often shows a tax loss while cash-flowing — sheltering income. Rental losses are passive: they offset passive income freely, and up to $25,000/yr can offset ordinary (W-2) income if you actively participate and your MAGI is under $100k (phasing out to $0 by $150k); unused losses carry forward. On sale, claimed depreciation is recaptured at up to 25%, and gains may owe capital-gains tax (a 1031 exchange can defer both). Figures are a year-1 estimate at your 24.0% rate — not tax advice; consult a CPA.
Schools (NCES district)
- District
- Livingston Parish
- NCES district ID
- 2201020
- Math proficiency
- 40% ▼ -38.00%
- Reading proficiency
- 52% ▼ -32.00%
- Median HH income
- $56,755
- Composite
- 40.07/100
- National rank
- #3811
- State rank
- #13 of 98 in LA
Livability — Watson
- Score
- 71/100
- State rank
- #50
- US rank
- #7247
Category grades
Schools grade is shown separately in the Schools card above.
Census & demographics
- Population (ZIP)
- 22,621
Population outlook (Livingston County) Hauer SSP2
- Today (2025)
- 158,511 people
- By 2030
- 168,241 · +6.1%
- By 2040
- 186,252 · +17.5%
- By 2050
- 201,516 · +27.1%
- By 2075
- 231,217 · +45.9%
- By 2100
- 241,697 · +52.5%
Race, ethnicity, and origin ACS 2023
- Neighborhood character
- Predominantly White (86%)
- Race & ethnicity
- White 86% Black 6% Hispanic / Latino 5% Two or more races 4%
- Hispanic origin (detail)
- Common ancestry
- Lithuanian 15% Slovak 2% Italian 1%
- Foreign-born
- 1% · Canada, China
Political lean MEDSL · Livingston
- 2024 margin
- Solid R (+68.5) · D 15.1% · R 83.6% · Other 1.3%
- 2008→2024 swing
- +3.4pp toward D · 2008: -71.9pp · 2024: -68.5pp
- All cycles
- 2024: R+68.5 2020: R+70.0 2016: R+72.5 2012: R+70.4 2008: R+71.9
Not yet ingested
- Civics
- —
Market trends
- HPI YoY
- ▼ -88.82%
- Current HPI
- 160.2185
- Rent YoY
- —
- Metro
- —
- State GDP YoY
- ▲ 3.29%
- F500 in state
- 10
Industry mix (Fortune 500 HQ in LA)
| Industry | F500 HQs | Revenue |
|---|---|---|
| Telecommunications | 2 | $23B |
|
||
| Utilities | 1 | $12B |
|
||
| Wholesale / Distribution | 1 | $5B |
|
||
| Advertising | 1 | $2B |
|
||
Price history
+126.3% since first listed17 events — show timeline
- 2026-04-25 Pending — AcadianaMLS
- 2026-04-24 Pending — GBRMLS
- 2026-04-01 Listed $205,000 GBRMLS
- 2026-04-01 Listed $205,000 AcadianaMLS
- 2025-06-04 Pending — GBRMLS
- 2025-05-30 Listed $205,000 GBRMLS
- 2025-05-30 Listed $205,000 AcadianaMLS
- 2018-07-16 Sold (Public Records) $150,000 Public Records
- 2018-07-13 Sold (MLS) — GBRMLS
- 2018-06-10 Pending — GBRMLS
- 2018-06-07 Price Changed $152,999 GBRMLS
- 2018-06-01 Listed $152,999 AcadianaMLS
- 2018-06-01 Listed $155,000 GBRMLS
- 2014-09-29 Sold (Public Records) $128,000 Public Records
- 2001-03-27 Sold (MLS) — GBRMLS
- 2000-11-21 Listed $90,600 AcadianaMLS
- 2000-11-21 Listed $90,600 GBRMLS
Property tax history
+2.9%/yrLatest (2024): $2,007 · +17.8% YoY. Source: county tax records.
Cash-flow waterfall
monthlySold comps — $/sqft
last 12 mo · ≤1 miLoading sold comps…