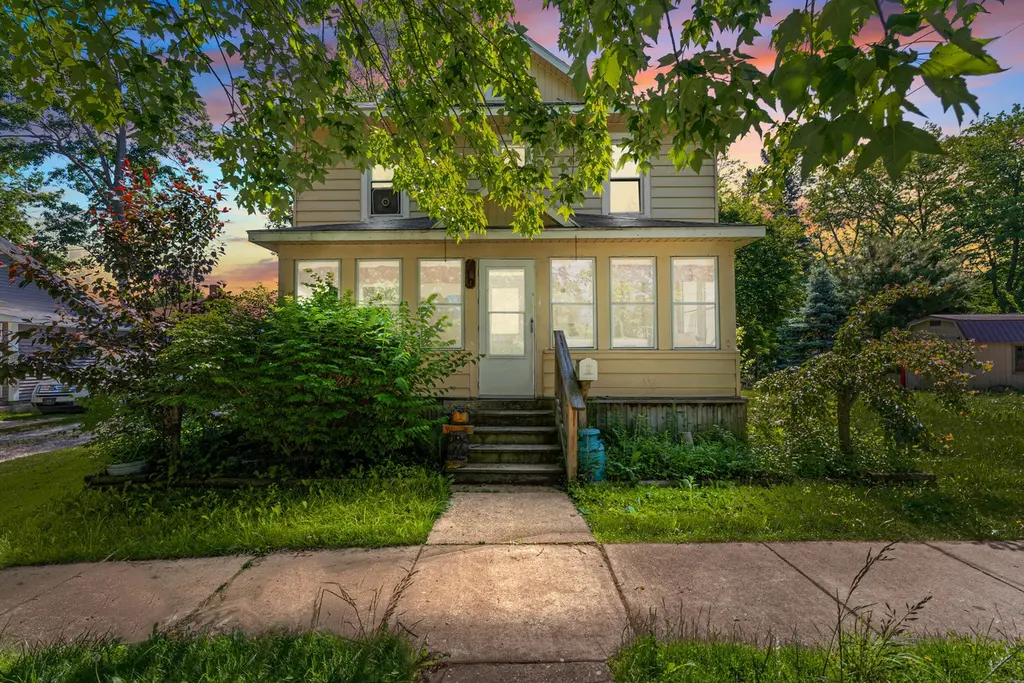
119 S Manning St · Hillsdale, MI
Flood risk 1/10 · Minimal
- FEMA flood zone
- X (unshaded)
- Chance of flooding over 30 yrs
- 0.0%
- Est. flood insurance / yr
- $473 – $860
Fire risk 1/10 · Minimal
- Est. fire insurance / yr
- $784 – $1,456
Heat risk 2/10 · Minimal
- Hot days now (above 97°F)
- 7 days/yr
- Hot days in 30 yrs
- 16 days/yr
Wind risk 2/10 · Minimal
- Chance of severe wind over 30 yrs
- —
Air-quality risk 2/10 · Minimal
- Unhealthy air days now
- 1 days/yr
- Unhealthy air days in 30 yrs
- 2 days/yr
Risk factors via First Street. Map © Google.
Why this score? — see what drove the C grade
The composite is a weighted blend of 9 inputs, each scored 0–100. Each bar is that input's sub-score; the figure is the points it added to the 100-point composite (weight × sub-score).
- Cash flow +19.4/30.0
- ARV discount +14.0/15.0
- DSCR +6.1/10.0
- 1% rule +4.6/10.0
- Livability +3.8/5.0
- Schools +2.7/10.0
- Rent growth +2.5/5.0
- Condition / age +2.5/5.0
- Appreciation +0.0/10.0
$157,000
🖨 Deal sheet 📄 Offer letter ✓ Due diligence
Listing remarks MLS
A true Diamond in the rough, sitting on a double lot and many started remolding projects is being sold as is. First floor, half bath, coffee bar, built in TV corner, eat in kitchen, Pantry and spice shelf, with a good start of a kitchen redo. Has a built in dog kennel for hold two dogs. Can be removed easily. Some New Wiring & Plumbing. Lauan has been placed on main floor, awaiting for final flooring to be placed. Enclosed front porch. Deep Freezer in the Basement will be left for the buyer. PLUS, any building materials will be left behind for Buyer. Very motivated Seller, Job transferred out of state. Offer's will be turned in as soon as received. Expecting multiple offer's so please HIGHEST & BEST OFFERS.
Key facts
- Built in tv corner
- Eat in kitchen
- Double lot
Tags
Property features AI
Exterior
- Utilities: Public water; Electricity available; Natural gas available and connected; Natural gas water heater
- Home design: Traditional style single-family residence; Built in 1902
- Construction: Aluminum siding; Composition roof; Living area approximately 2,184 (total building area listed as 1,456)
- Exterior features: Sidewalk; Paved road access
Interior
- Kitchen: Large galley kitchen; Dishwasher; Freezer; Microwave; Oven; Range; Refrigerator
- Bedrooms: Primary bedroom (11 x 12); Bedroom 2 (9 x 12); Bedroom 3 (10 x 10); Bedroom 4 (10 x 11); Additional room usable as a 5th bedroom or large storage room
- Bathrooms: One full bathroom (new 4-piece primary bath); One half bathroom
- Heating & cooling: Forced air heating
- Interior features: Pantry; Window treatments; Full basement
- Laundry & utility: Dedicated laundry room
Neighborhood map
What this means for you Summary
Snapshot
- This is a 4-bed/1.5-bath single-family listed at $157k.
Deal economics
- At list price, monthly cash flow is $177 ($2k/yr) — positive.
- The deal already cash-flows at list — no discount required.
- To meet the 1% rule (rent ≥ 1% of price), the offer needs to be $151k (4.0% below list).
- Recommended offer: $151k (4.0% below list) — sets the bar for 1% rule.
- Cap rate 7.6% vs local median 2.6% in Hillsdale — top-decile yield for the area; either an underpriced asset or a hidden risk that comps aren't pricing in. Stress-test before assuming the spread holds.
Location & tenants
- Location reads 75/100 on livability (#158 in MI, #4,063 nationally) — a middle-class / working-renter tenant base. Strengths: cost of living A+, housing A+, health & safety A+; Watch: employment D, commute F.
- Hillsdale Community Schools (town): math 26% / reading 38% proficiency, ranked #348 of 540 in MI (top 64%) — families likely to look elsewhere, expect single-tenant / working-renter base with shorter leases.
- Market conditions: 81 active listings in the ZIP; 1 comparable units currently listed for rent nearby; 72 units permitted in Hillsdale County in 2024 (0 in 5+ unit buildings).
Forward outlook
- Local home prices are declining (-3.0%/yr); year-one equity from $1k of loan paydown is wiped out by about $5k of value loss. Plan a longer hold.
- Hillsdale County population projected at -22% by 2050 — secular population decline; favor cash flow + early exit over multi-decade hold.
Negotiation context
- It's been on market 21 days — a 2% lower offer ($155k) is reasonable based on typical stale-listing flexibility.
- 12 sale attempts since 20y ago with the ask held roughly flat each time — persistent listings suggest the price (not the market) is what's stuck; bring a comps-based counter.
- Current owner paid $93k; list at $157k implies a 69% gain — meaningful room to come down on a strong offer.
Risks & watch-outs
- Watch-outs: built in 1902 — expect roof / HVAC / electrical / plumbing capex.
Questions for the listing agent
- Built in 1902 — when were the roof, HVAC, electrical panel, plumbing, and water heater last replaced?
- Is there a deadline driving the sale (1031 exchange, divorce, estate, relocation)? That informs how much negotiation room exists.
- What's the average days-on-market for RENTAL listings here right now (not sales)? A rising rental-DOM trend means longer vacancies and softer asking-rent achievability than the comps imply.
- What's the recent tenant-quality profile in this submarket — average credit score on applications, eviction rate, late-payment / NSF rate, and stable-employment percentage? A property-management company in the area should have these aggregated.
- How much new for-sale + rental construction is in the pipeline within 1–3 miles? Heavy new supply typically softens prices + rents 12–24 months out; constrained supply supports both.
Investment metrics
- 1% rule
- 0.96% ✗
- Cap rate
- 7.64%
- Cash-on-cash
- 4.82%
- DSCR
- 1.21
- GRM
- 8.7
CMA / ARV
- ARV (on-the-fly)
- $183,456
- Comps found
- 12
Show comp detail 12 sales within ~0.75 mi
| Address | Dist | Beds/Ba | Sqft | Sold | Price | $/sf | Match |
|---|---|---|---|---|---|---|---|
| 90 S Howell St | 0.11mi | 3/1.5 (-1) | 1,472 (+1%) | 4mo | $187,500 | $127 | 84 |
| 76 Budlong St | 0.16mi | 3/2.0 (-1) | 1,442 (-1%) | 1mo | $57,000 | $40 | 83 |
| 41 Charles St | 0.28mi | 3/1.0 (-1) | 1,512 (+4%) | 4mo | $172,500 | $114 | 70 |
| 10 Armstrong | 0.15mi | 3/1.5 (-1) | 1,298 (-11%) | 2mo | $135,000 | $104 | 68 |
| 100 S Manning St | 0.08mi | 4/1.5 | 1,660 (+14%) | 8mo | $240,000 | $145 | 66 |
| 98 Reading Ave | 0.33mi | 3/1.0 (-1) | 1,482 (+2%) | 11mo | $170,000 | $115 | 65 |
| 34 Charles St | 0.24mi | 3/2.0 (-1) | 1,528 (+5%) | 10mo | $192,500 | $126 | 65 |
| 64 Union St | 0.73mi | 4/2.0 | 1,460 (+0%) | 2mo | $184,000 | $126 | 62 |
| 158 W Saint Joe St | 0.56mi | 3/1.0 (-1) | 1,422 (-2%) | 2mo | $174,900 | $123 | 62 |
| 32 S West St | 0.31mi | 3/1.0 (-1) | 1,324 (-9%) | 12mo | $174,000 | $131 | 54 |
| 42 Westwood St | 0.57mi | 4/1.0 | 1,568 (+8%) | 8mo | $212,000 | $135 | 51 |
| 82 N Norwood St | 0.69mi | 3/1.5 (-1) | 1,265 (-13%) | 1mo | $140,000 | $111 | 40 |
Match score weights: distance 35% · size 25% · config 20% · recency 20%. Top-matched comps best support the ARV.
Projected returns pro-forma
-3.0% appreciation · 3.0% rent growth · sell at horizon
- IRR
- -8.8%
- Equity multiple
- 0.68×
- Total profit
- $-14,212
- Equity at exit
- $23,409
- IRR
- 0.7%
- Equity multiple
- 1.05×
- Total profit
- $2,026
- Equity at exit
- $13,574
Cash invested: $43,960 (down + closing). Projections, not guarantees.
Landlord ↔ Tenant lean methodology
- Overall (STATE)
- 62 Landlord-Friendly
- State Michigan
- 62 Landlord-Friendly · EVEN
- County
- — inherits STATE
- City
- — inherits STATE
ZIP-level market 49242
- Home prices YoY
- -31.2%
- Active inventory
- 81
- Price-to-rent
- 8.7×
Monthly cashflow live
- Estimated rent
- $1,507 medium interval (Pro) →
- Mortgage (P&I)
- −$823
- Tax from tax record
- −$125 /mo · $1,504/yr
- Insurance
- −$65
- HOA
- −$0
- Vacancy / Maint / Mgmt
- −$317
- Net cashflow
- $177
Break-even live
UW: 25.0% down · 7.5% · 30yr · 1.5% tax · 5.0% vac · 8.0% maint · 8.0% mgmt
Financing live
Cash to close
- Down payment
- $39,250
- Closing costs
- $4,710
- Reserves months
- —
- Total cash needed
- —
Loan-product check · same deal, 3 products live
Conventional
25% down · 7.5% · 30yr
- Down + closing
- —
- Monthly P&I
- —
- Monthly cashflow
- —
- DSCR
- —
- Eligible?
- —
Personal DTI + credit; lowest rate.
DSCR
20% down · 8.5% · 30yr
- Down + closing
- —
- Monthly P&I
- —
- Monthly cashflow
- —
- DSCR
- —
- Eligible?
- —
No personal income docs; deal must DSCR.
Hard money
10% down · 12.0% · 12mo
- Down + closing
- —
- Monthly P&I
- —
- Monthly cashflow
- —
- DSCR
- —
- Eligible?
- —
Short-term bridge; refi at stabilization.
Rent comps 1 comps
| Address | Beds | Baths | Sqft | Rent | $/sqft | DOM | Units | Dist |
|---|---|---|---|---|---|---|---|---|
| 34 Marion St Hillsdale, MI | 3.0 | 1.0–1.5 | 950 | $1,200 | $1.26 | 43d | 4 | 0.77mi |
Listing history 16 events
-
2026-06-19days on market $157,000 Active 21 DOM
-
2026-06-18days on market $157,000 Active 20 DOM
-
2026-06-17days on market $157,000 Active 19 DOM
-
2026-06-16days on market $157,000 Active 18 DOM
-
2026-06-15days on market $157,000 Active 17 DOM
-
2026-06-14days on market $157,000 Active 15 DOM
-
2026-06-12days on market $157,000 Active 14 DOM
-
2026-06-09days on market $157,000 Active 11 DOM
-
2026-06-08days on market $157,000 Active 10 DOM
-
2026-06-07pricedays on market $157,000 Active 9 DOM
-
2026-06-04days on market $165,000 Active 5 DOM
-
2026-06-02days on market $165,000 Active 4 DOM
-
2026-06-01days on market $165,000 Active 3 DOM
-
2026-05-31days on market $165,000 Active 2 DOM
-
2026-05-31remarks 695-char remark
-
2026-05-31$165,000 Active 1 DOM
ⓘ Source: listings_history table (triggers on properties + properties_extension) + one-shot
backfill from property_details.listing_events for pre-trigger history.
Tax reassessment forecast MI · Partial reset (capped growth)
- Current annual tax
- $1,504 · $125/mo
- Projected year-2 tax
- $1,961 · $163/mo
- Expected delta
- +$457/yr (+$38/mo · 30.4%)
ⓘ Screening estimate from a state-policy table — verify with the county assessor before closing.
Climate risk First Street
- Flood 1/10 Low FEMA zone X (unshaded) · 0% chance over 30 yrs
- Wildfire 1/10 Low
- Heat 2/10 Low 7 d/yr ≥97°F today · 16 d/yr by 30 yrs out
- Wind 2/10 Low
- Air quality 2/10 Low 1 unhealthy d/yr today · 2 by 30 yrs out
Nearby sold comps map
Loading sold comps map…
Walkable amenities ~0.75 mi
Loading nearby amenities…
Taxation est. · year 1
- Rental income
- $18,086
- − Mortgage interest
- −$8,794
- − Property taxes
- −$1,504
- − Insurance
- −$785
- − Repairs & maintenance
- −$1,447
- − Management
- −$1,447
- − Depreciation
- −$4,567
- Taxable loss
- −$458
- Est. tax savings @ 24.0%
- +$110
- After-tax cash flow
- $2,229/yr
For passive investors: Depreciation is non-cash, so a rental often shows a tax loss while cash-flowing — sheltering income. Rental losses are passive: they offset passive income freely, and up to $25,000/yr can offset ordinary (W-2) income if you actively participate and your MAGI is under $100k (phasing out to $0 by $150k); unused losses carry forward. On sale, claimed depreciation is recaptured at up to 25%, and gains may owe capital-gains tax (a 1031 exchange can defer both). Figures are a year-1 estimate at your 24.0% rate — not tax advice; consult a CPA.
Schools (NCES district)
- District
- Hillsdale Community Schools
- NCES district ID
- 2618390
- Math proficiency
- 26% ▼ -7.00%
- Reading proficiency
- 38% ▼ -5.00%
- Median HH income
- $38,652
- Composite
- 26.73/100
- National rank
- #7143
- State rank
- #348 of 540 in MI
Livability — Hillsdale
- Score
- 75/100
- State rank
- #158
- US rank
- #4063
Category grades
Schools grade is shown separately in the Schools card above.
Census & demographics
- Census place
- Hillsdale, MI
- County
- Hillsdale County · 14,750 people
- City population
- 14,750
- Metro
- Hillsdale, MI
- Population (ZIP)
- 14,750
- Household income
- $61,029
- Rent vs Own
- Severe rent burden
- 349.0
Population outlook (Hillsdale County) Hauer SSP2
- Today (2025)
- 43,704 people
- By 2030
- 41,996 · -3.9%
- By 2040
- 38,019 · -13.0%
- By 2050
- 34,095 · -22.0%
- By 2075
- 25,897 · -40.7%
- By 2100
- 18,746 · -57.1%
Race, ethnicity, and origin ACS 2023
- Neighborhood character
- Predominantly White (89%)
- Race & ethnicity
- White 89% Two or more races 5% Hispanic / Latino 4% Black 1%
- Common ancestry
- Romanian 4% Slovak 3% Lithuanian 2%
- Foreign-born
- 2% · Canada, Jamaica
- Languages at home
- 98% English-only · Other Indo-European 1%
Political lean MEDSL · Hillsdale
- 2024 margin
- Solid R (+51.4) · D 23.7% · R 75.1% · Other 1.2%
- 2008→2024 swing
- -39.4pp toward R · 2008: -12.0pp · 2024: -51.4pp
- All cycles
- 2024: R+51.4 2020: R+47.9 2016: R+46.8 2012: R+24.2 2008: R+12.0
Not yet ingested
- Civics
- —
Market trends
- HPI YoY
- ▼ -105.04%
- Current HPI
- 231.5167
- Rent YoY
- —
- Metro
- Hillsdale, MI
- State GDP YoY
- ▲ 1.37%
- F500 in state
- 28
Industry mix (Fortune 500 HQ in MI)
| Industry | F500 HQs | Revenue |
|---|---|---|
| Automotive Parts | 3 | $48B |
|
||
| Automotive | 2 | $372B |
|
||
| Chemicals | 1 | $45B |
|
||
| Automotive Retail | 1 | $29B |
|
||
| Healthcare / Medical Devices | 1 | $23B |
|
||
| Automotive Technology | 1 | $20B |
|
||
Price history
+58.8% since first listed28 events — show timeline
- 2026-05-30 Listed $165,000 SW Michigan MLS
- 2026-05-30 Listed $165,000 REALCOMP
- 2026-05-30 Listed $165,000 MiRealSource-MiMLS
- 2021-10-17 Price Changed $82,000 REALCOMP
- 2017-06-21 Sold (Public Records) $93,000 Public Records
- 2017-06-19 Sold (MLS) $93,000 MiRealSource-MiMLS
- 2017-06-19 Sold (MLS) $93,000 SW Michigan MLS
- 2017-06-19 Sold (MLS) $93,000 REALCOMP
- 2017-05-05 Contingent — MiRealSource-MiMLS
- 2017-05-05 Contingent — SW Michigan MLS
- 2017-04-18 Listed $84,900 MiRealSource-MiMLS
- 2017-04-18 Listed $84,900 SW Michigan MLS
- 2017-04-17 Listed $84,900 REALCOMP
- 2016-08-22 Listing Removed — SW Michigan MLS
- 2016-08-21 Listing Removed — MiRealSource-MiMLS
- 2016-07-05 Price Changed $82,000 MiRealSource-MiMLS
- 2016-07-05 Price Changed $82,000 SW Michigan MLS
- 2016-05-11 Listing Removed — REALCOMP
- 2016-04-22 Listed $84,900 REALCOMP
- 2016-02-04 Price Changed $84,900 MiRealSource-MiMLS
- 2016-02-03 Price Changed $84,900 SW Michigan MLS
- 2016-01-07 Listed $89,900 MiRealSource-MiMLS
- 2016-01-05 Listed $89,900 SW Michigan MLS
- 2015-12-17 Listing Removed — SW Michigan MLS
- 2006-11-08 Listing Removed — MiRealSource-MiMLS
- 2006-05-08 Listed $103,900 REALCOMP
- 2006-05-08 Listed $103,900 MiRealSource-MiMLS
- 2006-05-08 Listed $103,900 SW Michigan MLS
Property tax history
+3.5%/yrLatest (2025): $1,504 · -15.0% YoY. Source: county tax records.
Cash-flow waterfall
monthlySold comps — $/sqft
last 12 mo · ≤1 miLoading sold comps…