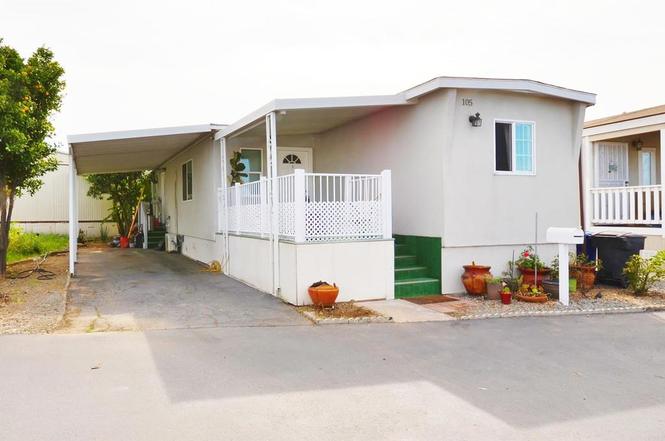
1425 Second Ave #105 · Chula Vista, CA
Flood risk 1/10 · Minimal
- FEMA flood zone
- X (unshaded)
- Chance of flooding over 30 yrs
- 0.0%
- Est. flood insurance / yr
- $507 – $1,088
Fire risk 1/10 · Minimal
- Est. fire insurance / yr
- $659 – $1,223
Heat risk 4/10 · Minor
- Hot days now (above 86°F)
- 6 days/yr
- Hot days in 30 yrs
- 16 days/yr
Wind risk 1/10 · Minimal
- Chance of severe wind over 30 yrs
- —
Air-quality risk 1/10 · Minimal
- Unhealthy air days now
- 0 days/yr
- Unhealthy air days in 30 yrs
- 0 days/yr
Risk factors via First Street. Map © Google.
Why this score? — see what drove the C+ grade
The composite is a weighted blend of 9 inputs, each scored 0–100. Each bar is that input's sub-score; the figure is the points it added to the 100-point composite (weight × sub-score).
- Cash flow +30.0/30.0
- DSCR +10.0/10.0
- 1% rule +9.3/10.0
- Schools +3.9/10.0
- Livability +3.8/5.0
- Condition / age +2.5/5.0
- Rent growth +1.9/5.0
- ARV discount +0.0/15.0
- Appreciation +0.0/10.0
$195,000
🖨 Deal sheet 📄 Offer letter ✓ Due diligence
Listing remarks
Manufacture home fully refurbished in 2021. Desirable gated 55+ community in the heart of Chula Vista. This 3-bedroom, 2 bath home. The home has an updated kitchen with modern cabinets, new laminated wood flooring throughout, updated bathrooms with new vanity and a laundry room for added convenience. It has a small private backyard with two storage sheds, and two parking spaces. The community allows one pet; dogs must be small breed. Residents enjoy access to a pool, clubhouse, recreation room. Conveniently located near shopping, dining, and major transportation routes, this home offers both comfort and accessibility. Space rent: $1240.00 per month plus utilities. Off-Street Parking availab
Key facts
- Gated community
- Modern cabinets
- Private backyard
Tags
Property features AI
Finance
- Other: Lot size and dimensions listed from public records/estimated
- Financial info: Buyer to verify assessments
- HOA & community: Senior community; Land lease in place (monthly land lease: $1,240); Manager approval required
Exterior
- Parking: 2 total parking spaces; 2 carport spaces; Located in Palace Garden Mobile Home Park
- Utilities: Public sewer
- Home design: Single-story; Mobile home remains (mobile dimensions: 14' x 53')
- Construction: Mobile construction (mobile width 14', length 53')
- Exterior features: Yard; Community pool; Curbs and sidewalks; Two sheds on the property
Interior
- Bedrooms: Living room (listed as a room type)
- Bathrooms: 2 full bathrooms
- Heating & cooling: Has cooling (details: see remarks)
- Interior features: Front entry; One-level home
- Laundry & utility: Washer/dryer hookups for gas and electric
Neighborhood map
What this means for you Summary
Snapshot
- This is a 3-bed/2.0-bath manufactured listed at $195k.
Deal economics
- At list price, monthly cash flow is $855 ($10k/yr) — positive.
- The deal already cash-flows at list — no discount required.
- Meets the 1% rule at list price ($3k rent vs $195k).
- Recommended offer: $172k (12.0% below list) — sets the bar for market timing.
- Cap rate 11.6% vs local median 2.7% in Chula Vista — top-decile yield for the area; either an underpriced asset or a hidden risk that comps aren't pricing in. Stress-test before assuming the spread holds.
Location & tenants
- Location reads 75/100 on livability (#127 in CA, #4,345 nationally) — a middle-class / working-renter tenant base. Strengths: amenities A+, commute A+, employment A+; Watch: health & safety C-, cost of living F.
- Sweetwater Union High (suburban): math 36% / reading 52% proficiency, ranked #187 of 517 in CA (top 36%) — families likely to look elsewhere, expect single-tenant / working-renter base with shorter leases.
- Zoned schools: Castle Park Senior High (math 30% / reading 56%, grade F, #460 of 1,170 statewide, top 40%, 1,433 students, 81% FRL) — zoned schools average 81% FRL vs 53% district-wide (27 pts higher); higher-poverty schools than district average — tighter screening recommended.
- Market conditions: Rents soft (-2.6%/yr); 159 active listings in the ZIP; 16 comparable units currently listed for rent nearby; rentals leasing fast (median 2d on market — plan ~1-2 weeks tenant-placement turnaround); solid renter incomes; 11,759 units permitted in San Diego County in 2024 (7,244 in 5+ unit buildings).
- This rent runs 41% of the median local income ($82k/yr) — at the standard rent-burdened threshold; future hikes will face affordability resistance.
Forward outlook
- Local home prices are declining (-3.0%/yr); year-one equity from $1k of loan paydown is wiped out by about $6k of value loss. Plan a longer hold.
- San Diego County population projected at +20% by 2050 — long-run rental-demand tailwind backs the buy-and-hold thesis.
- At projected returns (-3.0% appreciation + 0.0% rent growth), your $55k cash investment doubles in ~9 years — after that, you're playing with house money.
Negotiation context
- It's been on market 135 days — a 12% lower offer ($172k) is reasonable based on typical stale-listing flexibility.
Questions for the listing agent
- It's been on market 135 days. Have you received any prior offers? Is the seller open to a 12% concession, seller financing, or rate buy-down credit?
- Built in 1966 — when were the roof, HVAC, electrical panel, plumbing, and water heater last replaced?
- Why hasn't it sold? Are there any deal-killer items the seller is aware of (foundation, flood, title, zoning, code violations)?
- Is there a deadline driving the sale (1031 exchange, divorce, estate, relocation)? That informs how much negotiation room exists.
- Schools are B-rated — typically a magnet for longer-tenancy family renters. What's the average tenant stay here, and is there a school-zone premium baked into asking?
- What's the average days-on-market for RENTAL listings here right now (not sales)? A rising rental-DOM trend means longer vacancies and softer asking-rent achievability than the comps imply.
- What's the recent tenant-quality profile in this submarket — average credit score on applications, eviction rate, late-payment / NSF rate, and stable-employment percentage? A property-management company in the area should have these aggregated.
- How much new for-sale + rental construction is in the pipeline within 1–3 miles? Heavy new supply typically softens prices + rents 12–24 months out; constrained supply supports both.
Investment metrics
- 1% rule
- 1.43% ✓
- Cap rate
- 11.56%
- Cash-on-cash
- 18.80%
- DSCR
- 1.84
- GRM
- 5.8
CMA / ARV
- ARV (on-the-fly)
- $131,720
- Comps found
- 10
Show comp detail 10 sales within ~0.75 mi
| Address | Dist | Beds/Ba | Sqft | Sold | Price | $/sf | Match |
|---|---|---|---|---|---|---|---|
| 1425 Second Ave #329 | 0.05mi | 2/1.5 (-1) | 720 (+1%) | 14mo | $125,000 | $174 | 77 |
| 1425 2nd Ave #219 | 0.05mi | 2/1.0 (-1) | 770 (+8%) | 12mo | $142,000 | $184 | 65 |
| 121 Orange Ave Spc 67 | 0.29mi | 2/1.0 (-1) | 720 (+1%) | 14mo | $99,000 | $138 | 64 |
| 1425 2nd Ave #79 | 0.05mi | 2/1.0 (-1) | 780 (+10%) | 18mo | $155,000 | $199 | 58 |
| 1500 Third Avenue #44 | 0.48mi | 2/1.0 (-1) | 728 (+2%) | 12mo | $152,000 | $209 | 54 |
| 1500 Third Ave #13 | 0.54mi | 2/1.0 (-1) | 720 (+1%) | 16mo | $141,100 | $196 | 51 |
| 368 Anita St #4 | 0.54mi | 2/1.5 (-1) | 672 (-6%) | 14mo | $132,930 | $198 | 47 |
| 121 Orange Ave Spc 48 | 0.36mi | 2/1.0 (-1) | 800 (+12%) | 10mo | $95,000 | $119 | 45 |
| 444 Anita St Spc 9 | 0.71mi | 2/1.0 (-1) | 650 (-9%) | 10mo | $120,000 | $185 | 35 |
| 444 Anita St Spc 64 | 0.71mi | 2/1.0 (-1) | 800 (+12%) | 17mo | $133,000 | $166 | 23 |
Match score weights: distance 35% · size 25% · config 20% · recency 20%. Top-matched comps best support the ARV.
Projected returns pro-forma
-3.0% appreciation · 0.0% rent growth · sell at horizon
- IRR
- 7.2%
- Equity multiple
- 1.27×
- Total profit
- $14,753
- Equity at exit
- $29,075
- IRR
- 13.7%
- Equity multiple
- 1.94×
- Total profit
- $51,589
- Equity at exit
- $16,860
Cash invested: $54,600 (down + closing). Projections, not guarantees.
Landlord ↔ Tenant lean methodology
- Overall (STATE)
- 18 Strongly Tenant-Friendly
- State California
- 18 Strongly Tenant-Friendly · D+13
- County
- — inherits STATE
- City
- — inherits STATE
ZIP-level market 91911
- Rents YoY
- -2.6%
- Active inventory
- 159
- Price-to-rent
- 5.8×
Monthly cashflow live
- Estimated rent
- $2,789 high interval (Pro) →
- Mortgage (P&I)
- −$1,023
- Tax est. 1.5%
- −$244 /mo · $2,925/yr
- Insurance
- −$81
- HOA
- −$0
- Vacancy / Maint / Mgmt
- −$586
- Net cashflow
- $855
Break-even live
UW: 25.0% down · 7.5% · 30yr · 1.5% tax · 5.0% vac · 8.0% maint · 8.0% mgmt
Financing live
Cash to close
- Down payment
- $48,750
- Closing costs
- $5,850
- Reserves months
- —
- Total cash needed
- —
Loan-product check · same deal, 3 products live
Conventional
25% down · 7.5% · 30yr
- Down + closing
- —
- Monthly P&I
- —
- Monthly cashflow
- —
- DSCR
- —
- Eligible?
- —
Personal DTI + credit; lowest rate.
DSCR
20% down · 8.5% · 30yr
- Down + closing
- —
- Monthly P&I
- —
- Monthly cashflow
- —
- DSCR
- —
- Eligible?
- —
No personal income docs; deal must DSCR.
Hard money
10% down · 12.0% · 12mo
- Down + closing
- —
- Monthly P&I
- —
- Monthly cashflow
- —
- DSCR
- —
- Eligible?
- —
Short-term bridge; refi at stabilization.
Rent comps 16 comps
| Address | Beds | Baths | Sqft | Rent | $/sqft | DOM | Units | Dist |
|---|---|---|---|---|---|---|---|---|
| 240 Quintard St Chula Vista, CA | 1.0–2.0 | 1.0 | 662 | $2,400 | $3.62 | 1d | 4 | 0.19mi |
| 307 Orange Ave Chula Vista, CA | 1.0–2.0 | 1.0–2.0 | 662 | $2,225 | $3.36 | 1d | 2 | 0.42mi |
| 1487 Hilltop Dr Chula Vista, CA | 2.0 | 2.0 | 680 | $2,399 | $3.53 | 1d | 1 | 0.49mi |
| 1311 Fourth Ave Chula Vista, CA | 3.0 | 1.0–2.0 | 824 | $3,840 | $4.66 | 1d | 9 | 0.65mi |
| 3865 Main St Chula Vista, CA | 2.0 | 2.0 | 741 | $2,950 | $3.98 | 14d | 1 | 0.82mi |
| 3875 Main St Chula Vista, CA | 1.0–2.0 | 1.0–2.0 | 813 | $2,950 | $3.63 | 1d | 9 | 0.84mi |
| 128 E Orlando St Chula Vista, CA | 2.0 | 1.0 | 750 | $2,300 | $3.07 | 1d | 1 | 0.90mi |
| 1105 Fourth Ave Chula Vista, CA | 1.0–2.0 | 1.0–2.0 | 848 | $2,775 | $3.27 | 1d | 1 | 1.03mi |
| 1067 Fourth Ave Chula Vista, CA | 2.0 | 1.0–2.0 | 702 | $2,855 | $4.06 | 1d | 1 | 1.10mi |
| 1649 Marl Ave Unit 1 Chula Vista, CA | 2.0 | 1.0 | 750 | $2,500 | $3.33 | 1d | 1 | 1.12mi |
| 1649 Marl Ave Unit 2 Chula Vista, CA | 2.0 | 2.0 | 750 | $2,750 | $3.67 | 1d | 1 | 1.12mi |
| 555 Oxford St Chula Vista, CA | 1.0–2.0 | 1.0 | 579 | $2,362 | $4.08 | 1d | 1 | 1.13mi |
| 1225 Broadway Chula Vista, CA | 1.0–2.0 | 1.0–2.0 | 837 | $2,701 | $3.23 | 1d | 12 | 1.15mi |
| 368 Palm Ave Chula Vista, CA | 2.0 | 1.0 | 600 | $2,600 | $4.33 | 1d | 1 | 1.15mi |
| 248 E Olympia St Chula Vista, CA | 2.0 | 1.0 | 650 | $2,650 | $4.08 | 1d | 1 | 1.17mi |
| 3727 Byrd St San Diego, CA | 2.0 | 1.0 | 600 | $2,400 | $4.00 | 1d | 1 | 1.33mi |
Listing history 18 events
-
2026-06-18days on market $195,000 Active 135 DOM
-
2026-06-17days on market $195,000 Active 134 DOM
-
2026-06-16days on market $195,000 Active 133 DOM
-
2026-06-15days on market $195,000 Active 132 DOM
-
2026-06-13days on market $195,000 Active 130 DOM
-
2026-06-13days on market $195,000 Active 129 DOM
-
2026-06-09days on market $195,000 Active 126 DOM
-
2026-06-08days on market $195,000 Active 125 DOM
-
2026-06-07days on market $195,000 Active 124 DOM
-
2026-06-04days on market $195,000 Active 121 DOM
-
2026-06-03days on market $195,000 Active 120 DOM
-
2026-06-02days on market $195,000 Active 119 DOM
-
2026-06-01days on market $195,000 Active 118 DOM
-
2026-05-31days on market $195,000 Active 117 DOM
-
2026-04-13price $200,000
-
2026-03-17price $235,000
-
2026-02-09price $240,000
-
2026-02-02$250,000 Active
ⓘ Source: listings_history table (triggers on properties + properties_extension) + one-shot
backfill from property_details.listing_events for pre-trigger history.
Climate risk First Street
- Flood 1/10 Low FEMA zone X (unshaded) · 0% chance over 30 yrs
- Wildfire 1/10 Low
- Heat 4/10 Moderate 6 d/yr ≥86°F today · 16 d/yr by 30 yrs out
- Wind 1/10 Low
- Air quality 1/10 Low 0 unhealthy d/yr today · 0 by 30 yrs out
Nearby sold comps map
Loading sold comps map…
Walkable amenities ~0.75 mi
Loading nearby amenities…
Taxation est. · year 1
- Rental income
- $33,464
- − Mortgage interest
- −$10,923
- − Property taxes
- −$2,925
- − Insurance
- −$975
- − Repairs & maintenance
- −$2,677
- − Management
- −$2,677
- − Depreciation
- −$5,673
- Taxable income
- $7,614
- Est. tax owed @ 24.0%
- −$1,827
- After-tax cash flow
- $8,438/yr
For passive investors: Depreciation is non-cash, so a rental often shows a tax loss while cash-flowing — sheltering income. Rental losses are passive: they offset passive income freely, and up to $25,000/yr can offset ordinary (W-2) income if you actively participate and your MAGI is under $100k (phasing out to $0 by $150k); unused losses carry forward. On sale, claimed depreciation is recaptured at up to 25%, and gains may owe capital-gains tax (a 1031 exchange can defer both). Figures are a year-1 estimate at your 24.0% rate — not tax advice; consult a CPA.
Schools (NCES district)
- District
- Sweetwater Union High
- NCES district ID
- 0638640
- Math proficiency
- 36% ▲ 3.00%
- Reading proficiency
- 52% ▼ -2.00%
- Median HH income
- $59,051
- Composite
- 38.61/100
- National rank
- #4158
- State rank
- #187 of 517 in CA
Livability — Chula Vista
- Score
- 75/100
- State rank
- #127
- US rank
- #4345
Category grades
Schools grade is shown separately in the Schools card above.
Census & demographics
- Census place
- Chula Vista, CA
- County
- San Diego County · 3,178,799 people
- City population
- 255,708
- Metro
- San Diego-Chula Vista-Carlsbad, CA
- Population (ZIP)
- 85,542
- Household income
- $82,350
- Rent vs Own
- Severe rent burden
- 3751.0
Population outlook (San Diego County) Hauer SSP2
- Today (2025)
- 3,678,185 people
- By 2030
- 3,856,546 · +4.8%
- By 2040
- 4,171,407 · +13.4%
- By 2050
- 4,421,607 · +20.2%
- By 2075
- 4,831,599 · +31.4%
- By 2100
- 4,832,502 · +31.4%
Race, ethnicity, and origin ACS 2023
- Neighborhood character
- Predominantly Hispanic (75%)
- Race & ethnicity
- Hispanic / Latino 75% Two or more races 34% White 12% Asian 7% Black 4% Native American 1%
- Hispanic origin (detail)
- Mexican 71%
- Common ancestry
- Italian 1% Lithuanian 1%
- Foreign-born
- 32% · Canada, South Korea, Dominican Republic
- Languages at home
- 35% English-only · Spanish 59% Tagalog/Filipino 3% Other Asian/Pacific 1%
Political lean MEDSL · San Diego
- 2024 margin
- D (+16.8) · D 56.9% · R 40.1% · Other 2.9%
- 2008→2024 swing
- +6.6pp toward D · 2008: 10.2pp · 2024: 16.8pp
- All cycles
- 2024: D+16.8 2020: D+22.8 2016: D+17.8 2012: D+5.1 2008: D+10.2
Not yet ingested
- Civics
- —
Market trends
- HPI YoY
- ▼ -669.25%
- Current HPI
- 413.8287
- Rent YoY
- ▼ -2.56%
- Metro
- San Diego-Chula Vista-Carlsbad, CA
- State GDP YoY
- ▲ 3.21%
- F500 in state
- 116
Industry mix (Fortune 500 HQ in CA)
| Industry | F500 HQs | Revenue |
|---|---|---|
| Technology | 27 | $1,492B |
|
||
| Financial Services | 3 | $174B |
|
||
| Retail | 3 | $44B |
|
||
| Insurance | 3 | $26B |
|
||
| Media / Entertainment | 2 | $115B |
|
||
| Pharmaceuticals / Biotech | 2 | $62B |
|
||
Price history
-20.0% since first listed4 events — show timeline
- 2026-04-13 Price Changed $200,000 CRMLS
- 2026-03-17 Price Changed $235,000 CRMLS
- 2026-02-09 Price Changed $240,000 CRMLS
- 2026-02-02 Listed $250,000 CRMLS
Cash-flow waterfall
monthlySold comps — $/sqft
last 12 mo · ≤1 miLoading sold comps…