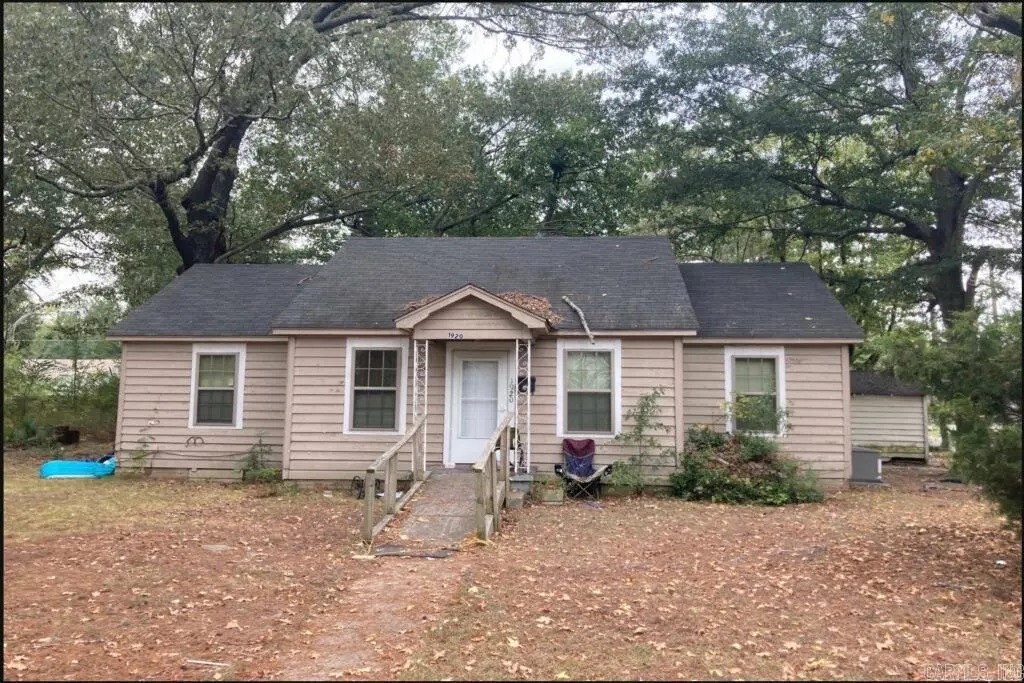
1920 W 25th Ave · Pine Bluff, AR
Flood risk 1/10 · Minimal
- FEMA flood zone
- X (unshaded)
- Chance of flooding over 30 yrs
- 0.0%
- Est. flood insurance / yr
- $507 – $1,088
Fire risk 1/10 · Minimal
- Est. fire insurance / yr
- $1,499 – $2,785
Heat risk 6/10 · Moderate
- Hot days now (above 110°F)
- 7 days/yr
- Hot days in 30 yrs
- 19 days/yr
Wind risk 4/10 · Minor
- Chance of severe wind over 30 yrs
- 20.0%
Air-quality risk 1/10 · Minimal
- Unhealthy air days now
- 0 days/yr
- Unhealthy air days in 30 yrs
- 0 days/yr
Risk factors via First Street. Map © Google.
Why this score? — see what drove the C grade
The composite is a weighted blend of 9 inputs, each scored 0–100. Each bar is that input's sub-score; the figure is the points it added to the 100-point composite (weight × sub-score).
- Cash flow +30.0/30.0
- 1% rule +10.0/10.0
- DSCR +10.0/10.0
- Rent growth +2.5/5.0
- Livability +2.5/5.0
- Condition / age +2.5/5.0
- Schools +0.6/10.0
- ARV discount +0.0/15.0
- Appreciation +0.0/10.0
$59,000
🖨 Deal sheet 📄 Offer letter ✓ Due diligence
Listing remarks
Property is being offered and sold via online auction. To participate, please register and submit bids on the property’s page at auction.com/privateseller. There is not a For Sale sign in the yard.
Key facts
- 9,147 sq ft lot
- Built 1941
- Listed 15 days
Property features AI
Finance
- HOA & community: Annual HOA frequency
Exterior
- Parking: Other parking (see remarks)
- Utilities: Public sewer; Public water; Other energy features (see remarks)
- Home design: Inside city limits
- Construction: Wood exterior; Composition roof; Piers foundation; Built on a 0.21-acre lot (approx.)
- Exterior features: Other exterior features (see remarks); Paved road access; Level lot
Interior
- Kitchen: Free-standing stove
- Flooring: Carpet
- Bathrooms: 1 full bathroom
- Heating & cooling: Other (see remarks)
- Interior features: Carpet flooring; Fireplace (see remarks); Other heating and cooling features (see remarks)
Neighborhood map
What this means for you Summary
Snapshot
- This is a 3-bed/1.0-bath single-family listed at $59k.
Deal economics
- At list price, monthly cash flow is $341 ($4k/yr) — positive.
- The deal already cash-flows at list — no discount required.
- Meets the 1% rule at list price ($921 rent vs $59k).
- Recommended offer: $58k (1.5% below list) — sets the bar for market timing.
- Cap rate 13.2% vs local median 9.0% in Pine Bluff — top-decile yield for the area; either an underpriced asset or a hidden risk that comps aren't pricing in. Stress-test before assuming the spread holds.
Location & tenants
- Location reads 50/100 on livability (#483 in AR) — a working-class tenant base; expect higher turnover. Strengths: cost of living A+, housing A; Watch: schools F, crime F, amenities F.
- Pine Bluff School District (urban): math 6% / reading 9% proficiency, ranked #236 of 238 in AR (top 99%) — low school quality limits family demand, transient renter base, plan for 1-2y turnover; 85% free/reduced lunch — lower-income household profile, screen leases tightly.
- Market conditions: 212 active listings in the ZIP; 12 comparable units currently listed for rent nearby; rentals lingering (median 44d on market — plan ~5-8 weeks vacancy on turnover, expect pricing pressure); 100% of comp listings sitting > 30 days — soft ceiling on asking rent; 62 units permitted in Jefferson County in 2024 (0 in 5+ unit buildings).
Forward outlook
- Local home prices are declining (-3.0%/yr); year-one equity from $408 of loan paydown is wiped out by about $2k of value loss. Plan a longer hold.
- Jefferson County population projected at -33% by 2050 — secular population decline; favor cash flow + early exit over multi-decade hold.
- At projected returns (-3.0% appreciation + 3.0% rent growth), your $17k cash investment doubles in ~5 years — after that, you're playing with house money.
Negotiation context
- It's been on market 16 days — a 2% lower offer ($58k) is reasonable based on typical stale-listing flexibility.
- Current owner paid $28k; list at $59k implies a 111% gain — meaningful room to come down on a strong offer.
Risks & watch-outs
- Watch-outs: built in 1941 — expect roof / HVAC / electrical / plumbing capex.
- Climate carrying-cost: extreme-heat days projected 7→19/yr by 2055 (HVAC capex compounding) — expect insurance premiums to compound above CPI over the hold.
Questions for the listing agent
- Built in 1941 — when were the roof, HVAC, electrical panel, plumbing, and water heater last replaced?
- Is there a deadline driving the sale (1031 exchange, divorce, estate, relocation)? That informs how much negotiation room exists.
- Schools are F-rated, which usually means shorter tenancies and higher turnover. Who's the typical renter profile here, and what's been the actual vacancy rate?
- Crime grade is F in this area — have there been break-ins, vandalism, or insurance claims at this property in the last 3 years? What carrier currently insures it and at what premium?
- What's the average days-on-market for RENTAL listings here right now (not sales)? A rising rental-DOM trend means longer vacancies and softer asking-rent achievability than the comps imply.
- What's the recent tenant-quality profile in this submarket — average credit score on applications, eviction rate, late-payment / NSF rate, and stable-employment percentage? A property-management company in the area should have these aggregated.
- How much new for-sale + rental construction is in the pipeline within 1–3 miles? Heavy new supply typically softens prices + rents 12–24 months out; constrained supply supports both.
Investment metrics
- 1% rule
- 1.56% ✓
- Cap rate
- 13.23%
- Cash-on-cash
- 24.76%
- DSCR
- 2.10
- GRM
- 5.3
CMA / ARV
- ARV (on-the-fly)
- $40,736
- Comps found
- 7
Show comp detail 7 sales within ~0.75 mi
| Address | Dist | Beds/Ba | Sqft | Sold | Price | $/sf | Match |
|---|---|---|---|---|---|---|---|
| 1507 W 24th Ave | 0.20mi | 3/1.0 | 1,053 (-2%) | 10mo | $70,000 | $66 | 80 |
| 1601 W 27th | 0.21mi | 3/1.0 | 996 (-7%) | 24mo | $25,000 | $25 | 58 |
| 2803 W 27 | 0.58mi | 2/1.0 (-1) | 980 (-9%) | 4mo | $37,000 | $38 | 50 |
| 2804 W 30th Ave | 0.69mi | 3/1.0 | 925 (-14%) | 1mo | $40,000 | $43 | 44 |
| 1911 W 30th Ave | 0.33mi | 3/2.0 | 1,224 (+14%) | 16mo | $17,000 | $14 | 44 |
| 1405 W 29th Ave | 0.37mi | 3/1.0 | 1,207 (+13%) | 22mo | $85,000 | $70 | 44 |
| 3101 S Ash St | 0.53mi | 3/1.5 | 1,228 (+15%) | 16mo | $33,500 | $27 | 36 |
Match score weights: distance 35% · size 25% · config 20% · recency 20%. Top-matched comps best support the ARV.
Projected returns pro-forma
-3.0% appreciation · 3.0% rent growth · sell at horizon
- IRR
- 18.2%
- Equity multiple
- 1.74×
- Total profit
- $12,148
- Equity at exit
- $8,797
- IRR
- 26.6%
- Equity multiple
- 3.33×
- Total profit
- $38,533
- Equity at exit
- $5,101
Cash invested: $16,520 (down + closing). Projections, not guarantees.
Landlord ↔ Tenant lean methodology
- Overall (STATE)
- 92 Strongly Landlord-Friendly
- State Arkansas
- 92 Strongly Landlord-Friendly · R+14
- County
- — inherits STATE
- City
- — inherits STATE
ZIP-level market 71603
- Home prices YoY
- -26.0%
- Active inventory
- 212
- Price-to-rent
- 5.3×
Monthly cashflow live
- Estimated rent
- $921 high interval (Pro) →
- Mortgage (P&I)
- −$309
- Tax from tax record
- −$52 /mo · $629/yr
- Insurance
- −$25
- HOA
- −$0
- Vacancy / Maint / Mgmt
- −$193
- Net cashflow
- $341
Break-even live
UW: 25.0% down · 7.5% · 30yr · 1.5% tax · 5.0% vac · 8.0% maint · 8.0% mgmt
Financing live
Cash to close
- Down payment
- $14,750
- Closing costs
- $1,770
- Reserves months
- —
- Total cash needed
- —
Loan-product check · same deal, 3 products live
Conventional
25% down · 7.5% · 30yr
- Down + closing
- —
- Monthly P&I
- —
- Monthly cashflow
- —
- DSCR
- —
- Eligible?
- —
Personal DTI + credit; lowest rate.
DSCR
20% down · 8.5% · 30yr
- Down + closing
- —
- Monthly P&I
- —
- Monthly cashflow
- —
- DSCR
- —
- Eligible?
- —
No personal income docs; deal must DSCR.
Hard money
10% down · 12.0% · 12mo
- Down + closing
- —
- Monthly P&I
- —
- Monthly cashflow
- —
- DSCR
- —
- Eligible?
- —
Short-term bridge; refi at stabilization.
Rent comps 12 comps
| Address | Beds | Baths | Sqft | Rent | $/sqft | DOM | Units | Dist |
|---|---|---|---|---|---|---|---|---|
| 1907 W 28th Ave Pine Bluff, AR | 3.0 | 1.5 | 947 | $1,150 | $1.21 | 44d | 1 | 0.18mi |
| 2001 W 28th Ave Pine Bluff, AR | 2.0 | 1.0 | 729 | $750 | $1.03 | 44d | 1 | 0.18mi |
| 2319 W 27th Ave Unit B Pine Bluff, AR | 2.0 | 1.0 | 907 | $795 | $0.88 | 44d | 1 | 0.29mi |
| 3008 S Elm St Pine Bluff, AR | 2.0 | 1.0 | 802 | $1,200 | $1.50 | 44d | 1 | 0.71mi |
| 3109 Daffodil St Pine Bluff, AR | 3.0 | 1.0 | 980 | $825 | $0.84 | 44d | 1 | 0.92mi |
| 2404 S Walnut St Pine Bluff, AR | 2.0 | 1.0 | 1100 | $700 | $0.64 | 44d | 1 | 0.92mi |
| 1107 S Cypress St Unit 1 Pine Bluff, AR | 2.0 | 1.0 | 875 | $700 | $0.80 | 44d | 1 | 0.95mi |
| 1901 W 40th Ave Pine Bluff, AR | 2.0 | 1.0 | 854 | $765 | $0.90 | 44d | 1 | 0.99mi |
| 301 W 33rd Ave Pine Bluff, AR | 2.0 | 1.5 | 871 | $760 | $0.87 | 44d | 1 | 1.10mi |
| 304 W Harding Ave Unit 3 Pine Bluff, AR | 2.0 | 1.0 | 1180 | $715 | $0.61 | 44d | 1 | 1.13mi |
| 501 W 12th Ave Apt 6 Pine Bluff, AR | 2.0 | 1.0 | 773 | $700 | $0.91 | 44d | 1 | 1.26mi |
| 301 W 11th Ave Unit 1 Pine Bluff, AR | 2.0 | 1.0 | 858 | $675 | $0.79 | 44d | 1 | 1.42mi |
Listing history 12 events
-
2026-06-19days on market $59,000 Active 16 DOM
-
2026-06-18days on market $59,000 Active 15 DOM
-
2026-06-17days on market $59,000 Active 14 DOM
-
2026-06-16days on market $59,000 Active 13 DOM
-
2026-06-15days on market $59,000 Active 12 DOM
-
2026-06-14days on market $59,000 Active 10 DOM
-
2026-06-12statusdays on market $59,000 Active 9 DOM
-
2026-06-09days on market $59,000 New Listing 6 DOM
-
2026-06-08days on market $59,000 New Listing 5 DOM
-
2026-06-07days on market $59,000 New Listing 4 DOM
-
2026-06-05remarks 197-char remark
-
2026-06-05$59,000 New Listing 1 DOM
ⓘ Source: listings_history table (triggers on properties + properties_extension) + one-shot
backfill from property_details.listing_events for pre-trigger history.
Tax reassessment forecast AR · Resets to sale price
- Current annual tax
- $629 · $52/mo
- Projected year-2 tax
- $629 · $52/mo
- Expected delta
- $0/yr ($0/mo · 0.0%)
ⓘ Screening estimate from a state-policy table — verify with the county assessor before closing.
Climate risk First Street
- Flood 1/10 Low FEMA zone X (unshaded) · 0% chance over 30 yrs
- Wildfire 1/10 Low
- Heat 6/10 Major 7 d/yr ≥110°F today · 19 d/yr by 30 yrs out
- Wind 4/10 Moderate 20% chance of damaging wind over 30 yrs
- Air quality 1/10 Low 0 unhealthy d/yr today · 0 by 30 yrs out
Nearby sold comps map
Loading sold comps map…
Walkable amenities ~0.75 mi
Loading nearby amenities…
Taxation est. · year 1
- Rental income
- $11,047
- − Mortgage interest
- −$3,305
- − Property taxes
- −$629
- − Insurance
- −$295
- − Repairs & maintenance
- −$884
- − Management
- −$884
- − Depreciation
- −$1,716
- Taxable income
- $3,334
- Est. tax owed @ 24.0%
- −$800
- After-tax cash flow
- $3,290/yr
For passive investors: Depreciation is non-cash, so a rental often shows a tax loss while cash-flowing — sheltering income. Rental losses are passive: they offset passive income freely, and up to $25,000/yr can offset ordinary (W-2) income if you actively participate and your MAGI is under $100k (phasing out to $0 by $150k); unused losses carry forward. On sale, claimed depreciation is recaptured at up to 25%, and gains may owe capital-gains tax (a 1031 exchange can defer both). Figures are a year-1 estimate at your 24.0% rate — not tax advice; consult a CPA.
Schools (NCES district)
- District
- Pine Bluff School District
- NCES district ID
- 0500026
- Math proficiency
- 6% ▼ -9.00%
- Reading proficiency
- 9% ▼ -7.00%
- Median HH income
- $32,374
- Composite
- 5.86/100
- National rank
- #10014
- State rank
- #236 of 238 in AR
Livability — Pine Bluff
- Score
- 50/100
- State rank
- #483
- US rank
- #25645
Category grades
Schools grade is shown separately in the Schools card above.
Census & demographics
- Census place
- Pine Bluff, AR
- County
- Jefferson County · 29,578 people
- City population
- 29,578
- Metro
- Pine Bluff, AR
- Population (ZIP)
- 29,578
- Household income
- $53,130
- Rent vs Own
- Severe rent burden
- 657.0
Population outlook (Jefferson County) Hauer SSP2
- Today (2025)
- 63,110 people
- By 2030
- 58,519 · -7.3%
- By 2040
- 49,740 · -21.2%
- By 2050
- 42,331 · -32.9%
- By 2075
- 29,591 · -53.1%
- By 2100
- 21,047 · -66.7%
Race, ethnicity, and origin ACS 2023
- Neighborhood character
- Majority Black (62%)
- Race & ethnicity
- Black 62% White 33% Two or more races 2% Hispanic / Latino 2%
- Common ancestry
- Italian 2% Slovak 1%
- Foreign-born
- 2% · Canada
- Languages at home
- 98% English-only · Spanish 1%
Political lean MEDSL · Jefferson
- 2024 margin
- Strong D (+20.1) · D 59.2% · R 39.2% · Other 1.6%
- 2008→2024 swing
- -6.2pp toward R · 2008: 26.3pp · 2024: 20.1pp
- All cycles
- 2024: D+20.1 2020: D+21.7 2016: D+25.3 2012: D+29.0 2008: D+26.3
Not yet ingested
- Civics
- —
Market trends
- HPI YoY
- ▼ -72.43%
- Current HPI
- 206.5994
- Rent YoY
- —
- Metro
- Pine Bluff, AR
- State GDP YoY
- ▲ 3.80%
- F500 in state
- 10
Industry mix (Fortune 500 HQ in AR)
| Industry | F500 HQs | Revenue |
|---|---|---|
| Retail | 1 | $681B |
|
||
| Food / Agriculture | 1 | $53B |
|
||
| Retail / Energy | 1 | $22B |
|
||
| Transportation / Logistics | 1 | $12B |
|
||
| Energy | 1 | $4B |
|
||
Price history
+110.7% since first listed2 events — show timeline
- 2026-05-30 Listed $59,000 CARMLS
- 1995-06-15 Sold (Public Records) $28,000 Public Records
Property tax history
+71.1%/yrLatest (2025): $629 · +0.1% YoY. Source: county tax records.
Cash-flow waterfall
monthlySold comps — $/sqft
last 12 mo · ≤1 miLoading sold comps…