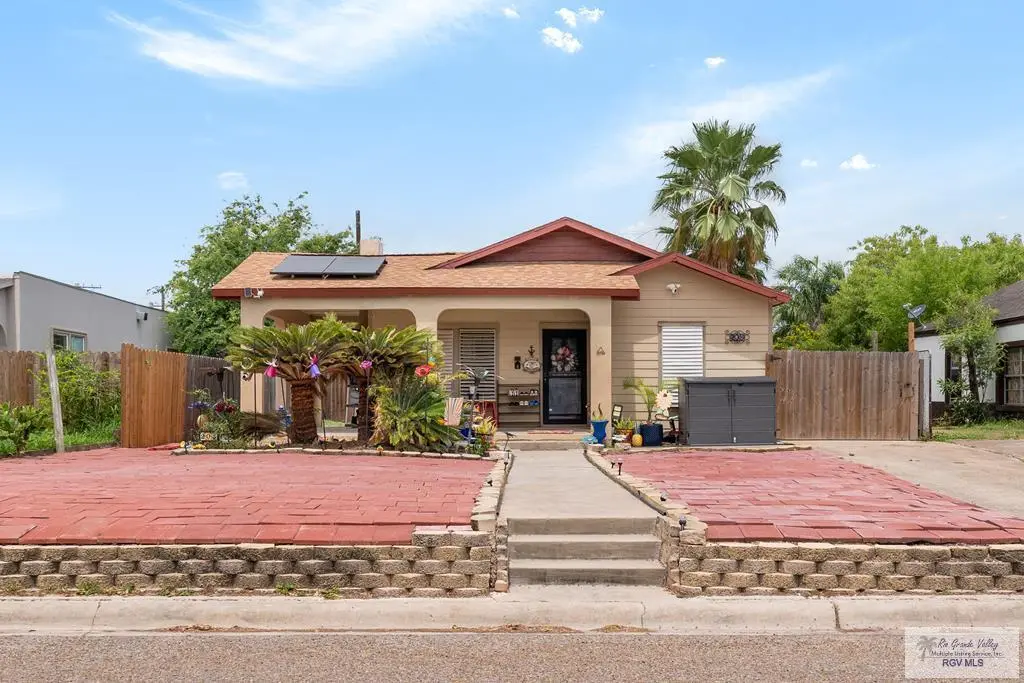
205 E Jefferson St · Port Isabel, TX
Flood risk 6/10 · Moderate
- FEMA flood zone
- X (shaded)
- Chance of flooding over 30 yrs
- 0.74%
- Est. flood insurance / yr
- $507 – $1,088
Fire risk 3/10 · Minor
- Est. fire insurance / yr
- $1,222 – $2,270
Heat risk 10/10 · Severe
- Hot days now (above 106°F)
- 7 days/yr
- Hot days in 30 yrs
- 27 days/yr
Wind risk 9/10 · Severe
- Chance of severe wind over 30 yrs
- 99.0%
Air-quality risk 2/10 · Minimal
- Unhealthy air days now
- 0 days/yr
- Unhealthy air days in 30 yrs
- 1 days/yr
Risk factors via First Street. Map © Google.
Why this score? — see what drove the B grade
The composite is a weighted blend of 9 inputs, each scored 0–100. Each bar is that input's sub-score; the figure is the points it added to the 100-point composite (weight × sub-score).
- Cash flow +28.6/30.0
- ARV discount +15.0/15.0
- DSCR +10.0/10.0
- 1% rule +8.3/10.0
- Livability +3.8/5.0
- Rent growth +2.5/5.0
- Condition / age +2.5/5.0
- Schools +1.9/10.0
- Appreciation +0.0/10.0
$275,000
🖨 Deal sheet 📄 Offer letter ✓ Due diligence
Listing remarks MLS
Charming 3-bedroom, 2-bath home in the heart of Port Isabel, just minutes from South Padre Island. Features a spacious living area and kitchen with granite countertops, custom cabinetry, and stainless steel appliances. The sunroom offers flexible space and can be converted into a 4th bedroom, office, or second living area. Exterior highlights include storm shutters, solar panels, a long gated driveway ideal for multiple vehicles, boats, or trailers, and a detached single-car garage perfect for storage or a workshop. Enjoy a backyard with patio space and a unique pond feature. Conveniently located near shopping, restaurants, and with quick access to SPI and Hwy 48 for commuting to the Port of Brownsville, LNG projects, and SpaceX. Close proximity to SpaceX employee transportation routes. Zoned multifamily residential (buyer to verify). Stove, dishwasher, washer and dryer, and living room TV convey.
Key facts
- Custom cabinetry
- Sunroom
- Storm shutters
Tags
Property features AI
Exterior
- Parking: Detached 1-car garage
- Utilities: Cable available
- Home design: Single-family residence; 1 story
- Construction: Vinyl siding; Slab foundation
- Exterior features: Composition roof
Interior
- Flooring: Hardwood; Tile
- Bathrooms: 2 full bathrooms
- Heating & cooling: Central heating (electric); Central air; Ceiling fans
- Interior features: Electric water heater; Crawl space basement
- Laundry & utility: Washer; Dryer
Neighborhood map
What this means for you Summary
Snapshot
- This is a 4-bed/2.0-bath single-family listed at $275k.
Deal economics
- At list price, monthly cash flow is $908 ($11k/yr) — positive.
- The deal already cash-flows at list — no discount required.
- Meets the 1% rule at list price ($4k rent vs $275k).
- Recommended offer: $267k (3.0% below list) — sets the bar for market timing.
- Cap rate 10.3% vs local median 3.4% in Port Isabel — top-decile yield for the area; either an underpriced asset or a hidden risk that comps aren't pricing in. Stress-test before assuming the spread holds.
Location & tenants
- Location reads 75/100 on livability (#157 in TX, #4,282 nationally) — a middle-class / working-renter tenant base. Strengths: cost of living A+, housing A+, health & safety A+; Watch: employment D, crime F, commute F.
- Point Isabel ISD (town): math 14% / reading 31% proficiency, ranked #756 of 826 in TX (top 92%) — low school quality limits family demand, transient renter base, plan for 1-2y turnover.
- Zoned schools: Garriga El (math 17% / reading 22%, grade F, #3,583 of 4,322 statewide, top 86%, 443 students, 96% FRL); Port Isabel J H (math 10% / reading 29%, grade F, #1,445 of 1,662 statewide, top 88%, 425 students, 84% FRL); Port Isabel H S (math 17% / reading 42%, grade F, #1,112 of 1,632 statewide, top 70%, 606 students, 82% FRL) — zoned schools average 87% FRL vs 35% district-wide (52 pts higher); higher-poverty schools than district average — tighter screening recommended.
- Market conditions: 254 active listings in the ZIP; 5 comparable units currently listed for rent nearby; rentals at typical pace (median 21d on market — plan ~3-4 weeks tenant-placement turnaround); 40% of comp listings sitting > 30 days — soft ceiling on asking rent; 2,326 units permitted in Cameron County in 2024 (503 in 5+ unit buildings).
Forward outlook
- Local home prices are declining (-3.0%/yr); year-one equity from $2k of loan paydown is wiped out by about $8k of value loss. Plan a longer hold.
- Cameron County population projected at +3% by 2050 — modest demand growth; plan on rents tracking national, not racing it.
- At projected returns (-3.0% appreciation + 3.0% rent growth), your $77k cash investment doubles in ~9 years — after that, you're playing with house money.
Negotiation context
- It's been on market 41 days — a 3% lower offer ($267k) is reasonable based on typical stale-listing flexibility.
- 8 sale attempts since 3y ago with the ask held roughly flat each time — persistent listings suggest the price (not the market) is what's stuck; bring a comps-based counter.
Risks & watch-outs
- Watch-outs: built in 1933 — expect roof / HVAC / electrical / plumbing capex.
- Climate carrying-cost: major flood risk; severe wind risk, 99% chance of damaging wind over 30y; extreme-heat days projected 7→27/yr by 2055 (HVAC capex compounding) — expect insurance premiums to compound above CPI over the hold.
Questions for the listing agent
- It's been on market 41 days. Have you received any prior offers? Is the seller open to a 3% concession, seller financing, or rate buy-down credit?
- Built in 1933 — when were the roof, HVAC, electrical panel, plumbing, and water heater last replaced?
- Is there a deadline driving the sale (1031 exchange, divorce, estate, relocation)? That informs how much negotiation room exists.
- Schools are F-rated, which usually means shorter tenancies and higher turnover. Who's the typical renter profile here, and what's been the actual vacancy rate?
- Crime grade is F in this area — have there been break-ins, vandalism, or insurance claims at this property in the last 3 years? What carrier currently insures it and at what premium?
- What's the average days-on-market for RENTAL listings here right now (not sales)? A rising rental-DOM trend means longer vacancies and softer asking-rent achievability than the comps imply.
- What's the recent tenant-quality profile in this submarket — average credit score on applications, eviction rate, late-payment / NSF rate, and stable-employment percentage? A property-management company in the area should have these aggregated.
- How much new for-sale + rental construction is in the pipeline within 1–3 miles? Heavy new supply typically softens prices + rents 12–24 months out; constrained supply supports both.
Investment metrics
- 1% rule
- 1.33% ✓
- Cap rate
- 10.26%
- Cash-on-cash
- 14.15%
- DSCR
- 1.63
- GRM
- 6.3
CMA / ARV
- ARV (median comp)
- $422,907
- List price
- $275,000
- Delta
- -34.97%
- Verdict
- UNDERPRICED
- Comps
- 7 within 1.0 mi
Projected returns pro-forma
-3.0% appreciation · 3.0% rent growth · sell at horizon
- IRR
- 4.5%
- Equity multiple
- 1.17×
- Total profit
- $13,382
- Equity at exit
- $41,003
- IRR
- 14.0%
- Equity multiple
- 2.12×
- Total profit
- $86,543
- Equity at exit
- $23,777
Cash invested: $77,000 (down + closing). Projections, not guarantees.
Landlord ↔ Tenant lean methodology
- Overall (STATE)
- 87 Strongly Landlord-Friendly
- State Texas
- 87 Strongly Landlord-Friendly · R+5
- County
- — inherits STATE
- City
- — inherits STATE
ZIP-level market 78578
- Home prices YoY
- -21.7%
- Active inventory
- 254
- Price-to-rent
- 6.3×
Monthly cashflow live
- Estimated rent
- $3,649 high interval (Pro) →
- Mortgage (P&I)
- −$1,442
- Tax from tax record
- −$418 /mo · $5,015/yr
- Insurance
- −$115
- HOA
- −$0
- Vacancy / Maint / Mgmt
- −$766
- Net cashflow
- $908
Break-even live
UW: 25.0% down · 7.5% · 30yr · 1.5% tax · 5.0% vac · 8.0% maint · 8.0% mgmt
Financing live
Cash to close
- Down payment
- $68,750
- Closing costs
- $8,250
- Reserves months
- —
- Total cash needed
- —
Loan-product check · same deal, 3 products live
Conventional
25% down · 7.5% · 30yr
- Down + closing
- —
- Monthly P&I
- —
- Monthly cashflow
- —
- DSCR
- —
- Eligible?
- —
Personal DTI + credit; lowest rate.
DSCR
20% down · 8.5% · 30yr
- Down + closing
- —
- Monthly P&I
- —
- Monthly cashflow
- —
- DSCR
- —
- Eligible?
- —
No personal income docs; deal must DSCR.
Hard money
10% down · 12.0% · 12mo
- Down + closing
- —
- Monthly P&I
- —
- Monthly cashflow
- —
- DSCR
- —
- Eligible?
- —
Short-term bridge; refi at stabilization.
Rent comps 5 comps
| Address | Beds | Baths | Sqft | Rent | $/sqft | DOM | Units | Dist |
|---|---|---|---|---|---|---|---|---|
| 711 Cisneros St Port Isabel, TX | 3.0 | 2.0 | 1366 | $2,000 | $1.46 | 43d | 1 | 0.28mi |
| 711 S Shore Dr Unit B Port Isabel, TX | 3.0 | 2.0 | 1458 | $4,000 | $2.74 | 43d | 1 | 0.39mi |
| 821 Tarpon Ave Port Isabel, TX | 3.0 | 3.0 | 1560 | $2,400 | $1.54 | 21d | 1 | 0.60mi |
| 1113 Pompano Ave Unit 1515052P Port Isabel, TX | 3.0 | 2.0 | 1991 | $7,195 | $3.61 | 13d | 1 | 0.74mi |
| 1209 Pompano Ave Unit 1515049P Port Isabel, TX | 3.0 | 2.0 | 1506 | $5,817 | $3.86 | 21d | 1 | 0.77mi |
Listing history 39 events
-
2026-06-18days on market $275,000 Active 41 DOM
-
2026-06-17days on market $275,000 Active 40 DOM
-
2026-06-16days on market $275,000 Active 39 DOM
-
2026-06-15days on market $275,000 Active 38 DOM
-
2026-06-14days on market $275,000 Active 36 DOM
-
2026-06-13days on market $275,000 Active 35 DOM
-
2026-06-10days on market $275,000 Active 33 DOM
-
2026-06-09days on market $275,000 Active 32 DOM
-
2026-06-09days on market $275,000 Active 31 DOM
-
2026-06-07days on market $275,000 Active 30 DOM
-
2026-06-03days on market $275,000 Active 26 DOM
-
2026-06-02days on market $275,000 Active 25 DOM
-
2026-06-01days on market $275,000 Active 24 DOM
-
2026-05-31days on market $275,000 Active 23 DOM
-
2026-05-30days on market $275,000 Active 22 DOM
-
2026-05-08$275,000 Active 910-char remark
-
2026-04-18$275,000 Active
-
2024-08-02soldstatus Closed
-
2024-08-02soldstatus
-
2024-08-02soldstatus
-
2024-06-06status Pending
-
2024-04-18$277,500 Active
-
2024-02-05price $270,000
-
2024-01-18price $275,000
-
2024-01-07status Active
-
2023-12-12status Active
-
2023-12-12price $280,000
-
2023-10-26price $285,000
-
2023-10-06price $295,000
-
2023-09-02status Active
-
2023-08-29price $299,000
-
2023-06-29price $310,000
-
2023-06-19price $293,000
-
2023-04-24$295,000 Active
-
2017-11-21soldstatus
-
2012-08-09soldstatus
-
2012-08-09soldstatus
-
2005-06-07soldstatus
-
2005-06-07soldstatus
ⓘ Source: listings_history table (triggers on properties + properties_extension) + one-shot
backfill from property_details.listing_events for pre-trigger history.
Tax reassessment forecast TX · Resets to sale price
- Current annual tax
- $5,015 · $418/mo
- Projected year-2 tax
- $5,032 · $419/mo
- Expected delta
- +$18/yr (+$1/mo · 0.4%)
ⓘ Screening estimate from a state-policy table — verify with the county assessor before closing.
Climate risk First Street
- Flood 6/10 Major FEMA zone X (shaded) · 74% chance over 30 yrs
- Wildfire 3/10 Moderate
- Heat 10/10 Extreme 7 d/yr ≥106°F today · 27 d/yr by 30 yrs out
- Wind 9/10 Extreme 99% chance of damaging wind over 30 yrs
- Air quality 2/10 Low 0 unhealthy d/yr today · 1 by 30 yrs out
Nearby sold comps map
Loading sold comps map…
Walkable amenities ~0.75 mi
Loading nearby amenities…
Taxation est. · year 1
- Rental income
- $43,789
- − Mortgage interest
- −$15,404
- − Property taxes
- −$5,015
- − Insurance
- −$1,375
- − Repairs & maintenance
- −$3,503
- − Management
- −$3,503
- − Depreciation
- −$8,000
- Taxable income
- $6,989
- Est. tax owed @ 24.0%
- −$1,677
- After-tax cash flow
- $9,221/yr
For passive investors: Depreciation is non-cash, so a rental often shows a tax loss while cash-flowing — sheltering income. Rental losses are passive: they offset passive income freely, and up to $25,000/yr can offset ordinary (W-2) income if you actively participate and your MAGI is under $100k (phasing out to $0 by $150k); unused losses carry forward. On sale, claimed depreciation is recaptured at up to 25%, and gains may owe capital-gains tax (a 1031 exchange can defer both). Figures are a year-1 estimate at your 24.0% rate — not tax advice; consult a CPA.
Schools (NCES district)
- District
- Point Isabel ISD
- NCES district ID
- 4835250
- Math proficiency
- 14% ▼ -24.00%
- Reading proficiency
- 31% ▼ -10.00%
- Median HH income
- $38,115
- Composite
- 18.78/100
- National rank
- #8871
- State rank
- #756 of 826 in TX
Livability — Port Isabel
- Score
- 75/100
- State rank
- #157
- US rank
- #4282
Category grades
Schools grade is shown separately in the Schools card above.
Census & demographics
- Census place
- Port Isabel, TX
- Population (ZIP)
- 10,231
Population outlook (Cameron County) Hauer SSP2
- Today (2025)
- 441,603 people
- By 2030
- 448,113 · +1.5%
- By 2040
- 456,385 · +3.3%
- By 2050
- 456,294 · +3.3%
- By 2075
- 423,851 · -4.0%
- By 2100
- 342,787 · -22.4%
Race, ethnicity, and origin ACS 2023
- Neighborhood character
- Majority Hispanic (63%)
- Race & ethnicity
- Hispanic / Latino 63% White 35% Two or more races 19%
- Hispanic origin (detail)
- Mexican 59%
- Common ancestry
- Lithuanian 2% Romanian 1% Slovak 1%
- Foreign-born
- 18% · Canada
- Languages at home
- 57% English-only · Spanish 42%
Political lean MEDSL · Cameron
- 2024 margin
- Lean R (+5.8) · D 46.7% · R 52.5%
- 2008→2024 swing
- -34.6pp toward R · 2008: 28.8pp · 2024: -5.8pp
- All cycles
- 2024: R+5.8 2020: D+13.2 2016: D+32.5 2012: D+32.4 2008: D+28.8
Not yet ingested
- Civics
- —
Market trends
- HPI YoY
- ▼ -61.69%
- Current HPI
- 222.9501
- Rent YoY
- —
- Metro
- —
- State GDP YoY
- ▲ 3.95%
- F500 in state
- 110
Industry mix (Fortune 500 HQ in TX)
| Industry | F500 HQs | Revenue |
|---|---|---|
| Energy | 16 | $1,198B |
|
||
| Technology | 5 | $198B |
|
||
| Engineering / Construction | 4 | $72B |
|
||
| Energy Services | 3 | $60B |
|
||
| Utilities | 3 | $41B |
|
||
| Healthcare | 2 | $330B |
|
||
Price history
-6.8% since first listed25 events — show timeline
- 2026-05-27 Listed $275,000 SPIBOR
- 2026-05-08 Listed $275,000 RGVMLS
- 2026-04-18 Listed $275,000 SPIBOR
- 2024-08-02 Sold (Public Records) — Public Records
- 2024-08-02 Sold (Public Records) — Public Records
- 2024-08-02 Sold (MLS) — SPIBOR
- 2024-06-06 Pending — SPIBOR
- 2024-04-18 Listed $277,500 SPIBOR
- 2024-02-05 Price Changed $270,000 SPIBOR
- 2024-01-18 Price Changed $275,000 SPIBOR
- 2024-01-07 Relisted — SPIBOR
- 2023-12-12 Relisted — SPIBOR
- 2023-12-12 Price Changed $280,000 SPIBOR
- 2023-10-26 Price Changed $285,000 SPIBOR
- 2023-10-06 Price Changed $295,000 SPIBOR
- 2023-09-02 Relisted — SPIBOR
- 2023-08-29 Price Changed $299,000 SPIBOR
- 2023-06-29 Price Changed $310,000 SPIBOR
- 2023-06-19 Price Changed $293,000 SPIBOR
- 2023-04-24 Listed $295,000 SPIBOR
- 2017-11-21 Sold (Public Records) — Public Records
- 2012-08-09 Sold (Public Records) — Public Records
- 2012-08-09 Sold (MLS) — SPIBOR
- 2005-06-07 Sold (Public Records) — Public Records
- 2005-06-07 Sold (Public Records) — Public Records
Property tax history
+8.9%/yrLatest (2025): $5,015 · +74.5% YoY. Source: county tax records.
Cash-flow waterfall
monthlySold comps — $/sqft
last 12 mo · ≤1 miLoading sold comps…