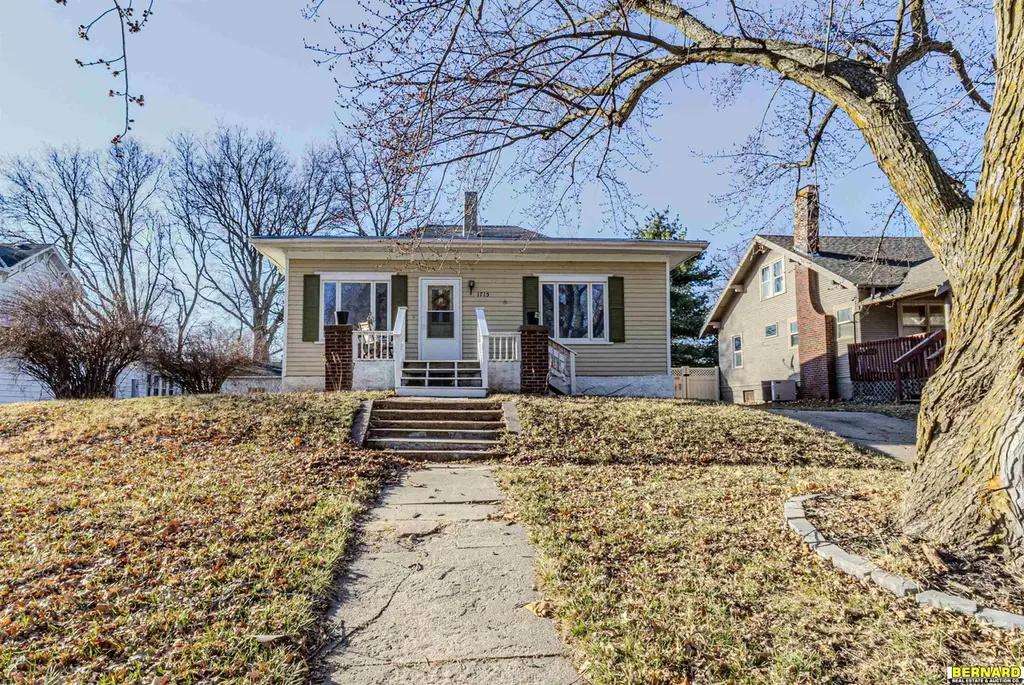
1715 4th Ave · Nebraska City, NE
Flood risk 1/10 · Minimal
- FEMA flood zone
- X (unshaded)
- Chance of flooding over 30 yrs
- 0.0%
- Est. flood insurance / yr
- $473 – $860
Fire risk 2/10 · Minimal
- Est. fire insurance / yr
- $1,161 – $2,155
Heat risk 3/10 · Minor
- Hot days now (above 104°F)
- 7 days/yr
- Hot days in 30 yrs
- 15 days/yr
Wind risk 2/10 · Minimal
- Chance of severe wind over 30 yrs
- —
Air-quality risk 1/10 · Minimal
- Unhealthy air days now
- 0 days/yr
- Unhealthy air days in 30 yrs
- 0 days/yr
Risk factors via First Street. Map © Google.
Why this score? — see what drove the C- grade
The composite is a weighted blend of 9 inputs, each scored 0–100. Each bar is that input's sub-score; the figure is the points it added to the 100-point composite (weight × sub-score).
- Cash flow +16.8/30.0
- ARV discount +15.0/15.0
- DSCR +5.2/10.0
- 1% rule +4.1/10.0
- Livability +4.0/5.0
- Rent growth +2.5/5.0
- Schools +2.5/10.0
- Condition / age +2.5/5.0
- Appreciation +0.0/10.0
$120,000
🖨 Deal sheet 📄 Offer letter ✓ Due diligence
Listing remarks MLS
Charming home with all the updates you're looking for in this move-in ready home. Main floor offers two bedrooms, full bath, large living/dining/kitchen area. All appliances are included. Lower level offers laundry area and abundant storage room. Enjoy your evenings on the back deck and large yard for family fun! Parking in back of property as well as on side of home.
Key facts
- Laundry area
- Large yard
- Parking in back
Tags
Neighborhood map
What this means for you Summary
Snapshot
- This is a 2-bed/1.0-bath single-family listed at $120k.
Deal economics
- At list price, monthly cash flow is $76 ($910/yr) — positive.
- The deal already cash-flows at list — no discount required.
- To meet the 1% rule (rent ≥ 1% of price), the offer needs to be $110k (8.7% below list).
- Recommended offer: $106k (12.0% below list) — sets the bar for market timing.
- Cap rate 7.1% vs local median 4.0% in Nebraska City — top-decile yield for the area; either an underpriced asset or a hidden risk that comps aren't pricing in. Stress-test before assuming the spread holds.
Location & tenants
- Location reads 80/100 on livability (#36 in NE, #1,882 nationally) — a professional / high-income tenant draw. Strengths: crime A+, cost of living A+, housing A+; Watch: schools D, commute F.
- Nebraska City Public Schools (town): math 26% / reading 32% proficiency, ranked #107 of 111 in NE (top 96%) — low school quality limits family demand, transient renter base, plan for 1-2y turnover.
- Market conditions: 33 active listings in the ZIP; 4 comparable units currently listed for rent nearby; rentals at typical pace (median 19d on market — plan ~3-4 weeks tenant-placement turnaround); 29 units permitted in Otoe County in 2024 (0 in 5+ unit buildings).
Forward outlook
- Local home prices are declining (-3.0%/yr); year-one equity from $830 of loan paydown is wiped out by about $4k of value loss. Plan a longer hold.
- Otoe County population projected at +4% by 2050 — modest demand growth; plan on rents tracking national, not racing it.
Negotiation context
- It's been on market 152 days — a 12% lower offer ($106k) is reasonable based on typical stale-listing flexibility.
- 2 sale attempts; this cycle's ask has dropped $12k (9%) from the opening price — seller is motivated, your offer sets the floor, not the list.
Risks & watch-outs
- Watch-outs: built in 1859 — expect roof / HVAC / electrical / plumbing capex.
Questions for the listing agent
- It's been on market 152 days. Have you received any prior offers? Is the seller open to a 12% concession, seller financing, or rate buy-down credit?
- Built in 1859 — when were the roof, HVAC, electrical panel, plumbing, and water heater last replaced?
- Why hasn't it sold? Are there any deal-killer items the seller is aware of (foundation, flood, title, zoning, code violations)?
- Is there a deadline driving the sale (1031 exchange, divorce, estate, relocation)? That informs how much negotiation room exists.
- Schools are D-rated, which usually means shorter tenancies and higher turnover. Who's the typical renter profile here, and what's been the actual vacancy rate?
- What's the average days-on-market for RENTAL listings here right now (not sales)? A rising rental-DOM trend means longer vacancies and softer asking-rent achievability than the comps imply.
- What's the recent tenant-quality profile in this submarket — average credit score on applications, eviction rate, late-payment / NSF rate, and stable-employment percentage? A property-management company in the area should have these aggregated.
- How much new for-sale + rental construction is in the pipeline within 1–3 miles? Heavy new supply typically softens prices + rents 12–24 months out; constrained supply supports both.
Investment metrics
- 1% rule
- 0.91% ✗
- Cap rate
- 7.05%
- Cash-on-cash
- 2.71%
- DSCR
- 1.12
- GRM
- 9.1
CMA / ARV
- ARV (median comp)
- $146,554
- List price
- $120,000
- Delta
- -18.12%
- Verdict
- UNDERPRICED
- Comps
- 20 within 1.0 mi
Show comp detail 9 sales within ~0.75 mi
| Address | Dist | Beds/Ba | Sqft | Sold | Price | $/sf | Match |
|---|---|---|---|---|---|---|---|
| 1515 2nd Ave | 0.19mi | 2/1.0 | 860 (+2%) | 2mo | $140,000 | $163 | 86 |
| 511 N 17th St | 0.05mi | 2/1.0 | 898 (+7%) | 2mo | $167,500 | $187 | 84 |
| 2007 2nd Ave | 0.22mi | 2/1.0 | 859 (+2%) | 5mo | $165,000 | $192 | 81 |
| 1716 4 Ave | 0.03mi | 3/1.0 (+1) | 952 (+13%) | 4mo | $170,000 | $179 | 68 |
| 2110 2nd Ave | 0.26mi | 2/1.5 | 912 (+9%) | 5mo | $170,000 | $186 | 68 |
| 2115 Central Ave | 0.35mi | 2/1.0 | 774 (-8%) | 14mo | $100,000 | $129 | 59 |
| 1708 2nd Ave | 0.10mi | 2/1.0 | 952 (+13%) | 21mo | $162,360 | $171 | 56 |
| 811 N 9th St | 0.62mi | 2/1.5 | 850 (+1%) | 16mo | $149,350 | $176 | 54 |
| 902 8th Ave | 0.63mi | 2/1.5 | 720 (-14%) | 17mo | $160,000 | $222 | 30 |
Match score weights: distance 35% · size 25% · config 20% · recency 20%. Top-matched comps best support the ARV.
Projected returns pro-forma
-3.0% appreciation · 3.0% rent growth · sell at horizon
- IRR
- -12.0%
- Equity multiple
- 0.56×
- Total profit
- $-14,623
- Equity at exit
- $17,892
- IRR
- -2.9%
- Equity multiple
- 0.81×
- Total profit
- $-6,546
- Equity at exit
- $10,375
Cash invested: $33,600 (down + closing). Projections, not guarantees.
Landlord ↔ Tenant lean methodology
- Overall (STATE)
- 83 Strongly Landlord-Friendly
- State Nebraska
- 83 Strongly Landlord-Friendly · R+13
- County
- — inherits STATE
- City
- — inherits STATE
ZIP-level market 68410
- Home prices YoY
- -31.5%
- Active inventory
- 33
- Price-to-rent
- 9.1×
Monthly cashflow live
- Estimated rent
- $1,096 medium interval (Pro) →
- Mortgage (P&I)
- −$629
- Tax from tax record
- −$111 /mo · $1,327/yr
- Insurance
- −$50
- HOA
- −$0
- Vacancy / Maint / Mgmt
- −$230
- Net cashflow
- $76
Break-even live
UW: 25.0% down · 7.5% · 30yr · 1.5% tax · 5.0% vac · 8.0% maint · 8.0% mgmt
Financing live
Cash to close
- Down payment
- $30,000
- Closing costs
- $3,600
- Reserves months
- —
- Total cash needed
- —
Loan-product check · same deal, 3 products live
Conventional
25% down · 7.5% · 30yr
- Down + closing
- —
- Monthly P&I
- —
- Monthly cashflow
- —
- DSCR
- —
- Eligible?
- —
Personal DTI + credit; lowest rate.
DSCR
20% down · 8.5% · 30yr
- Down + closing
- —
- Monthly P&I
- —
- Monthly cashflow
- —
- DSCR
- —
- Eligible?
- —
No personal income docs; deal must DSCR.
Hard money
10% down · 12.0% · 12mo
- Down + closing
- —
- Monthly P&I
- —
- Monthly cashflow
- —
- DSCR
- —
- Eligible?
- —
Short-term bridge; refi at stabilization.
Rent comps 4 comps
| Address | Beds | Baths | Sqft | Rent | $/sqft | DOM | Units | Dist |
|---|---|---|---|---|---|---|---|---|
| 1413 2nd Ave Unit 2 Nebraska City, NE | 2.0 | 1.0 | 1100 | $1,150 | $1.05 | 19d | 1 | 0.22mi |
| 1306 1st Ave Unit 2 Nebraska City, NE | 1.0 | 1.0 | 850 | $1,100 | $1.29 | 1d | 1 | 0.31mi |
| 1116 S 2nd St Unit 207 Nebraska City, NE | 2.0 | 1.0 | 735 | $895 | $1.22 | 10d | 1 | 1.35mi |
| 1216 S 2nd St Unit 201 Nebraska City, NE | 3.0 | 1.0 | 892 | $995 | $1.12 | 43d | 1 | 1.38mi |
Listing history 19 events
-
2026-06-18status $120,000 Pending 152 DOM
-
2026-06-18days on market $120,000 Active 152 DOM
-
2026-06-17days on market $120,000 Active 151 DOM
-
2026-06-16days on market $120,000 Active 150 DOM
-
2026-06-15days on market $120,000 Active 149 DOM
-
2026-06-13days on market $120,000 Active 147 DOM
-
2026-06-12days on market $120,000 Active 146 DOM
-
2026-06-09days on market $120,000 Active 143 DOM
-
2026-06-08days on market $120,000 Active 142 DOM
-
2026-06-07days on market $120,000 Active 141 DOM
-
2026-06-07days on market $120,000 Active 140 DOM
-
2026-06-04days on market $120,000 Active 137 DOM
-
2026-06-02days on market $120,000 Active 136 DOM
-
2026-06-01days on market $120,000 Active 135 DOM
-
2026-05-31days on market $120,000 Active 134 DOM
-
2026-02-27price $120,000 370-char remark
Show marketing remark (370 chars)
Charming home with all the updates you're looking for in this move-in ready home. Main floor offers two bedrooms, full bath, large living/dining/kitchen area. All appliances are included. Lower level offers laundry area and abundant storage room. Enjoy your evenings on the back deck and large yard for family fun! Parking in back of property as well as on side of home.
-
2026-01-15$132,000 New 370-char remark
Show marketing remark (370 chars)
Charming home with all the updates you're looking for in this move-in ready home. Main floor offers two bedrooms, full bath, large living/dining/kitchen area. All appliances are included. Lower level offers laundry area and abundant storage room. Enjoy your evenings on the back deck and large yard for family fun! Parking in back of property as well as on side of home.
-
2026-01-11historical
-
2025-08-25$145,000 New
ⓘ Source: listings_history table (triggers on properties + properties_extension) + one-shot
backfill from property_details.listing_events for pre-trigger history.
Tax reassessment forecast NE · Resets to sale price
- Current annual tax
- $1,327 · $111/mo
- Projected year-2 tax
- $2,076 · $173/mo
- Expected delta
- +$749/yr (+$62/mo · 56.4%)
ⓘ Screening estimate from a state-policy table — verify with the county assessor before closing.
Climate risk First Street
- Flood 1/10 Low FEMA zone X (unshaded) · 0% chance over 30 yrs
- Wildfire 2/10 Low
- Heat 3/10 Moderate 7 d/yr ≥104°F today · 15 d/yr by 30 yrs out
- Wind 2/10 Low
- Air quality 1/10 Low 0 unhealthy d/yr today · 0 by 30 yrs out
Nearby sold comps map
Loading sold comps map…
Walkable amenities ~0.75 mi
Loading nearby amenities…
Taxation est. · year 1
- Rental income
- $13,150
- − Mortgage interest
- −$6,722
- − Property taxes
- −$1,327
- − Insurance
- −$600
- − Repairs & maintenance
- −$1,052
- − Management
- −$1,052
- − Depreciation
- −$3,491
- Taxable loss
- −$1,094
- Est. tax savings @ 24.0%
- +$263
- After-tax cash flow
- $1,172/yr
For passive investors: Depreciation is non-cash, so a rental often shows a tax loss while cash-flowing — sheltering income. Rental losses are passive: they offset passive income freely, and up to $25,000/yr can offset ordinary (W-2) income if you actively participate and your MAGI is under $100k (phasing out to $0 by $150k); unused losses carry forward. On sale, claimed depreciation is recaptured at up to 25%, and gains may owe capital-gains tax (a 1031 exchange can defer both). Figures are a year-1 estimate at your 24.0% rate — not tax advice; consult a CPA.
Schools (NCES district)
- District
- Nebraska City Public Schools
- NCES district ID
- 3174160
- Math proficiency
- 26% ▼ -7.00%
- Reading proficiency
- 32% ▼ -2.00%
- Median HH income
- $46,153
- Composite
- 24.99/100
- National rank
- #7559
- State rank
- #107 of 111 in NE
Livability — Nebraska City
- Score
- 80/100
- State rank
- #36
- US rank
- #1882
Category grades
Schools grade is shown separately in the Schools card above.
Census & demographics
- Census place
- Nebraska City, NE
- Population (ZIP)
- 8,946
Population outlook (Otoe County) Hauer SSP2
- Today (2025)
- 16,475 people
- By 2030
- 16,627 · +0.9%
- By 2040
- 16,911 · +2.6%
- By 2050
- 17,186 · +4.3%
- By 2075
- 18,549 · +12.6%
- By 2100
- 19,590 · +18.9%
Race, ethnicity, and origin ACS 2023
- Neighborhood character
- Predominantly White (83%)
- Race & ethnicity
- White 83% Hispanic / Latino 12% Two or more races 7% Black 1%
- Hispanic origin (detail)
- Mexican 2%
- Common ancestry
- Romanian 3% Italian 2% Iranian 1%
- Foreign-born
- 11% · Canada, Jamaica
- Languages at home
- 89% English-only · Spanish 10%
Political lean MEDSL · Otoe
- 2024 margin
- Solid R (+38.9) · D 30.0% · R 68.9% · Other 1.0%
- 2008→2024 swing
- -23.1pp toward R · 2008: -15.8pp · 2024: -38.9pp
- All cycles
- 2024: R+38.9 2020: R+37.8 2016: R+38.7 2012: R+24.4 2008: R+15.8
Not yet ingested
- Civics
- —
Market trends
- HPI YoY
- ▼ -87.60%
- Current HPI
- 190.5812
- Rent YoY
- —
- Metro
- —
- State GDP YoY
- ▲ 0.68%
- F500 in state
- 2
Industry mix (Fortune 500 HQ in NE)
| Industry | F500 HQs | Revenue |
|---|---|---|
| Conglomerate | 1 | $371B |
|
||
Price history
-17.2% since first listed4 events — show timeline
- 2026-02-27 Price Changed $120,000 GPRMLS
- 2026-01-15 Listed $132,000 GPRMLS
- 2026-01-11 Listing Removed — GPRMLS
- 2025-08-25 Listed $145,000 GPRMLS
Property tax history
+0.3%/yrLatest (2025): $1,327 · +11.4% YoY. Source: county tax records.
Cash-flow waterfall
monthlySold comps — $/sqft
last 12 mo · ≤1 miLoading sold comps…