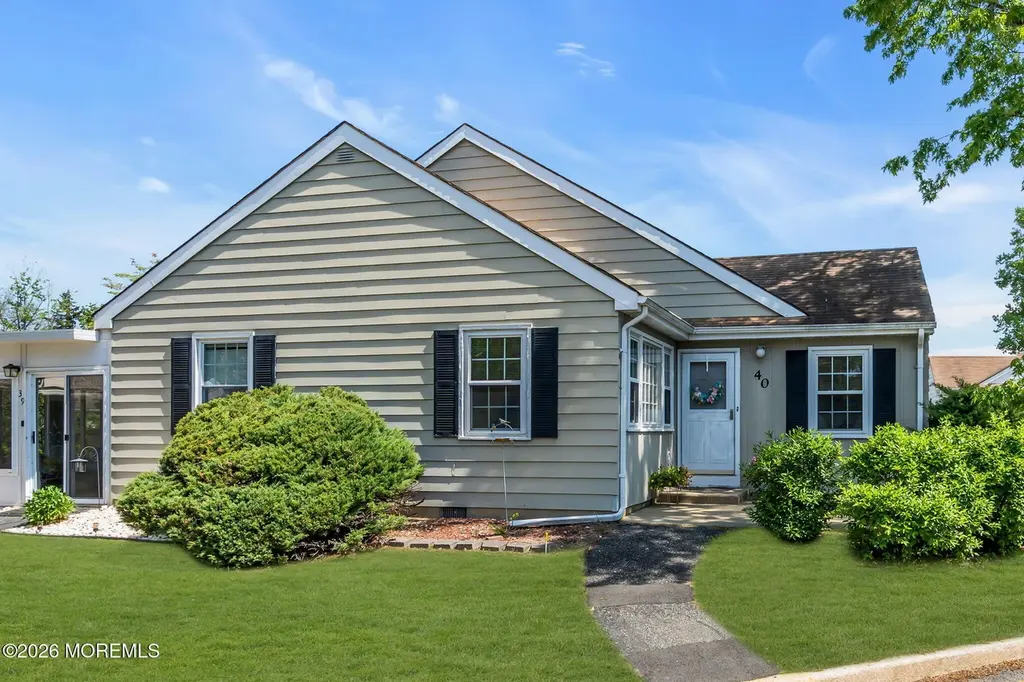
40 Dover Walk #540 · Toms River, NJ
Flood risk 1/10 · Minimal
- FEMA flood zone
- X (unshaded)
- Chance of flooding over 30 yrs
- 0.0%
- Est. flood insurance / yr
- $507 – $1,088
Fire risk 3/10 · Minor
- Est. fire insurance / yr
- $526 – $976
Heat risk 7/10 · Major
- Hot days now (above 100°F)
- 7 days/yr
- Hot days in 30 yrs
- 15 days/yr
Wind risk 6/10 · Moderate
- Chance of severe wind over 30 yrs
- 72.0%
Air-quality risk 3/10 · Minor
- Unhealthy air days now
- 3 days/yr
- Unhealthy air days in 30 yrs
- 4 days/yr
Risk factors via First Street. Map © Google.
Why this score? — see what drove the B- grade
The composite is a weighted blend of 9 inputs, each scored 0–100. Each bar is that input's sub-score; the figure is the points it added to the 100-point composite (weight × sub-score).
- Cash flow +26.8/30.0
- 1% rule +9.3/10.0
- DSCR +9.2/10.0
- ARV discount +7.9/15.0
- Livability +4.0/5.0
- Condition / age +3.8/5.0
- Rent growth +2.9/5.0
- Schools +2.9/10.0
- Appreciation +0.0/10.0
$164,999
🖨 Deal sheet (PDF) 📄 Offer letter ✓ Due diligence
Listing remarks
Welcome home to this clean and freshly painted 2-bedroom, 1-bath property, offering a spacious living/dining room perfect for everyday living and entertaining. The primary bedroom features two large closets. The second bedroom provides convenient back door access and a storage space, adding flexibility to the layout. A large stand-up attic with electric and a walk-in cedar closet offers excellent storage, and the brand new refrigerator adds a fresh touch to the kitchen. Located on a quiet street close to the Parkway and local stores, this home combines comfort, convenience, and charm. Grass enhanced. Virtual staging pictures are AI generated.
Key facts
- 1,306 sq ft lot
- Parking
- Built 1971
Property features AI
Finance
- HOA & community: Monthly association fee of $341; HOA covers trash, lawn maintenance, and water
Exterior
- Parking: No garage
- Utilities: Public sewer
- Home design: Condominium; Attached property
- Exterior features: Shingle roof
Interior
- Kitchen: Dishwasher; Refrigerator
- Bedrooms: 2 bedrooms
- Bathrooms: 1 full bathroom
- Heating & cooling: Electric heating; Baseboard heating; Electric cooling
- Interior features: Blinds/Shades; Attic fan
- Laundry & utility: Washer; Dryer
Neighborhood map
What this means for you Summary
Snapshot
- This is a 2-bed/1.0-bath condo listed at $165k. Condition is rated good.
Deal economics
- At list price, monthly cash flow is $451 ($5k/yr) — positive.
- The deal already cash-flows at list — no discount required.
- Meets the 1% rule at list price ($2k rent vs $165k).
- Recommended offer: $163k (1.5% below list) — sets the bar for market timing.
- Cap rate 9.6% vs local median 3.8% in Toms River — top-decile yield for the area; either an underpriced asset or a hidden risk that comps aren't pricing in. Stress-test before assuming the spread holds.
Location & tenants
- Location reads 81/100 on livability (#61 in NJ, #1,538 nationally) — a professional / high-income tenant draw. Strengths: employment A+, housing A+, health & safety A+; Watch: commute D, cost of living F.
- Toms River Regional School District (suburban): math 18% / reading 44% proficiency, ranked #316 of 472 in NJ (top 67%) — families likely to look elsewhere, expect single-tenant / working-renter base with shorter leases.
- Zoned schools: Walnut Street Elementary School (math 14% / reading 35%, grade F, #878 of 1,303 statewide, top 70%, 739 students, 51% FRL); Toms River Intermediate School North (math 18% / reading 49%, grade F, #265 of 431 statewide, top 63%, 1,012 students, 38% FRL); Toms River High School North (math 24% / reading 52%, grade F, #210 of 399 statewide, top 53%, 1,931 students, 28% FRL) — zoned schools average 39% FRL vs 22% district-wide (17 pts higher); higher-poverty schools than district average — tighter screening recommended.
- Market conditions: Rents rising (+1.5%/yr); 435 active listings in the ZIP; 8 comparable units currently listed for rent nearby; rentals at typical pace (median 26d on market — plan ~3-4 weeks tenant-placement turnaround); solid renter incomes; 4,434 units permitted in Ocean County in 2024 (868 in 5+ unit buildings).
Forward outlook
- Local home prices are declining (-3.0%/yr); year-one equity from $1k of loan paydown is wiped out by about $5k of value loss. Plan a longer hold.
- Ocean County population projected to shrink 8% by 2050 — rents likely to lag national; underwrite the cash flow, not the appreciation.
Negotiation context
- It's been on market 23 days — a 2% lower offer ($163k) is reasonable based on typical stale-listing flexibility.
Risks & watch-outs
- Climate carrying-cost: major wind risk, 72% chance of damaging wind over 30y; extreme-heat days projected 7→15/yr by 2055 (HVAC capex compounding) — expect insurance premiums to compound above CPI over the hold.
Questions for the listing agent
- Built in 1971 — when were the roof, HVAC, electrical panel, plumbing, and water heater last replaced?
- What does the HOA fee cover, when was the last increase, and are there any pending special assessments or reserve-fund shortfalls?
- Any open or pending special assessments — roof, HVAC, plumbing, elevator, façade? What's the per-unit balance and payoff schedule, and is the seller paying it off at close or rolling it to the buyer?
- Is there a deadline driving the sale (1031 exchange, divorce, estate, relocation)? That informs how much negotiation room exists.
- What's the average days-on-market for RENTAL listings here right now (not sales)? A rising rental-DOM trend means longer vacancies and softer asking-rent achievability than the comps imply.
- What's the recent tenant-quality profile in this submarket — average credit score on applications, eviction rate, late-payment / NSF rate, and stable-employment percentage? A property-management company in the area should have these aggregated.
- How much new apartment / multifamily construction is in the pipeline within 1–3 miles? Heavy new supply (>2% of stock underway) typically softens rents 12–24 months out; light construction supports rent growth.
Investment metrics
- 1% rule
- 1.43% ✓
- Cap rate
- 9.57%
- Cash-on-cash
- 11.72%
- DSCR
- 1.52
- GRM
- 5.8
CMA / ARV
- ARV (median comp)
- $166,597
- List price
- $164,999
- Delta
- -0.96%
- Verdict
- FAIR
- Comps
- 20 within 1.0 mi
Projected returns pro-forma
-3.0% appreciation · 1.49% rent growth · sell at horizon
- IRR
- -0.8%
- Equity multiple
- 0.97×
- Total profit
- $-1,336
- Equity at exit
- $24,602
- IRR
- 7.0%
- Equity multiple
- 1.49×
- Total profit
- $22,579
- Equity at exit
- $14,266
Cash invested: $46,200 (down + closing). Projections, not guarantees.
Landlord ↔ Tenant lean methodology
- Overall (STATE)
- 21 Tenant-Leaning
- State New Jersey
- 21 Tenant-Leaning · D+6
- County
- — inherits STATE
- City
- — inherits STATE
ZIP-level market 08753
- Rents YoY
- 1.5%
- Active inventory
- 435
- Price-to-rent
- 5.8×
Monthly cashflow live
- Estimated rent
- $2,366 high interval (Pro) →
- Mortgage (P&I)
- −$865
- Tax from tax record
- −$143 /mo · $1,716/yr
- Insurance
- −$69
- HOA
- −$341
- Vacancy / Maint / Mgmt
- −$497
- Net cashflow
- $451
Break-even live
Sensitivity live
| Price | -10% $545 | -5% $498 | +0% $451 | +5% $404 | +10% $358 |
|---|---|---|---|---|---|
| Rent | -10% $264 | -5% $358 | +0% $451 | +5% $545 | +10% $638 |
| Rate | -1.0pp $534 | -0.5pp $493 | base $451 | +0.5pp $408 | +1.0pp $365 |
UW: 25.0% down · 7.5% · 30yr · 1.5% tax · 5.0% vac · 8.0% maint · 8.0% mgmt
Financing live
Cash to close
- Down payment
- $41,250
- Closing costs
- $4,950
- Reserves months
- —
- Total cash needed
- —
Loan-product check · same deal, 3 products live
Conventional
25% down · 7.5% · 30yr
- Down + closing
- —
- Monthly P&I
- —
- Monthly cashflow
- —
- DSCR
- —
- Eligible?
- —
Personal DTI + credit; lowest rate.
DSCR
20% down · 8.5% · 30yr
- Down + closing
- —
- Monthly P&I
- —
- Monthly cashflow
- —
- DSCR
- —
- Eligible?
- —
No personal income docs; deal must DSCR.
Hard money
10% down · 12.0% · 12mo
- Down + closing
- —
- Monthly P&I
- —
- Monthly cashflow
- —
- DSCR
- —
- Eligible?
- —
Short-term bridge; refi at stabilization.
Rent comps 8 comps
| Address | Beds | Baths | Sqft | Rent | $/sqft | DOM | Units | Dist |
|---|---|---|---|---|---|---|---|---|
| 1255 New Jersey 166 Unit D9 Toms River, NJ | 1.0 | 1.0 | 940 | $2,199 | $2.34 | 45d | 1 | 0.45mi |
| 1255 New Jersey 166 Unit A4 Toms River, NJ | 1.0 | 2.0 | 990 | $2,045 | $2.07 | 45d | 1 | 0.45mi |
| 1255 NJ-166 Toms River, NJ | 1.0 | 1.0 | 940 | $1,994 | $2.12 | 45d | 1 | 0.47mi |
| 1255 NJ-166 Toms River, NJ | 1.0 | 1.0 | 940 | $2,199 | $2.34 | 26d | 1 | 0.47mi |
| 3600 Cypress Point Dr Toms River, NJ | 1.0–2.0 | 1.0–2.0 | 1170 | $2,964 | $2.53 | 0d | 17 | 0.69mi |
| 30 Green View Way Toms River, NJ | 1.0–3.0 | 2.0–3.0 | 1450 | $2,692 | $1.86 | 0d | 1 | 0.93mi |
| 83 Walnut St Toms River, NJ | 1.0–2.0 | 1.0 | 722 | $1,800 | $2.49 | 0d | 2 | 1.17mi |
| 802 Main St Toms River, NJ | 1.0–2.0 | 1.0 | 782 | $2,499 | $3.20 | 0d | 4 | 1.46mi |
HOA detail condo
- Monthly dues
- $341 · $4,092/yr
- Likely covers
- electric
- Assessments
- None detected in remarks — confirm with the listing agent.
Listing history 7 events
-
2026-06-04status $164,999 Pending 23 DOM
-
2026-06-03days on market $164,999 Active 23 DOM
-
2026-06-02days on market $164,999 Active 22 DOM
-
2026-06-01days on market $164,999 Active 21 DOM
-
2026-05-31days on market $164,999 Active 20 DOM
-
2026-05-11$164,999 Active 651-char remark
-
2026-05-10historical $164,999 651-char remark
ⓘ Source: listings_history table (triggers on properties + properties_extension) + one-shot
backfill from property_details.listing_events for pre-trigger history.
Tax reassessment forecast NJ · Partial reset (capped growth)
- Current annual tax
- $1,716 · $143/mo
- Projected year-2 tax
- $2,912 · $243/mo
- Expected delta
- +$1,196/yr (+$100/mo · 69.7%)
ⓘ Screening estimate from a state-policy table — verify with the county assessor before closing.
Climate risk First Street
- Flood 1/10 Low FEMA zone X (unshaded) · 0% chance over 30 yrs
- Wildfire 3/10 Moderate
- Heat 7/10 Severe 7 d/yr ≥100°F today · 15 d/yr by 30 yrs out
- Wind 6/10 Major 72% chance of damaging wind over 30 yrs
- Air quality 3/10 Moderate 3 unhealthy d/yr today · 4 by 30 yrs out
Nearby sold comps map
Loading sold comps map…
Walkable amenities ~0.75 mi
Loading nearby amenities…
Taxation est. · year 1
- Rental income
- $28,394
- − Mortgage interest
- −$9,243
- − Property taxes
- −$1,716
- − Insurance
- −$825
- − Repairs & maintenance
- −$2,271
- − Management
- −$2,271
- − HOA
- −$4,092
- − Depreciation
- −$4,800
- Taxable income
- $3,175
- Est. tax owed @ 24.0%
- −$762
- After-tax cash flow
- $4,652/yr
For passive investors: Depreciation is non-cash, so a rental often shows a tax loss while cash-flowing — sheltering income. Rental losses are passive: they offset passive income freely, and up to $25,000/yr can offset ordinary (W-2) income if you actively participate and your MAGI is under $100k (phasing out to $0 by $150k); unused losses carry forward. On sale, claimed depreciation is recaptured at up to 25%, and gains may owe capital-gains tax (a 1031 exchange can defer both). Figures are a year-1 estimate at your 24.0% rate — not tax advice; consult a CPA.
Condition & rehab AI · 6 photos
This well-maintained 2-bedroom condo is move-in ready with fresh updates and a good condition score. Potential buyers and renters will appreciate the clean, modern interior and well-maintained exterior.
Value-add opportunities
- Both Painting exterior and interior walls — Enhances curb appeal and interior aesthetics.
- Both Replace carpet with hardwood or tile flooring — Improves durability and adds value.
- Both Install smart home devices — Enhances convenience and adds modern appeal.
Renovation cost estimate screening
Value-add ROI direction
- Both Painting exterior and interior walls — Enhances curb appeal and interior aesthetics. ↑
- Both Replace carpet with hardwood or tile flooring — Improves durability and adds value. ↑
- Both Install smart home devices — Enhances convenience and adds modern appeal. ↑
ⓘ Cost ranges are severity-bucket heuristics (US national rule-of-thumb). Get contractor quotes + a written scope before underwriting a rehab budget.
Schools (NCES district)
- District
- Toms River Regional School District
- NCES district ID
- 3416230
- Math proficiency
- 18% ▼ -19.00%
- Reading proficiency
- 44% ▼ -10.00%
- Median HH income
- $72,370
- Composite
- 29.07/100
- National rank
- #6602
- State rank
- #316 of 472 in NJ
Livability — Toms River
- Score
- 81/100
- State rank
- #61
- US rank
- #1538
Category grades
Schools grade is shown separately in the Schools card above.
Census & demographics
- Census place
- Toms River, NJ
- County
- Ocean County · 439,426 people
- City population
- 131,205
- Metro
- New York-Newark-Jersey City, NY-NJ-PA
- Population (ZIP)
- 65,448
- Household income
- $105,224
- Rent vs Own
- Severe rent burden
- 828.0
Population outlook (Ocean County) Hauer SSP2
- Today (2025)
- 586,991 people
- By 2030
- 581,403 · -1.0%
- By 2040
- 564,913 · -3.8%
- By 2050
- 538,149 · -8.3%
- By 2075
- 468,845 · -20.1%
- By 2100
- 350,297 · -40.3%
Race, ethnicity, and origin ACS 2023
- Neighborhood character
- Predominantly White (77%)
- Race & ethnicity
- White 77% Hispanic / Latino 12% Two or more races 7% Asian 4% Black 3%
- Hispanic origin (detail)
- Mexican 3% Puerto Rican 4%
- Common ancestry
- Romanian 9% Lithuanian 1% Slovak 1%
- Foreign-born
- 10% · Canada, Guatemala, Jamaica
- Languages at home
- 87% English-only · Spanish 7% Other Indo-European 3% Tagalog/Filipino 1%
Political lean MEDSL · Ocean
- 2024 margin
- Solid R (+36.0) · D 31.4% · R 67.4% · Other 1.2%
- 2008→2024 swing
- -17.6pp toward R · 2008: -18.4pp · 2024: -36.0pp
- All cycles
- 2024: R+36.0 2020: R+28.7 2016: R+34.0 2012: R+17.7 2008: R+18.4
Not yet ingested
- Civics
- —
Market trends
- HPI YoY
- ▼ -527.36%
- Current HPI
- 374.5075
- Rent YoY
- ▲ 1.49%
- Metro
- New York-Newark-Jersey City, NY-NJ-PA
- State GDP YoY
- ▲ 2.05%
- F500 in state
- 34
Industry mix (Fortune 500 HQ in NJ)
| Industry | F500 HQs | Revenue |
|---|---|---|
| Consumer Goods | 3 | $31B |
|
||
| Pharmaceuticals | 2 | $153B |
|
||
| Technology | 2 | $21B |
|
||
| Insurance | 2 | $20B |
|
||
| Healthcare | 2 | $19B |
|
||
| Financial Services | 1 | $70B |
|
||
Price history
+0.0% since first listed3 events — show timeline
- 2026-06-03 Pending — MOMLS
- 2026-05-11 Listed $164,999 MOMLS
- 2026-05-10 Coming Soon $164,999 MOMLS
Property tax history
+10.0%/yrLatest (2025): $1,716 · +7.3% YoY. Source: county tax records.
Cash-flow waterfall
monthlySold comps — $/sqft
last 12 mo · ≤1 miLoading sold comps…