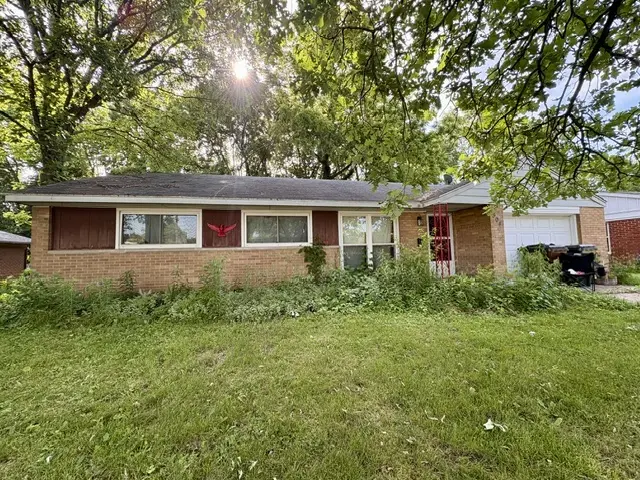
504 Kennison Ave · New Carlisle, OH
Flood risk 1/10 · Minimal
- FEMA flood zone
- X (unshaded)
- Chance of flooding over 30 yrs
- 0.0%
- Est. flood insurance / yr
- $507 – $1,088
Fire risk 1/10 · Minimal
- Est. fire insurance / yr
- $713 – $1,323
Heat risk 3/10 · Minor
- Hot days now (above 100°F)
- 7 days/yr
- Hot days in 30 yrs
- 18 days/yr
Wind risk 2/10 · Minimal
- Chance of severe wind over 30 yrs
- —
Air-quality risk 3/10 · Minor
- Unhealthy air days now
- 3 days/yr
- Unhealthy air days in 30 yrs
- 5 days/yr
Risk factors via First Street. Map © Google.
Why this score? — see what drove the B grade
The composite is a weighted blend of 9 inputs, each scored 0–100. Each bar is that input's sub-score; the figure is the points it added to the 100-point composite (weight × sub-score).
- Cash flow +28.0/30.0
- ARV discount +15.0/15.0
- DSCR +9.9/10.0
- 1% rule +8.5/10.0
- Schools +3.8/10.0
- Livability +3.2/5.0
- Rent growth +2.5/5.0
- Condition / age +2.5/5.0
- Appreciation +0.0/10.0
$99,900
🖨 Deal sheet 📄 Offer letter ✓ Due diligence
Listing remarks
This one is for the BIG DAWGS with a degree in FLIPOLOGY! Bring your vision and your best offer to this unheard-of deal in New Carlisle’s Westlake Subdivision. TOTAL RENOVATIONS WILL BE NEEDED but a solid After Repair Value of $215-220K rewards the cause. Repairs are estimated between $50-60K (depending on finishes) making this a true win for handy homeowners or rehab addicts looking for a perfect resale project. A popular layout offers nearly 1,300 sqft consisting of a formal living room, 3 bedrooms, 1.5 baths and a kitchen that’s merges seamlessly into the family room w/ brick wall fireplace and access to the large rear yard. Mechanicals are tucked privately off the laundry ro
Key facts
- Brick wall fireplace
- Attached garage
- Large rear yard
Tags
Property features AI
Finance
- Financial info: Property is for sale
Exterior
- Parking: Attached one-car garage
- Utilities: Natural gas available; Public water; Sewer available (storm sewer)
- Home design: Ranch-style single-story home
- Construction: Brick and frame construction; Slab foundation
- Exterior features: Fenced yard; Patio
Interior
- Kitchen: Kitchen (approx. 10x12)
- Bedrooms: Three bedrooms on the main level (approx. 10x10, 9x10, 12x10)
- Bathrooms: One full bathroom; One half bathroom (two main-level bathrooms total)
- Heating & cooling: Forced air heating (natural gas); Central air conditioning
- Interior features: Kitchen and family room combined; One fireplace
- Laundry & utility: Main-level laundry (approx. 11x6); Gas water heater
Neighborhood map
What this means for you Summary
Snapshot
- This is a 3-bed/1.5-bath single-family listed at $100k.
Deal economics
- At list price, monthly cash flow is $311 ($4k/yr) — positive.
- The deal already cash-flows at list — no discount required.
- Meets the 1% rule at list price ($1k rent vs $100k).
- Cap rate 10.0% vs local median 2.4% in New Carlisle — top-decile yield for the area; either an underpriced asset or a hidden risk that comps aren't pricing in. Stress-test before assuming the spread holds.
Location & tenants
- Location reads 63/100 on livability (#857 in OH) — a middle-class / working-renter tenant base. Strengths: cost of living A+, housing A+; Watch: schools D+, amenities F, commute F.
- Tecumseh Local (rural): math 41% / reading 48% proficiency, ranked #501 of 656 in OH (top 76%) — families likely to look elsewhere, expect single-tenant / working-renter base with shorter leases.
- Market conditions: 107 active listings in the ZIP; 1 comparable units currently listed for rent nearby; 232 units permitted in Clark County in 2024 (116 in 5+ unit buildings).
Forward outlook
- Local home prices are declining (-3.0%/yr); year-one equity from $691 of loan paydown is wiped out by about $3k of value loss. Plan a longer hold.
- Clark County population projected at -16% by 2050 — secular population decline; favor cash flow + early exit over multi-decade hold.
- At projected returns (-3.0% appreciation + 3.0% rent growth), your $28k cash investment doubles in ~9 years — after that, you're playing with house money.
Negotiation context
- Only 5 days on market — expect competitive offers; lowballing is unlikely to land.
- Current owner paid $84k; 19% above their basis — modest negotiation headroom, anchor on the comps not their cost.
Questions for the listing agent
- Built in 1960 — when were the roof, HVAC, electrical panel, plumbing, and water heater last replaced?
- Is there a deadline driving the sale (1031 exchange, divorce, estate, relocation)? That informs how much negotiation room exists.
- Schools are D-rated, which usually means shorter tenancies and higher turnover. Who's the typical renter profile here, and what's been the actual vacancy rate?
- What's the average days-on-market for RENTAL listings here right now (not sales)? A rising rental-DOM trend means longer vacancies and softer asking-rent achievability than the comps imply.
- What's the recent tenant-quality profile in this submarket — average credit score on applications, eviction rate, late-payment / NSF rate, and stable-employment percentage? A property-management company in the area should have these aggregated.
- How much new for-sale + rental construction is in the pipeline within 1–3 miles? Heavy new supply typically softens prices + rents 12–24 months out; constrained supply supports both.
Investment metrics
- 1% rule
- 1.35% ✓
- Cap rate
- 10.03%
- Cash-on-cash
- 13.36%
- DSCR
- 1.59
- GRM
- 6.2
CMA / ARV
- ARV (on-the-fly)
- $199,396
- Comps found
- 12
Show comp detail 12 sales within ~0.75 mi
| Address | Dist | Beds/Ba | Sqft | Sold | Price | $/sf | Match |
|---|---|---|---|---|---|---|---|
| 504 Kennison Ave | 0.00mi | 3/1.5 | 1,262 (0%) | 0mo | $117,000 | $93 | 100 |
| 503 Pease Dr | 0.14mi | 3/2.0 | 1,248 (-1%) | 1mo | $170,000 | $136 | 88 |
| 302 N Smith St | 0.19mi | 3/2.0 | 1,300 (+3%) | 7mo | $220,000 | $169 | 78 |
| 315 N Main St | 0.37mi | 4/1.0 (+1) | 1,263 (+0%) | 5mo | $195,000 | $154 | 72 |
| 1001 Langdale Ave | 0.37mi | 3/1.5 | 1,336 (+6%) | 4mo | $145,000 | $109 | 70 |
| 211 N Clay St | 0.32mi | 3/1.0 | 1,345 (+7%) | 5mo | $213,000 | $158 | 68 |
| 201 Lightfoot Ct | 0.54mi | 3/2.0 | 1,272 (+1%) | 5mo | $255,000 | $200 | 67 |
| 1113 Langdale Ave | 0.49mi | 3/1.5 | 1,201 (-5%) | 4mo | $216,200 | $180 | 66 |
| 303 Villa Dr | 0.22mi | 3/1.0 | 1,432 (+14%) | 1mo | $200,000 | $140 | 64 |
| 212 Lightfoot Ct | 0.57mi | 3/2.0 | 1,272 (+1%) | 8mo | $284,900 | $224 | 63 |
| 1300 Edgebrook Ave | 0.57mi | 3/2.0 | 1,380 (+9%) | 2mo | $234,900 | $170 | 54 |
| 215 N Smith St | 0.32mi | 2/2.0 (-1) | 1,414 (+12%) | 5mo | $224,000 | $158 | 54 |
Match score weights: distance 35% · size 25% · config 20% · recency 20%. Top-matched comps best support the ARV.
Projected returns pro-forma
-3.0% appreciation · 3.0% rent growth · sell at horizon
- IRR
- 3.4%
- Equity multiple
- 1.13×
- Total profit
- $3,707
- Equity at exit
- $14,895
- IRR
- 13.0%
- Equity multiple
- 2.04×
- Total profit
- $29,013
- Equity at exit
- $8,638
Cash invested: $27,972 (down + closing). Projections, not guarantees.
Landlord ↔ Tenant lean methodology
- Overall (STATE)
- 73 Landlord-Friendly
- State Ohio
- 73 Landlord-Friendly · R+6
- County
- — inherits STATE
- City
- — inherits STATE
ZIP-level market 45344
- Active inventory
- 107
- Price-to-rent
- 6.2×
Monthly cashflow live
- Estimated rent
- $1,350 medium interval (Pro) →
- Mortgage (P&I)
- −$524
- Tax from tax record
- −$190 /mo · $2,275/yr
- Insurance
- −$42
- HOA
- −$0
- Vacancy / Maint / Mgmt
- −$284
- Net cashflow
- $311
Break-even live
UW: 25.0% down · 7.5% · 30yr · 1.5% tax · 5.0% vac · 8.0% maint · 8.0% mgmt
Financing live
Cash to close
- Down payment
- $24,975
- Closing costs
- $2,997
- Reserves months
- —
- Total cash needed
- —
Loan-product check · same deal, 3 products live
Conventional
25% down · 7.5% · 30yr
- Down + closing
- —
- Monthly P&I
- —
- Monthly cashflow
- —
- DSCR
- —
- Eligible?
- —
Personal DTI + credit; lowest rate.
DSCR
20% down · 8.5% · 30yr
- Down + closing
- —
- Monthly P&I
- —
- Monthly cashflow
- —
- DSCR
- —
- Eligible?
- —
No personal income docs; deal must DSCR.
Hard money
10% down · 12.0% · 12mo
- Down + closing
- —
- Monthly P&I
- —
- Monthly cashflow
- —
- DSCR
- —
- Eligible?
- —
Short-term bridge; refi at stabilization.
Rent comps 1 comps
| Address | Beds | Baths | Sqft | Rent | $/sqft | DOM | Units | Dist |
|---|---|---|---|---|---|---|---|---|
| 1118 Cambridge Ct Unit 1118 New Carlisle, OH | 3.0 | 1.5 | 1450 | $1,350 | $0.93 | 14d | 1 | 0.56mi |
Listing history 6 events
-
2026-06-10status $99,900 Pending 5 DOM
-
2026-06-09days on market $99,900 Active 5 DOM
-
2026-06-08days on market $99,900 Active 4 DOM
-
2026-06-07pricedays on market $99,900 Active 3 DOM
-
2026-06-05remarks 687-char remark
-
2026-06-05$100 Active 1 DOM
ⓘ Source: listings_history table (triggers on properties + properties_extension) + one-shot
backfill from property_details.listing_events for pre-trigger history.
Tax reassessment forecast OH · Partial reset (capped growth)
- Current annual tax
- $2,275 · $190/mo
- Projected year-2 tax
- $2,275 · $190/mo
- Expected delta
- $0/yr ($0/mo · 0.0%)
ⓘ Screening estimate from a state-policy table — verify with the county assessor before closing.
Climate risk First Street
- Flood 1/10 Low FEMA zone X (unshaded) · 0% chance over 30 yrs
- Wildfire 1/10 Low
- Heat 3/10 Moderate 7 d/yr ≥100°F today · 18 d/yr by 30 yrs out
- Wind 2/10 Low
- Air quality 3/10 Moderate 3 unhealthy d/yr today · 5 by 30 yrs out
Nearby sold comps map
Loading sold comps map…
Walkable amenities ~0.75 mi
Loading nearby amenities…
Taxation est. · year 1
- Rental income
- $16,200
- − Mortgage interest
- −$5,596
- − Property taxes
- −$2,275
- − Insurance
- −$500
- − Repairs & maintenance
- −$1,296
- − Management
- −$1,296
- − Depreciation
- −$2,906
- Taxable income
- $2,332
- Est. tax owed @ 24.0%
- −$560
- After-tax cash flow
- $3,178/yr
For passive investors: Depreciation is non-cash, so a rental often shows a tax loss while cash-flowing — sheltering income. Rental losses are passive: they offset passive income freely, and up to $25,000/yr can offset ordinary (W-2) income if you actively participate and your MAGI is under $100k (phasing out to $0 by $150k); unused losses carry forward. On sale, claimed depreciation is recaptured at up to 25%, and gains may owe capital-gains tax (a 1031 exchange can defer both). Figures are a year-1 estimate at your 24.0% rate — not tax advice; consult a CPA.
Schools (NCES district)
- District
- Tecumseh Local
- NCES district ID
- 3904624
- Math proficiency
- 41% ▼ -12.00%
- Reading proficiency
- 48% ▼ -8.00%
- Median HH income
- $45,927
- Composite
- 37.81/100
- National rank
- #4336
- State rank
- #501 of 656 in OH
Livability — New Carlisle
- Score
- 63/100
- State rank
- #857
- US rank
- #16079
Category grades
Schools grade is shown separately in the Schools card above.
Census & demographics
- Census place
- New Carlisle, OH
- County
- Clark · 134,280 people
- City population
- 16,841
- Metro
- Springfield, OH
- Population (ZIP)
- 16,841
- Household income
- $71,627
- Rent vs Own
- Severe rent burden
- 15.0
Population outlook (Clark County) Hauer SSP2
- Today (2025)
- 130,703 people
- By 2030
- 126,952 · -2.9%
- By 2040
- 118,344 · -9.5%
- By 2050
- 109,590 · -16.2%
- By 2075
- 89,464 · -31.6%
- By 2100
- 68,810 · -47.4%
Race, ethnicity, and origin ACS 2023
- Neighborhood character
- Predominantly White (89%)
- Race & ethnicity
- White 89% Hispanic / Latino 8% Two or more races 5%
- Hispanic origin (detail)
- Mexican 6% Puerto Rican 2%
- Common ancestry
- Italian 4% Lithuanian 2% Slovak 2%
- Foreign-born
- 3% · Canada
- Languages at home
- 92% English-only · Spanish 7% Other Indo-European 1%
Political lean MEDSL · Clark
- 2024 margin
- Strong R (+29.5) · D 34.8% · R 64.3%
- 2008→2024 swing
- -27.0pp toward R · 2008: -2.5pp · 2024: -29.5pp
- All cycles
- 2024: R+29.5 2020: R+23.3 2016: R+19.5 2012: R+1.8 2008: R+2.5
Not yet ingested
- Civics
- —
Market trends
- HPI YoY
- ▼ -185.40%
- Current HPI
- 244.7603
- Rent YoY
- —
- Metro
- —
- State GDP YoY
- ▲ 1.98%
- F500 in state
- 48
Industry mix (Fortune 500 HQ in OH)
| Industry | F500 HQs | Revenue |
|---|---|---|
| Insurance | 3 | $145B |
|
||
| Industrial Machinery | 3 | $49B |
|
||
| Financial Services | 3 | $24B |
|
||
| Consumer Goods | 2 | $93B |
|
||
| Aerospace / Defense | 2 | $47B |
|
||
| Utilities | 2 | $33B |
|
||
Price history
2 events — show timeline
- 2026-06-04 Listed $100 Dayton MLS
- 2001-08-13 Sold (Public Records) $83,900 Public Records
Property tax history
+3.8%/yrLatest (2025): $2,275 · +17.9% YoY. Source: county tax records.
Cash-flow waterfall
monthlySold comps — $/sqft
last 12 mo · ≤1 miLoading sold comps…