194 Deer Chase Dr · Canon, GA
Flood risk No data
- FEMA flood zone
- —
- Chance of flooding over 30 yrs
- —
- Est. flood insurance / yr
- —
Fire risk No data
- Est. fire insurance / yr
- —
Heat risk No data
- Hot days now (above threshold)
- —
- Hot days in 30 yrs
- —
Wind risk No data
- Chance of severe wind over 30 yrs
- —
Air-quality risk No data
- Unhealthy air days now
- —
- Unhealthy air days in 30 yrs
- —
Risk factors via First Street. Map © Google.
Why this score? — see what drove the D grade
The composite is a weighted blend of 9 inputs, each scored 0–100. Each bar is that input's sub-score; the figure is the points it added to the 100-point composite (weight × sub-score).
- Appreciation +10.0/10.0
- Cash flow +8.6/30.0
- ARV discount +6.3/15.0
- Livability +3.3/5.0
- 1% rule +2.7/10.0
- Schools +2.7/10.0
- Rent growth +2.5/5.0
- Condition / age +2.5/5.0
- DSCR +2.4/10.0
$210,500
🖨 Deal sheet (PDF) 📄 Offer letter ✓ Due diligence
Listing remarks
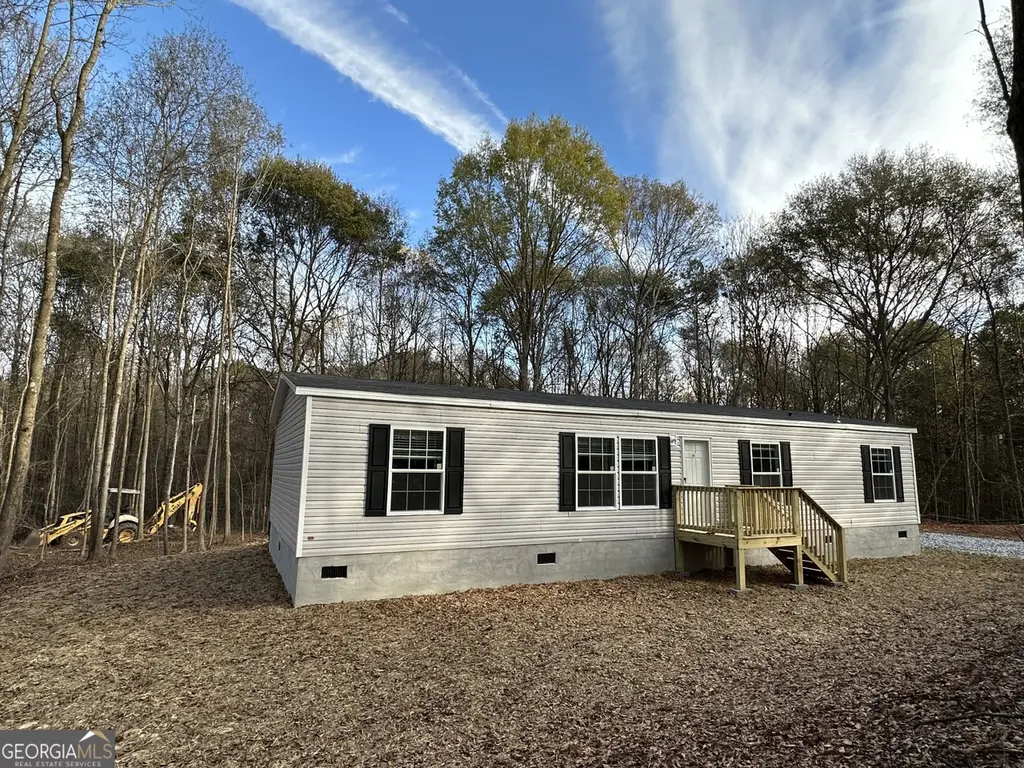
Nestled on a serene 1.16-acre lot in Canon, Georgia, Hart County, this 2024 Fleetwood mobile home is ready to welcome you! This thoughtfully designed four-bedroom, two-bathroom home boasts a spacious living, dining, and kitchen area, complemented by a split bedroom plan. Conveniently located off the kitchen at the back entrance is the laundry and "mud room. " A large back deck offers a picturesque view of the backyard. Surrounded by a beautiful wooded lot, this home provides ample space for an outbuilding. Built to FHA standards, it qualifies for FHA, USDA, VA, or conventional financing for eligible buyers. The title has been retired.
Key facts
- Large back deck
- Wooded lot
- Laundry and mud room
Tags
Property features AI
Finance
- Other: Lot size approximately 1.1 acres; Address: 194 Deer Chase Drive, Canon, GA 30520; Coordinates: -83.097841,34.350789
- Financial info: Listing sold As Is; Financing options: Cash, Conventional, FHA, VA, USDA
- HOA & community: No HOA
Exterior
- Parking: Parking pad; Open parking
- Utilities: Public water available; Septic tank; Electricity available
- Home design: Manufactured home / single-family manufactured house; One story; New construction (2024)
- Construction: Vinyl siding; Composition roof; Built in 2024
- Exterior features: Private lot; Other lot features; Underground utilities available
Interior
- Kitchen: Dishwasher; Kitchen island; Breakfast area; Pantry
- Bedrooms: Four bedrooms on the main level
- Flooring: Laminate flooring
- Bathrooms: Two full bathrooms on the main level
- Heating & cooling: Electric heating with heat pump; Central electric air conditioning
- Interior features: One-level living; Living area 1,344 (above grade); Resale condition; Dining room and living room combo; Breakfast area, kitchen island and pantry; No basement; Laundry room
- Laundry & utility: Laundry room; Electric water heater
Neighborhood map
What this means for you Summary
Snapshot
- This is a 4-bed/2.0-bath manufactured listed at $210k.
Deal economics
- At list price, monthly cash flow is $-182 ($-2k/yr) — negative.
- To cash-flow at today's rent, offer at most $184k (12.5% below list).
- To meet the 1% rule (rent ≥ 1% of price), the offer needs to be $161k (23.5% below list).
- Recommended offer: $161k (23.5% below list) — sets the bar for 1% rule.
Location & tenants
- Location reads 66/100 on livability (#189 in GA) — a middle-class / working-renter tenant base. Strengths: crime A+, cost of living A+, housing A+; Watch: amenities F, commute F, employment F.
- Hart County (town): math 32% / reading 33% proficiency, ranked #82 of 174 in GA (top 47%) — families likely to look elsewhere, expect single-tenant / working-renter base with shorter leases.
- Zoned schools: North Hart Elementary School (math 38% / reading 35%, grade F, #509 of 1,228 statewide, top 42%, 656 students, 57% FRL); Hart County Middle School (math 34% / reading 37%, grade F, #185 of 470 statewide, top 40%, 816 students, 60% FRL); Hart County High School (math 18% / reading 17%, grade F, #264 of 424 statewide, top 63%, 1,077 students, 49% FRL) — zoned schools at 55% FRL track the district average.
- Market conditions: 28 active listings in the ZIP; 170 units permitted in Hart County in 2024 (8 in 5+ unit buildings).
Forward outlook
- In year one you build about $23k of equity ($1k loan paydown + $21k appreciation (10.0% local appreciation)).
- Hart County population projected to shrink 4% by 2050 — rents likely to lag national; underwrite the cash flow, not the appreciation.
- By year 2, paydown + projected appreciation supports a ~$36k cash-out refi (75% LTV) — recoverable capital for the next deal without selling this one.
Negotiation context
- It's been on market 20 days — a 2% lower offer ($207k) is reasonable based on typical stale-listing flexibility.
- 4 sale attempts since 2y ago with the ask held roughly flat each time — persistent listings suggest the price (not the market) is what's stuck; bring a comps-based counter.
Questions for the listing agent
- What do current leases actually rent for vs. the listed asking? Can we see a recent rent roll and the last 12 months of T-12 income?
- Is there a deadline driving the sale (1031 exchange, divorce, estate, relocation)? That informs how much negotiation room exists.
- Schools are F-rated, which usually means shorter tenancies and higher turnover. Who's the typical renter profile here, and what's been the actual vacancy rate?
- The area grade is low — what's the realistic commute time and amenity access for the typical tenant pool here? Any planned neighborhood developments (good or bad) we should know about?
- What's the average days-on-market for RENTAL listings here right now (not sales)? A rising rental-DOM trend means longer vacancies and softer asking-rent achievability than the comps imply.
- What's the recent tenant-quality profile in this submarket — average credit score on applications, eviction rate, late-payment / NSF rate, and stable-employment percentage? A property-management company in the area should have these aggregated.
- How much new for-sale + rental construction is in the pipeline within 1–3 miles? Heavy new supply typically softens prices + rents 12–24 months out; constrained supply supports both.
Investment metrics
- 1% rule
- 0.77% ✗
- Cap rate
- 5.26%
- Cash-on-cash
- -3.70%
- DSCR
- 0.84
- GRM
- 10.9
CMA / ARV
- ARV (median comp)
- $205,000
- List price
- $210,500
- Delta
- 1.46%
- Verdict
- FAIR
- Comps
- 1 within 2.0 mi
Show comp detail 1 sale within ~0.75 mi
| Address | Dist | Beds/Ba | Sqft | Sold | Price | $/sf | Match |
|---|---|---|---|---|---|---|---|
| 566 Hoke Hill Rd | 0.12mi | 3/2.0 (-1) | 1,350 (+0%) | 3mo | $205,000 | $152 | 86 |
Match score weights: distance 35% · size 25% · config 20% · recency 20%. Top-matched comps best support the ARV.
Projected returns pro-forma
10.0% appreciation · 3.0% rent growth · sell at horizon
- IRR
- 21.7%
- Equity multiple
- 2.75×
- Total profit
- $103,093
- Equity at exit
- $189,635
- IRR
- 19.5%
- Equity multiple
- 6.31×
- Total profit
- $312,743
- Equity at exit
- $408,955
Cash invested: $58,940 (down + closing). Projections, not guarantees.
Landlord ↔ Tenant lean methodology
- Overall (STATE)
- 90 Strongly Landlord-Friendly
- State Georgia
- 90 Strongly Landlord-Friendly · R+3
- County
- — inherits STATE
- City
- — inherits STATE
ZIP-level market 30520
- Home prices YoY
- 9.0%
- Active inventory
- 28
- Price-to-rent
- 10.9×
Monthly cashflow live
- Estimated rent
- $1,611 medium interval (Pro) →
- Mortgage (P&I)
- −$1,104
- Tax est. 1.5%
- −$263 /mo · $3,158/yr
- Insurance
- −$88
- HOA
- −$0
- Vacancy / Maint / Mgmt
- −$338
- Net cashflow
- $-182
Break-even live
Sensitivity live
| Price | -10% $-36 | -5% $-109 | +0% $-182 | +5% $-254 | +10% $-327 |
|---|---|---|---|---|---|
| Rent | -10% $-309 | -5% $-245 | +0% $-182 | +5% $-118 | +10% $-54 |
| Rate | -1.0pp $-76 | -0.5pp $-128 | base $-182 | +0.5pp $-236 | +1.0pp $-292 |
UW: 25.0% down · 7.5% · 30yr · 1.5% tax · 5.0% vac · 8.0% maint · 8.0% mgmt
Financing live
Cash to close
- Down payment
- $52,625
- Closing costs
- $6,315
- Reserves months
- —
- Total cash needed
- —
Loan-product check · same deal, 3 products live
Conventional
25% down · 7.5% · 30yr
- Down + closing
- —
- Monthly P&I
- —
- Monthly cashflow
- —
- DSCR
- —
- Eligible?
- —
Personal DTI + credit; lowest rate.
DSCR
20% down · 8.5% · 30yr
- Down + closing
- —
- Monthly P&I
- —
- Monthly cashflow
- —
- DSCR
- —
- Eligible?
- —
No personal income docs; deal must DSCR.
Hard money
10% down · 12.0% · 12mo
- Down + closing
- —
- Monthly P&I
- —
- Monthly cashflow
- —
- DSCR
- —
- Eligible?
- —
Short-term bridge; refi at stabilization.
Listing history 23 events
-
2026-06-22days on market $210,500 Active 20 DOM
-
2026-06-19days on market $210,500 Active 18 DOM
-
2026-06-18days on market $210,500 Active 17 DOM
-
2026-06-17days on market $210,500 Active 16 DOM
-
2026-06-16days on market $210,500 Active 15 DOM
-
2026-06-15statusdays on market $210,500 Active 14 DOM
-
2026-06-14days on market $210,500 Price Change 12 DOM
-
2026-06-13pricestatusdays on market $210,500 Price Change 11 DOM
-
2026-06-10days on market $208,000 New 9 DOM
-
2026-06-09days on market $208,000 New 8 DOM
-
2026-06-08days on market $208,000 New 7 DOM
-
2026-06-07days on market $208,000 New 6 DOM
-
2026-06-02remarks 643-char remark
-
2026-06-02statusdays on market $208,000 New 1 DOM
-
2026-04-30price $208,000 586-char remark
-
2026-04-16historical
-
2026-04-15$209,000 New 586-char remark
-
2026-04-08price $215,000
-
2026-02-25$220,000 New
-
2024-04-04soldstatus $198,000 Sold
-
2024-04-04soldstatus $198,000
-
2024-03-06status Under Contract
-
2024-01-11$195,000 New
ⓘ Source: listings_history table (triggers on properties + properties_extension) + one-shot
backfill from property_details.listing_events for pre-trigger history.
Nearby sold comps map
Loading sold comps map…
Walkable amenities ~0.75 mi
Loading nearby amenities…
Taxation est. · year 1
- Rental income
- $19,336
- − Mortgage interest
- −$11,791
- − Property taxes
- −$3,158
- − Insurance
- −$1,052
- − Repairs & maintenance
- −$1,547
- − Management
- −$1,547
- − Depreciation
- −$6,124
- Taxable loss
- −$5,882
- Est. tax savings @ 24.0%
- +$1,412
- After-tax cash flow
- $-769/yr
For passive investors: Depreciation is non-cash, so a rental often shows a tax loss while cash-flowing — sheltering income. Rental losses are passive: they offset passive income freely, and up to $25,000/yr can offset ordinary (W-2) income if you actively participate and your MAGI is under $100k (phasing out to $0 by $150k); unused losses carry forward. On sale, claimed depreciation is recaptured at up to 25%, and gains may owe capital-gains tax (a 1031 exchange can defer both). Figures are a year-1 estimate at your 24.0% rate — not tax advice; consult a CPA.
Schools (NCES district)
- District
- Hart County
- NCES district ID
- 1302730
- Math proficiency
- 32% ▼ -6.00%
- Reading proficiency
- 33% ▼ -6.00%
- Median HH income
- $37,494
- Composite
- 27.08/100
- National rank
- #7047
- State rank
- #82 of 174 in GA
Livability — Canon
- Score
- 66/100
- State rank
- #189
- US rank
- #11742
Category grades
Schools grade is shown separately in the Schools card above.
Census & demographics
- Census place
- Canon, GA
- Population (ZIP)
- 4,617
Population outlook (Hart County) Hauer SSP2
- Today (2025)
- 25,855 people
- By 2030
- 25,887 · +0.1%
- By 2040
- 25,627 · -0.9%
- By 2050
- 24,939 · -3.5%
- By 2075
- 23,150 · -10.5%
- By 2100
- 19,492 · -24.6%
Race, ethnicity, and origin ACS 2023
- Neighborhood character
- Predominantly White (85%)
- Race & ethnicity
- White 85% Hispanic / Latino 12% Two or more races 4%
- Hispanic origin (detail)
- Mexican 10%
- Common ancestry
- Slovak 3% Hungarian 1% Portuguese 1%
- Foreign-born
- 3% · Canada
- Languages at home
- 92% English-only · Spanish 8%
Political lean MEDSL · Hart
- 2024 margin
- Solid R (+54.8) · D 22.4% · R 77.2%
- 2008→2024 swing
- -23.1pp toward R · 2008: -31.7pp · 2024: -54.8pp
- All cycles
- 2024: R+54.8 2020: R+49.6 2016: R+46.7 2012: R+38.4 2008: R+31.7
Not yet ingested
- Civics
- —
Market trends
- HPI YoY
- ▲ 29.72%
- Current HPI
- 361.1507
- Rent YoY
- —
- Metro
- —
- State GDP YoY
- ▲ 2.66%
- F500 in state
- 28
Industry mix (Fortune 500 HQ in GA)
| Industry | F500 HQs | Revenue |
|---|---|---|
| Paper / Packaging | 2 | $29B |
|
||
| Retail | 1 | $160B |
|
||
| Transportation / Logistics | 1 | $91B |
|
||
| Airlines | 1 | $62B |
|
||
| Consumer Goods | 1 | $47B |
|
||
| Utilities | 1 | $25B |
|
||
Price history
+7.9% since first listed12 events — show timeline
- 2026-06-11 Price Changed $210,500 GAMLS
- 2026-06-01 Listed $208,000 GAMLS
- 2026-05-29 Listing Removed — GAMLS
- 2026-04-30 Price Changed $208,000 GAMLS
- 2026-04-16 Listing Removed — GAMLS
- 2026-04-15 Listed $209,000 GAMLS
- 2026-04-08 Price Changed $215,000 GAMLS
- 2026-02-25 Listed $220,000 GAMLS
- 2024-04-04 Sold (Public Records) $198,000 Public Records
- 2024-04-04 Sold (MLS) $198,000 GAMLS
- 2024-03-06 Pending — GAMLS
- 2024-01-11 Listed $195,000 GAMLS
Property tax history
+0.6%/yrLatest (2025): $409 · +0.6% YoY. Source: county tax records.
Cash-flow waterfall
monthlySold comps — $/sqft
last 12 mo · ≤1 miLoading sold comps…