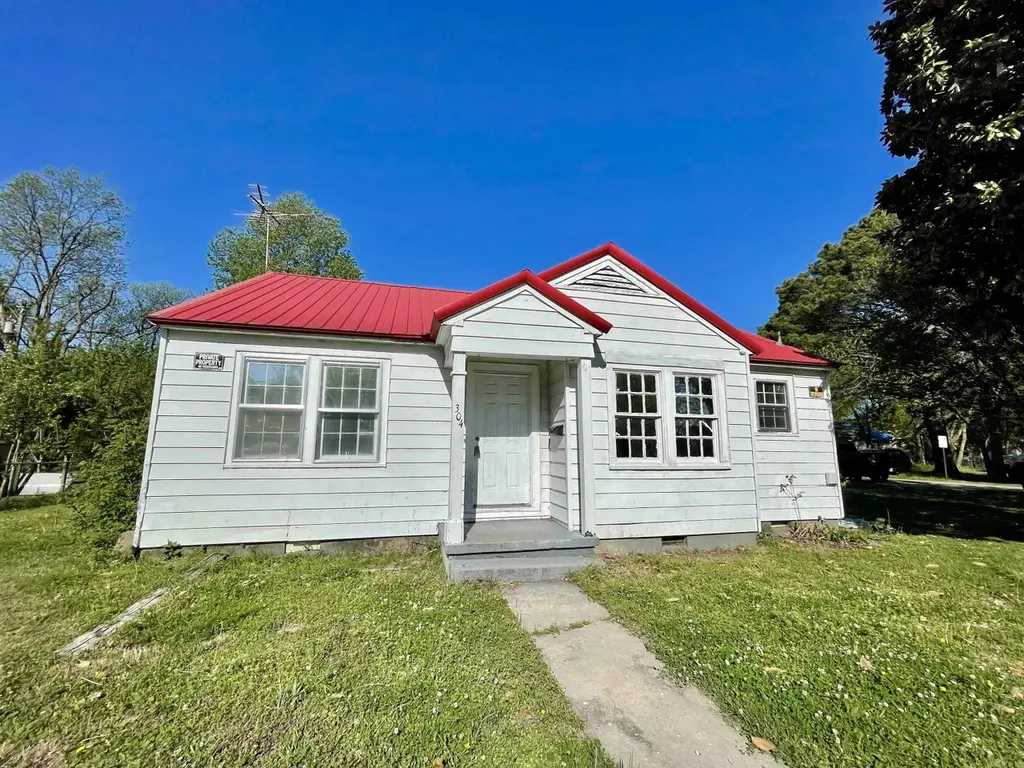
304 Plaza Ave · Trumann, AR
Flood risk 1/10 · Minimal
- FEMA flood zone
- X (unshaded)
- Chance of flooding over 30 yrs
- 0.0%
- Est. flood insurance / yr
- $507 – $1,088
Fire risk 1/10 · Minimal
- Est. fire insurance / yr
- $1,499 – $2,785
Heat risk 6/10 · Moderate
- Hot days now (above 110°F)
- 7 days/yr
- Hot days in 30 yrs
- 21 days/yr
Wind risk 4/10 · Minor
- Chance of severe wind over 30 yrs
- 9.0%
Air-quality risk 1/10 · Minimal
- Unhealthy air days now
- 0 days/yr
- Unhealthy air days in 30 yrs
- 0 days/yr
Risk factors via First Street. Map © Google.
Why this score? — see what drove the B- grade
The composite is a weighted blend of 9 inputs, each scored 0–100. Each bar is that input's sub-score; the figure is the points it added to the 100-point composite (weight × sub-score).
- Cash flow +30.0/30.0
- 1% rule +10.0/10.0
- DSCR +10.0/10.0
- ARV discount +7.5/15.0
- Livability +2.9/5.0
- Rent growth +2.5/5.0
- Condition / age +2.5/5.0
- Schools +2.2/10.0
- Appreciation +1.7/10.0
$37,900
🖨 Deal sheet 📄 Offer letter ✓ Due diligence
Listing remarks MLS
Don't miss this investment opportunity in 304 Plaza Ave. Trumann, AR 72472. This 2 bedroom, 1 bath home has original hardwood floors, metal siding, and a metal roof keeping maintenance at a minimum. There is a window air unit and a spot for a gas heater to be installed. Situated on a nice corner lot with parking available. Call your favorite REALTOR® with questions and to take a look.
Key facts
- Metal roof
- Metal siding
- Parking available
Tags
Property features AI
Finance
- Other: Approximate lot dimensions 84 x 45 (about 0.09 acre); Located in Trumann, Poinsett County; subdivision Harrison & Douglas; Annual taxes listed (details not included per instructions)
- Financial info: Accepts cash and in-house financing
- HOA & community: Details not provided
Exterior
- Parking: Other parking (see remarks)
- Security: Details not provided
- Utilities: Public sewer; Public water; Electricity with municipal service (Entergy); Natural gas
- Home design: Single-family property (details not provided); Inside city limits
- Construction: Metal and vinyl siding, and wood exterior; Metal roof; Crawl space foundation; Built area approximately 966 (source: tax records)
- Exterior features: Level corner lot; Paved road access
Interior
- Kitchen: Details not provided
- Bedrooms: Details not provided
- Flooring: Wood flooring; Vinyl flooring
- Bathrooms: 1 full bathroom
- Heating & cooling: Window air conditioning units; No central heating; Other heating (see remarks)
- Interior features: Electric water heater
- Laundry & utility: Details not provided
Neighborhood map
What this means for you Summary
Snapshot
- This is a 2-bed/1.0-bath single-family listed at $38k.
Deal economics
- At list price, monthly cash flow is $279 ($3k/yr) — positive.
- The deal already cash-flows at list — no discount required.
- Meets the 1% rule at list price ($650 rent vs $38k).
- Recommended offer: $37k (3.0% below list) — sets the bar for market timing.
- Cap rate 15.1% vs local median 4.4% in Trumann — top-decile yield for the area; either an underpriced asset or a hidden risk that comps aren't pricing in. Stress-test before assuming the spread holds.
Location & tenants
- Location reads 57/100 on livability (#353 in AR) — a working-class tenant base; expect higher turnover. Strengths: cost of living A+, housing A+; Watch: employment D, crime F, amenities F.
- Trumann School District (town): math 28% / reading 26% proficiency, ranked #178 of 238 in AR (top 75%) — low school quality limits family demand, transient renter base, plan for 1-2y turnover; 67% free/reduced lunch — lower-income household profile, screen leases tightly.
- Zoned schools: Trumann Prek And Parent Center (94 students, 97% FRL); Trumann High School (math 24% / reading 32%, grade F, #159 of 292 statewide, top 55%, 457 students, 100% FRL) — zoned schools average 98% FRL vs 67% district-wide (31 pts higher); higher-poverty schools than district average — tighter screening recommended.
- Market conditions: 73 active listings in the ZIP; 1 comparable units currently listed for rent nearby; 67 units permitted in Poinsett County in 2024 (5 in 5+ unit buildings).
Forward outlook
- Local home prices are declining (-3.0%/yr); year-one equity from $262 of loan paydown is wiped out by about $1k of value loss. Plan a longer hold.
- Poinsett County population projected at -13% by 2050 — secular population decline; favor cash flow + early exit over multi-decade hold.
- At projected returns (-3.0% appreciation + 3.0% rent growth), your $11k cash investment doubles in ~4 years — after that, you're playing with house money.
Negotiation context
- It's been on market 54 days — a 3% lower offer ($37k) is reasonable based on typical stale-listing flexibility.
- 3 sale attempts since 23y ago with the ask held roughly flat each time — persistent listings suggest the price (not the market) is what's stuck; bring a comps-based counter.
- Current owner paid $11k; list at $38k implies a 261% gain — meaningful room to come down on a strong offer.
Risks & watch-outs
- Watch-outs: built in 1940 — expect roof / HVAC / electrical / plumbing capex.
- Climate carrying-cost: extreme-heat days projected 7→21/yr by 2055 (HVAC capex compounding) — expect insurance premiums to compound above CPI over the hold.
Questions for the listing agent
- It's been on market 54 days. Have you received any prior offers? Is the seller open to a 3% concession, seller financing, or rate buy-down credit?
- Built in 1940 — when were the roof, HVAC, electrical panel, plumbing, and water heater last replaced?
- Is there a deadline driving the sale (1031 exchange, divorce, estate, relocation)? That informs how much negotiation room exists.
- Schools are D-rated, which usually means shorter tenancies and higher turnover. Who's the typical renter profile here, and what's been the actual vacancy rate?
- Crime grade is F in this area — have there been break-ins, vandalism, or insurance claims at this property in the last 3 years? What carrier currently insures it and at what premium?
- What's the average days-on-market for RENTAL listings here right now (not sales)? A rising rental-DOM trend means longer vacancies and softer asking-rent achievability than the comps imply.
- What's the recent tenant-quality profile in this submarket — average credit score on applications, eviction rate, late-payment / NSF rate, and stable-employment percentage? A property-management company in the area should have these aggregated.
- How much new for-sale + rental construction is in the pipeline within 1–3 miles? Heavy new supply typically softens prices + rents 12–24 months out; constrained supply supports both.
Investment metrics
- 1% rule
- 1.72% ✓
- Cap rate
- 15.13%
- Cash-on-cash
- 31.56%
- DSCR
- 2.40
- GRM
- 4.9
CMA / ARV
- ARV (on-the-fly)
- $113,022
- Comps found
- 12
Show comp detail 12 sales within ~0.75 mi
| Address | Dist | Beds/Ba | Sqft | Sold | Price | $/sf | Match |
|---|---|---|---|---|---|---|---|
| 117 Jennifer St | 0.36mi | 3/1.0 (+1) | 968 (+0%) | 1mo | $120,000 | $124 | 77 |
| 313 Olive St | 0.20mi | 2/1.0 | 1,016 (+5%) | 7mo | $65,000 | $64 | 77 |
| 305 W Carlson | 0.18mi | 2/1.0 | 864 (-11%) | 1mo | $103,500 | $120 | 73 |
| 329 Sharon Dr | 0.43mi | 2/1.0 | 900 (-7%) | 3mo | $105,000 | $117 | 66 |
| 504 Locust | 0.27mi | 3/1.0 (+1) | 1,100 (+14%) | 4mo | $68,000 | $62 | 56 |
| 120 S Parkview Dr | 0.45mi | 3/1.0 (+1) | 1,040 (+8%) | 6mo | $133,000 | $128 | 56 |
| 304 Norma Jean Dr | 0.56mi | 3/1.0 (+1) | 1,050 (+9%) | 1mo | $37,500 | $36 | 53 |
| 145 S Parkview Dr | 0.38mi | 3/1.0 (+1) | 1,096 (+14%) | 3mo | $164,900 | $150 | 52 |
| 404 Patterson St | 0.69mi | 3/1.0 (+1) | 1,000 (+4%) | 8mo | $113,500 | $114 | 50 |
| 338 Paula Ave | 0.73mi | 2/1.0 | 1,026 (+6%) | 7mo | $79,000 | $77 | 50 |
| 220 Magnolia | 0.48mi | 3/1.0 (+1) | 864 (-11%) | 8mo | $95,000 | $110 | 49 |
| 304 Smith Ave | 0.55mi | 3/2.0 (+1) | 1,060 (+10%) | 10mo | $160,000 | $151 | 41 |
Match score weights: distance 35% · size 25% · config 20% · recency 20%. Top-matched comps best support the ARV.
Projected returns pro-forma
-3.0% appreciation · 3.0% rent growth · sell at horizon
- IRR
- 26.4%
- Equity multiple
- 2.10×
- Total profit
- $11,629
- Equity at exit
- $5,651
- IRR
- 34.1%
- Equity multiple
- 4.11×
- Total profit
- $32,989
- Equity at exit
- $3,277
Cash invested: $10,612 (down + closing). Projections, not guarantees.
Landlord ↔ Tenant lean methodology
- Overall (STATE)
- 92 Strongly Landlord-Friendly
- State Arkansas
- 92 Strongly Landlord-Friendly · R+14
- County
- — inherits STATE
- City
- — inherits STATE
ZIP-level market 72472
- Home prices YoY
- -3.1%
- Active inventory
- 73
- Price-to-rent
- 4.9×
Monthly cashflow live
- Estimated rent
- $650 medium interval (Pro) →
- Mortgage (P&I)
- −$199
- Tax from tax record
- −$20 /mo · $238/yr
- Insurance
- −$16
- HOA
- −$0
- Vacancy / Maint / Mgmt
- −$136
- Net cashflow
- $279
Break-even live
UW: 25.0% down · 7.5% · 30yr · 1.5% tax · 5.0% vac · 8.0% maint · 8.0% mgmt
Financing live
Cash to close
- Down payment
- $9,475
- Closing costs
- $1,137
- Reserves months
- —
- Total cash needed
- —
Loan-product check · same deal, 3 products live
Conventional
25% down · 7.5% · 30yr
- Down + closing
- —
- Monthly P&I
- —
- Monthly cashflow
- —
- DSCR
- —
- Eligible?
- —
Personal DTI + credit; lowest rate.
DSCR
20% down · 8.5% · 30yr
- Down + closing
- —
- Monthly P&I
- —
- Monthly cashflow
- —
- DSCR
- —
- Eligible?
- —
No personal income docs; deal must DSCR.
Hard money
10% down · 12.0% · 12mo
- Down + closing
- —
- Monthly P&I
- —
- Monthly cashflow
- —
- DSCR
- —
- Eligible?
- —
Short-term bridge; refi at stabilization.
Rent comps 1 comps
| Address | Beds | Baths | Sqft | Rent | $/sqft | DOM | Units | Dist |
|---|---|---|---|---|---|---|---|---|
| 228 Ambrea Dr Trumann, AR | 1.0 | 1.0 | 574 | $650 | $1.13 | 43d | 1 | 0.47mi |
Listing history 10 events
-
2026-06-05statusdays on market $37,900 Under Contract 54 DOM
-
2026-06-02days on market $37,900 Active 53 DOM
-
2026-06-01days on market $37,900 Active 52 DOM
-
2026-05-31days on market $37,900 Active 51 DOM
-
2026-05-30days on market $37,900 Active 50 DOM
-
2026-04-10$37,900 Active 391-char remark
Show marketing remark (391 chars)
Don't miss this investment opportunity in 304 Plaza Ave. Trumann, AR 72472. This 2 bedroom, 1 bath home has original hardwood floors, metal siding, and a metal roof keeping maintenance at a minimum. There is a window air unit and a spot for a gas heater to be installed. Situated on a nice corner lot with parking available. Call your favorite REALTOR® with questions and to take a look.
-
2026-04-09$37,900 New Listing
-
2003-06-02soldstatus $10,510 129-char remark
Show marketing remark (129 chars)
HUD property - case #031-244485; insurable w/ escrow $3960 - SYSTEMS INSPECTION REQUIRED; eligible for 203k financing; sold AS-IS
-
2003-04-10$10,000 129-char remark
Show marketing remark (129 chars)
HUD property - case #031-244485; insurable w/ escrow $3960 - SYSTEMS INSPECTION REQUIRED; eligible for 203k financing; sold AS-IS
-
2002-04-17soldstatus $33,942
ⓘ Source: listings_history table (triggers on properties + properties_extension) + one-shot
backfill from property_details.listing_events for pre-trigger history.
Tax reassessment forecast AR · Resets to sale price
- Current annual tax
- $238 · $20/mo
- Projected year-2 tax
- $243 · $20/mo
- Expected delta
- +$5/yr ($0/mo · 1.9%)
ⓘ Screening estimate from a state-policy table — verify with the county assessor before closing.
Climate risk First Street
- Flood 1/10 Low FEMA zone X (unshaded) · 0% chance over 30 yrs
- Wildfire 1/10 Low
- Heat 6/10 Major 7 d/yr ≥110°F today · 21 d/yr by 30 yrs out
- Wind 4/10 Moderate 9% chance of damaging wind over 30 yrs
- Air quality 1/10 Low 0 unhealthy d/yr today · 0 by 30 yrs out
Nearby sold comps map
Loading sold comps map…
Walkable amenities ~0.75 mi
Loading nearby amenities…
Taxation est. · year 1
- Rental income
- $7,800
- − Mortgage interest
- −$2,123
- − Property taxes
- −$238
- − Insurance
- −$190
- − Repairs & maintenance
- −$624
- − Management
- −$624
- − Depreciation
- −$1,103
- Taxable income
- $2,899
- Est. tax owed @ 24.0%
- −$696
- After-tax cash flow
- $2,654/yr
For passive investors: Depreciation is non-cash, so a rental often shows a tax loss while cash-flowing — sheltering income. Rental losses are passive: they offset passive income freely, and up to $25,000/yr can offset ordinary (W-2) income if you actively participate and your MAGI is under $100k (phasing out to $0 by $150k); unused losses carry forward. On sale, claimed depreciation is recaptured at up to 25%, and gains may owe capital-gains tax (a 1031 exchange can defer both). Figures are a year-1 estimate at your 24.0% rate — not tax advice; consult a CPA.
Schools (NCES district)
- District
- Trumann School District
- NCES district ID
- 0500047
- Math proficiency
- 28% ▼ -10.00%
- Reading proficiency
- 26% ▼ -7.00%
- Median HH income
- $35,307
- Composite
- 22.33/100
- National rank
- #8130
- State rank
- #178 of 238 in AR
Livability — Trumann
- Score
- 57/100
- State rank
- #353
- US rank
- #21973
Category grades
Schools grade is shown separately in the Schools card above.
Census & demographics
- Census place
- Trumann, AR
- Population (ZIP)
- 8,868
Population outlook (Poinsett County) Hauer SSP2
- Today (2025)
- 22,998 people
- By 2030
- 22,356 · -2.8%
- By 2040
- 21,150 · -8.0%
- By 2050
- 20,035 · -12.9%
- By 2075
- 17,745 · -22.8%
- By 2100
- 15,358 · -33.2%
Race, ethnicity, and origin ACS 2023
- Neighborhood character
- Predominantly White (85%)
- Race & ethnicity
- White 85% Two or more races 7% Black 7% Hispanic / Latino 3%
- Common ancestry
- Italian 1% Greek 1% Lithuanian 1%
- Foreign-born
- 1% · Canada
- Languages at home
- 98% English-only · Spanish 2%
Political lean MEDSL · Poinsett
- 2024 margin
- Solid R (+63.5) · D 17.4% · R 81.0% · Other 1.6%
- 2008→2024 swing
- -36.3pp toward R · 2008: -27.2pp · 2024: -63.5pp
- All cycles
- 2024: R+63.5 2020: R+59.8 2016: R+24.1 2012: R+34.2 2008: R+27.2
Not yet ingested
- Civics
- —
Market trends
- HPI YoY
- ▼ -6.69%
- Current HPI
- 208.64
- Rent YoY
- —
- Metro
- —
- State GDP YoY
- ▲ 3.80%
- F500 in state
- 10
Industry mix (Fortune 500 HQ in AR)
| Industry | F500 HQs | Revenue |
|---|---|---|
| Retail | 1 | $681B |
|
||
| Food / Agriculture | 1 | $53B |
|
||
| Retail / Energy | 1 | $22B |
|
||
| Transportation / Logistics | 1 | $12B |
|
||
| Energy | 1 | $4B |
|
||
Price history
+11.7% since first listed5 events — show timeline
- 2026-04-10 Listed $37,900 NEABOR MLS
- 2026-04-09 Listed $37,900 CARMLS
- 2003-06-02 Sold (MLS) $10,510 Memphis Area Association of Realtors(R) MLS
- 2003-04-10 Listed $10,000 Memphis Area Association of Realtors(R) MLS
- 2002-04-17 Sold (Public Records) $33,942 Public Records
Property tax history
+1.5%/yrLatest (2025): $238 · +0.0% YoY. Source: county tax records.
Cash-flow waterfall
monthlySold comps — $/sqft
last 12 mo · ≤1 miLoading sold comps…