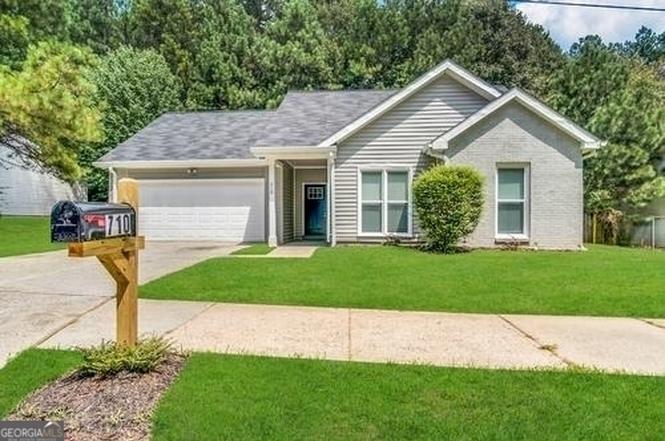
710 Thomasville Blvd SE · Atlanta, GA
Flood risk 1/10 · Minimal
- FEMA flood zone
- X (unshaded)
- Chance of flooding over 30 yrs
- 0.0%
- Est. flood insurance / yr
- $507 – $1,088
Fire risk 2/10 · Minimal
- Est. fire insurance / yr
- $963 – $1,789
Heat risk 5/10 · Moderate
- Hot days now (above 105°F)
- 6 days/yr
- Hot days in 30 yrs
- 16 days/yr
Wind risk 5/10 · Moderate
- Chance of severe wind over 30 yrs
- 26.0%
Air-quality risk 4/10 · Minor
- Unhealthy air days now
- 4 days/yr
- Unhealthy air days in 30 yrs
- 6 days/yr
Risk factors via First Street. Map © Google.
Why this score? — see what drove the F grade
The composite is a weighted blend of 9 inputs, each scored 0–100. Each bar is that input's sub-score; the figure is the points it added to the 100-point composite (weight × sub-score).
- Cash flow +13.5/30.0
- Livability +4.2/5.0
- DSCR +4.1/10.0
- 1% rule +4.0/10.0
- Rent growth +3.3/5.0
- Schools +2.7/10.0
- Condition / age +2.5/5.0
- ARV discount +0.0/15.0
- Appreciation +0.0/10.0
$219,000
🖨 Deal sheet (PDF) 📄 Offer letter ✓ Due diligence
Listing remarks
* * 100% FINANCING AVAILABLE ON THIS HOME FOR QUALIFIED BUYERS * * A beautifully renovated 3-bedroom, 2-bathroom ranch home. This home features stylish updates including stainless steel kitchen appliances, granite countertops, and updated flooring throughout. Conveniently located near shopping, dining, and more! Do not miss this opportunity! Contact SouthState Bank (Amy Buynoski NMLS#545254) at amy. [email protected] for more information on 100% financing options. Advertised product assumes the purchase of a single-family primary residence, 600 minimum FICO, down payment of 0%, and loan amount up to the conforming loan amount limit. Buyer is free to shop financing offers from a
Key facts
- Large level lot
- Updated flooring
- Granite countertops
Tags
Neighborhood map
What this means for you Summary
Snapshot
- This is a 3-bed/2.0-bath single-family listed at $219k.
Deal economics
- At list price, monthly cash flow is $6 ($78/yr) — positive.
- The deal already cash-flows at list — no discount required.
- To meet the 1% rule (rent ≥ 1% of price), the offer needs to be $198k (9.7% below list).
- Recommended offer: $193k (12.0% below list) — sets the bar for market timing.
- Cap rate 6.3% vs local median 3.1% in Atlanta — top-decile yield for the area; either an underpriced asset or a hidden risk that comps aren't pricing in. Stress-test before assuming the spread holds.
Location & tenants
- Location reads 83/100 on livability (#6 in GA, #919 nationally) — a professional / high-income tenant draw. Strengths: amenities A+, commute A+, housing A+; Watch: cost of living C-.
- Atlanta Public Schools (urban): math 28% / reading 35% proficiency, ranked #80 of 174 in GA (top 46%) — families likely to look elsewhere, expect single-tenant / working-renter base with shorter leases; 71% free/reduced lunch — lower-income household profile, screen leases tightly.
- Zoned schools: John Wesley Dobbs Elementary School (math 2% / reading 2%, grade F, #1,204 of 1,228 statewide, top 100%, 354 students, 100% FRL); Crawford Long Middle School (math 2% / reading 8%, grade F, #462 of 470 statewide, top 99%, 705 students, 100% FRL); South Atlanta High School (math 2% / reading 12%, grade F, #385 of 424 statewide, top 92%, 928 students, 100% FRL) — zoned schools average 100% FRL vs 71% district-wide (29 pts higher); higher-poverty schools than district average — tighter screening recommended.
- Zoned-school proficiency averages 5% at this address vs 32% district-wide (-27 pts) — the specific schools serving this property underperform the Atlanta Public Schools average; the district grade overstates school quality for this exact location.
- Market conditions: Rents rising (+3.2%/yr); 391 active listings in the ZIP; 40 comparable units currently listed for rent nearby; rentals at typical pace (median 19d on market — plan ~3-4 weeks tenant-placement turnaround); 11,565 units permitted in Fulton County in 2024 (8,159 in 5+ unit buildings).
- At $1,978/mo this rent would consume 47% of the median local household income ($51k/yr) (locally 2962% of renters already pay >50% of income on rent) — very limited rent-growth headroom before tenants either downsize or default.
Forward outlook
- Local home prices are declining (-3.0%/yr); year-one equity from $2k of loan paydown is wiped out by about $7k of value loss. Plan a longer hold.
- Fulton County population projected at +38% by 2050 — long-run rental-demand tailwind backs the buy-and-hold thesis.
Negotiation context
- It's been on market 392 days — a 12% lower offer ($193k) is reasonable based on typical stale-listing flexibility.
- 5 sale attempts since 20y ago; this cycle's ask has dropped $32k (13%) from the opening price — seller is motivated, your offer sets the floor, not the list.
- Current owner paid $106k; list at $219k implies a 108% gain — meaningful room to come down on a strong offer.
Risks & watch-outs
- Climate carrying-cost: moderate wind risk, 26% chance of damaging wind over 30y; extreme-heat days projected 6→16/yr by 2055 (HVAC capex compounding) — expect insurance premiums to compound above CPI over the hold.
Questions for the listing agent
- It's been on market 392 days. Have you received any prior offers? Is the seller open to a 12% concession, seller financing, or rate buy-down credit?
- Why hasn't it sold? Are there any deal-killer items the seller is aware of (foundation, flood, title, zoning, code violations)?
- Is there a deadline driving the sale (1031 exchange, divorce, estate, relocation)? That informs how much negotiation room exists.
- The area grade is low — what's the realistic commute time and amenity access for the typical tenant pool here? Any planned neighborhood developments (good or bad) we should know about?
- What's the average days-on-market for RENTAL listings here right now (not sales)? A rising rental-DOM trend means longer vacancies and softer asking-rent achievability than the comps imply.
- What's the recent tenant-quality profile in this submarket — average credit score on applications, eviction rate, late-payment / NSF rate, and stable-employment percentage? A property-management company in the area should have these aggregated.
- How much new for-sale + rental construction is in the pipeline within 1–3 miles? Heavy new supply typically softens prices + rents 12–24 months out; constrained supply supports both.
Investment metrics
- 1% rule
- 0.90% ✗
- Cap rate
- 6.33%
- Cash-on-cash
- 0.13%
- DSCR
- 1.01
- GRM
- 9.2
CMA / ARV
- ARV (on-the-fly)
- $187,532
- Comps found
- 12
Show comp detail 12 sales within ~0.75 mi
| Address | Dist | Beds/Ba | Sqft | Sold | Price | $/sf | Match |
|---|---|---|---|---|---|---|---|
| 710 Thomasville Blvd SE | 0.00mi | 3/2.0 | 1,084 (0%) | 0mo | $213,000 | $196 | 100 |
| 1154 Penn Ct | 0.32mi | 3/1.0 | 1,000 (-8%) | 1mo | $188,300 | $188 | 68 |
| 1918 Velma St SE | 0.58mi | 3/1.0 | 1,120 (+3%) | 0mo | $133,000 | $119 | 63 |
| 1991 Turner Rd SE | 0.63mi | 3/2.0 | 1,036 (-4%) | 6mo | $198,000 | $191 | 58 |
| 1050 Moreland Dr SE | 0.74mi | 2/2.0 (-1) | 1,120 (+3%) | 1mo | $249,000 | $222 | 54 |
| 1886 Akron Dr SE | 0.67mi | 3/2.0 | 1,033 (-5%) | 11mo | $238,000 | $230 | 52 |
| 1044 Moreland Dr SE | 0.73mi | 2/1.0 (-1) | 1,080 (-0%) | 6mo | $115,000 | $106 | 51 |
| 1895 Thomasville Dr SE | 0.46mi | 3/1.0 | 983 (-9%) | 9mo | $98,000 | $100 | 51 |
| 366 Wyndham Way SE | 0.74mi | 3/1.0 | 1,147 (+6%) | 2mo | $187,000 | $163 | 50 |
| 2040 Forrest Park Rd SE | 0.53mi | 3/1.0 | 984 (-9%) | 9mo | $170,000 | $173 | 48 |
| 1899 Lathrop St SE | 0.40mi | 4/2.0 (+1) | 1,236 (+14%) | 7mo | $189,000 | $153 | 47 |
| 1120 Oak Knoll Ter | 0.67mi | 3/1.0 | 1,206 (+11%) | 1mo | $50,000 | $41 | 45 |
Match score weights: distance 35% · size 25% · config 20% · recency 20%. Top-matched comps best support the ARV.
Projected returns pro-forma
-3.0% appreciation · 3.23% rent growth · sell at horizon
- IRR
- -15.8%
- Equity multiple
- 0.44×
- Total profit
- $-34,559
- Equity at exit
- $32,654
- IRR
- -6.9%
- Equity multiple
- 0.55×
- Total profit
- $-27,443
- Equity at exit
- $18,935
Cash invested: $61,320 (down + closing). Projections, not guarantees.
Landlord ↔ Tenant lean methodology
- Overall (STATE)
- 90 Strongly Landlord-Friendly
- State Georgia
- 90 Strongly Landlord-Friendly · R+3
- County
- — inherits STATE
- City
- — inherits STATE
ZIP-level market 30315
- Rents YoY
- 3.2%
- Active inventory
- 391
- Price-to-rent
- 9.2×
Monthly cashflow live
- Estimated rent
- $1,978 high interval (Pro) →
- Mortgage (P&I)
- −$1,148
- Tax from tax record
- −$316 /mo · $3,793/yr
- Insurance
- −$91
- HOA
- −$0
- Vacancy / Maint / Mgmt
- −$415
- Net cashflow
- $6
Break-even live
Sensitivity live
| Price | -10% $130 | -5% $68 | +0% $6 | +5% $-55 | +10% $-117 |
|---|---|---|---|---|---|
| Rent | -10% $-150 | -5% $-72 | +0% $6 | +5% $85 | +10% $163 |
| Rate | -1.0pp $117 | -0.5pp $62 | base $6 | +0.5pp $-50 | +1.0pp $-108 |
UW: 25.0% down · 7.5% · 30yr · 1.5% tax · 5.0% vac · 8.0% maint · 8.0% mgmt
Financing live
Cash to close
- Down payment
- $54,750
- Closing costs
- $6,570
- Reserves months
- —
- Total cash needed
- —
Loan-product check · same deal, 3 products live
Conventional
25% down · 7.5% · 30yr
- Down + closing
- —
- Monthly P&I
- —
- Monthly cashflow
- —
- DSCR
- —
- Eligible?
- —
Personal DTI + credit; lowest rate.
DSCR
20% down · 8.5% · 30yr
- Down + closing
- —
- Monthly P&I
- —
- Monthly cashflow
- —
- DSCR
- —
- Eligible?
- —
No personal income docs; deal must DSCR.
Hard money
10% down · 12.0% · 12mo
- Down + closing
- —
- Monthly P&I
- —
- Monthly cashflow
- —
- DSCR
- —
- Eligible?
- —
Short-term bridge; refi at stabilization.
Rent comps 40 comps
| Address | Beds | Baths | Sqft | Rent | $/sqft | DOM | Units | Dist |
|---|---|---|---|---|---|---|---|---|
| 752 McDonough Blvd SE Atlanta, GA | 3.0 | 2.0 | 1120 | $1,895 | $1.69 | 26d | 1 | 0.51mi |
| 752 McDonough Blvd SE Atlanta, GA | 3.0 | 2.0 | 1120 | $1,895 | $1.69 | 1d | 1 | 0.51mi |
| 972 Welch St SE Atlanta, GA | 3.0 | 2.0 | 1100 | $900 | $0.82 | 7d | 1 | 0.54mi |
| 976 McKay Dr SE Atlanta, GA | 3.0 | 1.0 | 1200 | $1,695 | $1.41 | 5d | 1 | 0.55mi |
| 1770 Richmond Cir SE Unit 1000E Atlanta, GA | 2.0 | 2.0 | 1200 | $1,365 | $1.14 | 26d | 1 | 0.55mi |
| 1770 Richmond Cir SE Unit 500F Atlanta, GA | 2.0 | 2.0 | 1200 | $1,750 | $1.46 | 26d | 1 | 0.55mi |
| 1979 Turner Rd SE Atlanta, GA | 3.0 | 1.0 | 808 | $1,595 | $1.97 | 13d | 1 | 0.62mi |
| 1979 Turner Rd SE Atlanta, GA | 3.0 | 1.0 | 808 | $1,595 | $1.97 | 1d | 1 | 0.62mi |
| 1940 Fisher Rd SE Atlanta, GA | 2.0 | 1.0 | 760 | $1,300 | $1.71 | 26d | 1 | 0.63mi |
| 1754 Richmond Cir SE Atlanta, GA | 2.0 | 2.0 | 1200 | $1,750 | $1.46 | 9d | 2 | 0.63mi |
| 2087 Lakewood Trl SE Atlanta, GA | 3.0 | 2.5 | 1056 | $2,256 | $2.14 | 26d | 1 | 0.71mi |
| 340 Adelle St SE Atlanta, GA | 3.0 | 1.0 | 1122 | $1,500 | $1.34 | 5d | 1 | 0.76mi |
| 672 Cassanova St SE Unit B Atlanta, GA | 2.0 | 1.5 | 1245 | $2,300 | $1.85 | 20d | 1 | 0.84mi |
| 386 Lindsey Dr SE Atlanta, GA | 3.0 | 1.0 | 1040 | $1,793 | $1.72 | 1d | 1 | 0.91mi |
| 402 McDonough Blvd SE Atlanta, GA | 3.0 | 3.5 | 1270 | $2,350 | $1.85 | 26d | 1 | 0.95mi |
| 1496 Woodland Ave SE Atlanta, GA | 3.0 | 3.5 | 1144 | $2,600 | $2.27 | 4d | 1 | 0.96mi |
| 1875 Conrad Ave SE Atlanta, GA | 3.0 | 2.0 | 1088 | $1,768 | $1.62 | 1d | 1 | 0.98mi |
| 1394 Cozy Cir SE Atlanta, GA | 3.0 | 3.0 | 1500 | $2,850 | $1.90 | 16d | 1 | 1.01mi |
| 172 Meador Way SE Atlanta, GA | 3.0 | 2.0 | 1100 | $1,950 | $1.77 | 26d | 1 | 1.08mi |
| 585 McWilliams Rd SE #104 Atlanta, GA | 2.0 | 3.0 | 1500 | $2,078 | $1.39 | 22d | 1 | 1.10mi |
| 76 Schell Rd SE Atlanta, GA | 3.0 | 1.0 | 1080 | $1,623 | $1.50 | 26d | 1 | 1.11mi |
| 1267 Zucchini Cir SE Atlanta, GA | 3.0 | 3.0 | 1500 | $3,800 | $2.53 | 26d | 1 | 1.13mi |
| 1267 Zucchini Cir SE Atlanta, GA | 3.0 | 3.0 | 1500 | $3,300 | $2.20 | 9d | 1 | 1.13mi |
| 1339 Miller Reed Ave SE Atlanta, GA | 2.0 | 1.0 | 1389 | $1,995 | $1.44 | 0d | 1 | 1.14mi |
| 1316 Moreland Ave SE Atlanta, GA | 2.0 | 2.0 | 866 | $2,026 | $2.34 | 45d | 1 | 1.14mi |
| 871 Hargis St SE Atlanta, GA | 2.0 | 2.0 | 1040 | $1,800 | $1.73 | 26d | 1 | 1.18mi |
| 1296 Moreland Ave SE Atlanta, GA | 1.0–2.0 | 1.0–2.0 | 1000 | $2,135 | $2.13 | 1d | 22 | 1.20mi |
| 1515 Jonesboro Rd SE Atlanta, GA | 3.0 | 2.0 | 1360 | $2,300 | $1.69 | 14d | 1 | 1.20mi |
| 1144 Regis Rd SE Atlanta, GA | 3.0 | 1.0 | 1430 | $1,725 | $1.21 | 26d | 1 | 1.22mi |
| 52 Claire Dr SE Atlanta, GA | 2.0 | 2.0 | 800 | $1,750 | $2.19 | 20d | 1 | 1.24mi |
| 1037 Rebel Forest Dr SE Atlanta, GA | 3.0 | 2.0 | 1075 | $1,750 | $1.63 | 26d | 1 | 1.25mi |
| 41 Meldon Ave SE Atlanta, GA | 4.0 | 1.5 | 1323 | $1,495 | $1.13 | 19d | 1 | 1.25mi |
| 1317 Redford Dr SE Atlanta, GA | 3.0 | 2.0 | 1137 | $2,100 | $1.85 | 26d | 1 | 1.28mi |
| 1455 Jonesboro Rd SE Atlanta, GA | 2.0 | 1.0 | 700 | $2,000 | $2.86 | 26d | 1 | 1.30mi |
| 95 Thirkield Ave SE Atlanta, GA | 3.0 | 2.0 | 1096 | $1,850 | $1.69 | 18d | 1 | 1.36mi |
| 95 Thirkield Ave SE Atlanta, GA | 3.0 | 2.0 | 1096 | $1,850 | $1.69 | 1d | 1 | 1.36mi |
| 117 Thayer Ave SE Atlanta, GA | 3.0 | 1.0 | 1241 | $1,666 | $1.34 | 16d | 1 | 1.37mi |
| 91 Thirkield Ave SE Atlanta, GA | 2.0 | 1.0 | 1092 | $1,995 | $1.83 | 26d | 1 | 1.37mi |
| 430 Englewood Ave SE Atlanta, GA | 3.0 | 1.0–2.0 | 938 | $3,605 | $3.84 | 3d | 28 | 1.41mi |
| 305 Banberry Dr SE Atlanta, GA | 3.0 | 1.0 | 1000 | $1,550 | $1.55 | 1d | 1 | 1.42mi |
Listing history 16 events
-
2026-04-28status Under Contract
-
2026-04-10price $219,000
-
2025-07-22price $233,000
-
2025-04-01$251,000 New
-
2023-09-11historical $1,675
-
2023-09-06$1,675
-
2020-01-16soldstatus $105,500
-
2019-06-28historical
-
2018-12-28$145,000 New
-
2014-07-09historical
-
2014-04-17$62,000 New
-
2007-08-27soldstatus $73,500
-
2006-12-28$84,900
-
2005-07-07soldstatus $145,000
-
1999-08-26soldstatus $43,500
-
1995-06-23soldstatus $57,500
ⓘ Source: listings_history table (triggers on properties + properties_extension) + one-shot
backfill from property_details.listing_events for pre-trigger history.
Tax reassessment forecast GA · Resets to sale price
- Current annual tax
- $3,793 · $316/mo
- Projected year-2 tax
- $3,793 · $316/mo
- Expected delta
- $0/yr ($0/mo · -0.0%)
ⓘ Screening estimate from a state-policy table — verify with the county assessor before closing.
Climate risk First Street
- Flood 1/10 Low FEMA zone X (unshaded) · 0% chance over 30 yrs
- Wildfire 2/10 Low
- Heat 5/10 Major 6 d/yr ≥105°F today · 16 d/yr by 30 yrs out
- Wind 5/10 Major 26% chance of damaging wind over 30 yrs
- Air quality 4/10 Moderate 4 unhealthy d/yr today · 6 by 30 yrs out
Nearby sold comps map
Loading sold comps map…
Walkable amenities ~0.75 mi
Loading nearby amenities…
Taxation est. · year 1
- Rental income
- $23,731
- − Mortgage interest
- −$12,267
- − Property taxes
- −$3,793
- − Insurance
- −$1,095
- − Repairs & maintenance
- −$1,898
- − Management
- −$1,898
- − Depreciation
- −$6,371
- Taxable loss
- −$3,592
- Est. tax savings @ 24.0%
- +$862
- After-tax cash flow
- $940/yr
For passive investors: Depreciation is non-cash, so a rental often shows a tax loss while cash-flowing — sheltering income. Rental losses are passive: they offset passive income freely, and up to $25,000/yr can offset ordinary (W-2) income if you actively participate and your MAGI is under $100k (phasing out to $0 by $150k); unused losses carry forward. On sale, claimed depreciation is recaptured at up to 25%, and gains may owe capital-gains tax (a 1031 exchange can defer both). Figures are a year-1 estimate at your 24.0% rate — not tax advice; consult a CPA.
Schools (NCES district)
- District
- Atlanta Public Schools
- NCES district ID
- 1300120
- Math proficiency
- 28% ▼ -6.00%
- Reading proficiency
- 35% ▼ -2.00%
- Median HH income
- $48,306
- Composite
- 27.27/100
- National rank
- #7006
- State rank
- #80 of 174 in GA
Livability — Atlanta
- Score
- 83/100
- State rank
- #6
- US rank
- #919
Category grades
Schools grade is shown separately in the Schools card above.
Census & demographics
- Census place
- Atlanta, GA
- County
- Fulton County · 1,094,430 people
- City population
- 629,525
- Metro
- Atlanta-Sandy Springs-Alpharetta, GA
- Population (ZIP)
- 34,264
- Household income
- $50,822
- Rent vs Own
- Severe rent burden
- 2962.0
Population outlook (Fulton County) Hauer SSP2
- Today (2025)
- 1,203,707 people
- By 2030
- 1,299,706 · +8.0%
- By 2040
- 1,488,256 · +23.6%
- By 2050
- 1,664,580 · +38.3%
- By 2075
- 2,036,072 · +69.2%
- By 2100
- 2,222,402 · +84.6%
Race, ethnicity, and origin ACS 2023
- Neighborhood character
- Predominantly Black (72%)
- Race & ethnicity
- Black 72% White 14% Hispanic / Latino 10% Two or more races 4%
- Hispanic origin (detail)
- Mexican 4%
- Common ancestry
- Romanian 1% Italian 1% Lithuanian 1%
- Foreign-born
- 5% · Canada
- Languages at home
- 90% English-only · Spanish 9% French/Haitian/Cajun 1%
Political lean MEDSL · Fulton
- 2024 margin
- Solid D (+44.9) · D 71.9% · R 27.0% · Other 1.1%
- 2008→2024 swing
- +9.8pp toward D · 2008: 35.0pp · 2024: 44.9pp
- All cycles
- 2024: D+44.9 2020: D+46.4 2016: D+42.1 2012: D+29.6 2008: D+35.0
Not yet ingested
- Civics
- —
Market trends
- HPI YoY
- ▼ -281.87%
- Current HPI
- 176.673
- Rent YoY
- ▲ 3.23%
- Metro
- Atlanta-Sandy Springs-Alpharetta, GA
- State GDP YoY
- ▲ 2.66%
- F500 in state
- 28
Industry mix (Fortune 500 HQ in GA)
| Industry | F500 HQs | Revenue |
|---|---|---|
| Paper / Packaging | 2 | $29B |
|
||
| Retail | 1 | $160B |
|
||
| Transportation / Logistics | 1 | $91B |
|
||
| Airlines | 1 | $62B |
|
||
| Consumer Goods | 1 | $47B |
|
||
| Utilities | 1 | $25B |
|
||
Price history
+280.9% since first listed16 events — show timeline
- 2026-04-28 Pending — GAMLS
- 2026-04-10 Price Changed $219,000 GAMLS
- 2025-07-22 Price Changed $233,000 GAMLS
- 2025-04-01 Listed $251,000 GAMLS
- 2023-09-11 Rental Removed $1,675 FMLS
- 2023-09-06 Listed for Rent $1,675 FMLS
- 2020-01-16 Sold (Public Records) $105,500 Public Records
- 2019-06-28 Listing Removed — GAMLS
- 2018-12-28 Listed $145,000 GAMLS
- 2014-07-09 Listing Removed — GAMLS
- 2014-04-17 Listed $62,000 GAMLS
- 2007-08-27 Sold (MLS) $73,500 FMLS
- 2006-12-28 Listed $84,900 FMLS
- 2005-07-07 Sold (Public Records) $145,000 Public Records
- 1999-08-26 Sold (Public Records) $43,500 Public Records
- 1995-06-23 Sold (Public Records) $57,500 Public Records
Property tax history
+4.6%/yrLatest (2025): $3,793 · -0.1% YoY. Source: county tax records.
Cash-flow waterfall
monthlySold comps — $/sqft
last 12 mo · ≤1 miLoading sold comps…