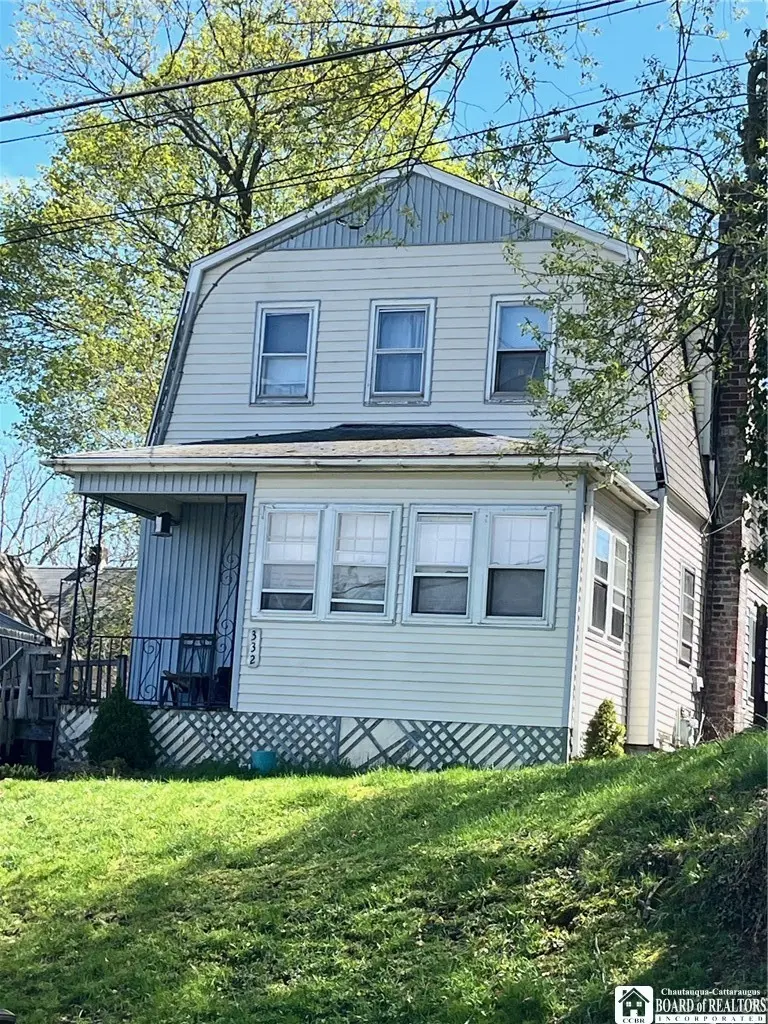
332 N 6th St · Olean, NY
Flood risk 1/10 · Minimal
- FEMA flood zone
- X
- Chance of flooding over 30 yrs
- 0.0%
- Est. flood insurance / yr
- $473 – $860
Fire risk 3/10 · Minor
- Est. fire insurance / yr
- $691 – $1,283
Heat risk 2/10 · Minimal
- Hot days now (above 90°F)
- 8 days/yr
- Hot days in 30 yrs
- 18 days/yr
Wind risk 1/10 · Minimal
- Chance of severe wind over 30 yrs
- —
Air-quality risk 1/10 · Minimal
- Unhealthy air days now
- 0 days/yr
- Unhealthy air days in 30 yrs
- 0 days/yr
Risk factors via First Street. Map © Google.
Why this score? — see what drove the C grade
The composite is a weighted blend of 9 inputs, each scored 0–100. Each bar is that input's sub-score; the figure is the points it added to the 100-point composite (weight × sub-score).
- Cash flow +24.9/30.0
- DSCR +8.1/10.0
- ARV discount +7.4/15.0
- 1% rule +6.2/10.0
- Livability +3.6/5.0
- Schools +3.5/10.0
- Rent growth +2.5/5.0
- Condition / age +2.5/5.0
- Appreciation +0.0/10.0
$120,000
🖨 Deal sheet 📄 Offer letter ✓ Due diligence
Listing remarks MLS
Come take a look at this spacious home with natural woodwork and large living areas. There are built ins throughout the home. There is a small deck on the front and a private backyard. This home is close to shopping and restaurants! Call today to set up your appointment!
Key facts
- New furnace
- Off street parking
- New hot water tank
Tags
Property features AI
Exterior
- Parking: Detached garage; 2 garage spaces
- Utilities: Public water connected; Sewer connected
- Home design: 2-story existing home; Block foundation; Vinyl siding; Blown-in insulation
- Construction: Built (existing); Vinyl siding; Blown-in insulation; Block foundation
- Exterior features: Concrete driveway; City street frontage; Rectangular residential lot (40 x 128)
Interior
- Kitchen: Gas cooktop; Refrigerator
- Bedrooms: Total rooms: 9; Laundry room
- Flooring: Carpet; Hardwood; Vinyl; Varies
- Bathrooms: 2 full bathrooms; 1 main-level bathroom
- Heating & cooling: Gas forced-air heating
- Interior features: Separate formal dining room; Full basement
- Laundry & utility: Main-level laundry
Neighborhood map
What this means for you Summary
Snapshot
- This is a 3-bed/1.0-bath single-family listed at $120k.
Deal economics
- At list price, monthly cash flow is $257 ($3k/yr) — positive.
- The deal already cash-flows at list — no discount required.
- Meets the 1% rule at list price ($1k rent vs $120k).
- Recommended offer: $116k (3.0% below list) — sets the bar for market timing.
Location & tenants
- Location reads 72/100 on livability (#353 in NY) — a middle-class / working-renter tenant base. Strengths: cost of living A+, housing A+, health & safety A+; Watch: crime F, amenities F, commute F.
- Olean City School District (town): math 40% / reading 43% proficiency, ranked #511 of 590 in NY (top 87%) — families likely to look elsewhere, expect single-tenant / working-renter base with shorter leases.
- Market conditions: 141 active listings in the ZIP; 128 units permitted in Cattaraugus County in 2024 (21 in 5+ unit buildings).
Forward outlook
- Local home prices are declining (-3.0%/yr); year-one equity from $830 of loan paydown is wiped out by about $4k of value loss. Plan a longer hold.
- Cattaraugus County population projected at -28% by 2050 — secular population decline; favor cash flow + early exit over multi-decade hold.
Negotiation context
- It's been on market 41 days — a 3% lower offer ($116k) is reasonable based on typical stale-listing flexibility.
- 2 sale attempts since 7y ago with the ask held roughly flat each time — persistent listings suggest the price (not the market) is what's stuck; bring a comps-based counter.
- Current owner paid $33k; list at $120k implies a 264% gain — meaningful room to come down on a strong offer.
Risks & watch-outs
- Watch-outs: built in 1900 — expect roof / HVAC / electrical / plumbing capex.
Questions for the listing agent
- It's been on market 41 days. Have you received any prior offers? Is the seller open to a 3% concession, seller financing, or rate buy-down credit?
- Built in 1900 — when were the roof, HVAC, electrical panel, plumbing, and water heater last replaced?
- Is there a deadline driving the sale (1031 exchange, divorce, estate, relocation)? That informs how much negotiation room exists.
- Schools are B-rated — typically a magnet for longer-tenancy family renters. What's the average tenant stay here, and is there a school-zone premium baked into asking?
- Crime grade is F in this area — have there been break-ins, vandalism, or insurance claims at this property in the last 3 years? What carrier currently insures it and at what premium?
- What's the average days-on-market for RENTAL listings here right now (not sales)? A rising rental-DOM trend means longer vacancies and softer asking-rent achievability than the comps imply.
- What's the recent tenant-quality profile in this submarket — average credit score on applications, eviction rate, late-payment / NSF rate, and stable-employment percentage? A property-management company in the area should have these aggregated.
- How much new for-sale + rental construction is in the pipeline within 1–3 miles? Heavy new supply typically softens prices + rents 12–24 months out; constrained supply supports both.
Investment metrics
- 1% rule
- 1.12% ✓
- Cap rate
- 8.86%
- Cash-on-cash
- 9.18%
- DSCR
- 1.41
- GRM
- 7.4
CMA / ARV
- ARV (median comp)
- $119,642
- List price
- $120,000
- Delta
- 0.30%
- Verdict
- FAIR
- Comps
- 20 within 1.0 mi
Show comp detail 12 sales within ~0.75 mi
| Address | Dist | Beds/Ba | Sqft | Sold | Price | $/sf | Match |
|---|---|---|---|---|---|---|---|
| 1117 W Sullivan St | 0.33mi | 3/1.5 | 1,400 (+4%) | 6mo | $53,500 | $38 | 70 |
| 334 N 13th St | 0.43mi | 2/1.0 (-1) | 1,392 (+4%) | 5mo | $74,500 | $54 | 65 |
| 123 S 4th St | 0.48mi | 2/1.0 (-1) | 1,300 (-3%) | 4mo | $90,000 | $69 | 64 |
| 130 S 6th St | 0.48mi | 3/2.0 | 1,320 (-2%) | 10mo | $150,000 | $114 | 62 |
| 309 S 3rd St | 0.64mi | 3/1.0 | 1,270 (-6%) | 5mo | $10,000 | $8 | 57 |
| 708 Irving St | 0.58mi | 3/1.5 | 1,232 (-8%) | 5mo | $25,000 | $20 | 53 |
| 216 N 14th St | 0.51mi | 3/1.5 | 1,516 (+13%) | 3mo | $143,000 | $94 | 51 |
| 133 N 13th St | 0.52mi | 3/2.0 | 1,496 (+11%) | 6mo | $149,900 | $100 | 48 |
| 112 S 7th St | 0.43mi | 2/1.5 (-1) | 1,516 (+13%) | 5mo | $150,000 | $99 | 47 |
| 1014 N Union St | 0.66mi | 2/1.0 (-1) | 1,224 (-9%) | 3mo | $30,000 | $25 | 47 |
| 119 W Green St | 0.74mi | 2/1.0 (-1) | 1,278 (-5%) | 9mo | $85,000 | $67 | 45 |
| 1705 W State St | 0.74mi | 3/1.0 | 1,156 (-14%) | 2mo | $37,500 | $32 | 41 |
Match score weights: distance 35% · size 25% · config 20% · recency 20%. Top-matched comps best support the ARV.
Projected returns pro-forma
-3.0% appreciation · 3.0% rent growth · sell at horizon
- IRR
- -2.4%
- Equity multiple
- 0.91×
- Total profit
- $-3,060
- Equity at exit
- $17,892
- IRR
- 7.3%
- Equity multiple
- 1.55×
- Total profit
- $18,453
- Equity at exit
- $10,375
Cash invested: $33,600 (down + closing). Projections, not guarantees.
Landlord ↔ Tenant lean methodology
- Overall (STATE)
- 15 Strongly Tenant-Friendly
- State New York
- 15 Strongly Tenant-Friendly · D+10
- County
- — inherits STATE
- City
- — inherits STATE
ZIP-level market 14760
- Home prices YoY
- -7.7%
- Active inventory
- 141
- Price-to-rent
- 7.4×
Monthly cashflow live
- Estimated rent
- $1,348 medium interval (Pro) →
- Mortgage (P&I)
- −$629
- Tax from tax record
- −$129 /mo · $1,542/yr
- Insurance
- −$50
- HOA
- −$0
- Vacancy / Maint / Mgmt
- −$283
- Net cashflow
- $257
Break-even live
UW: 25.0% down · 7.5% · 30yr · 1.5% tax · 5.0% vac · 8.0% maint · 8.0% mgmt
Financing live
Cash to close
- Down payment
- $30,000
- Closing costs
- $3,600
- Reserves months
- —
- Total cash needed
- —
Loan-product check · same deal, 3 products live
Conventional
25% down · 7.5% · 30yr
- Down + closing
- —
- Monthly P&I
- —
- Monthly cashflow
- —
- DSCR
- —
- Eligible?
- —
Personal DTI + credit; lowest rate.
DSCR
20% down · 8.5% · 30yr
- Down + closing
- —
- Monthly P&I
- —
- Monthly cashflow
- —
- DSCR
- —
- Eligible?
- —
No personal income docs; deal must DSCR.
Hard money
10% down · 12.0% · 12mo
- Down + closing
- —
- Monthly P&I
- —
- Monthly cashflow
- —
- DSCR
- —
- Eligible?
- —
Short-term bridge; refi at stabilization.
Listing history 21 events
-
2026-06-18days on market $120,000 Active 41 DOM
-
2026-06-17days on market $120,000 Active 40 DOM
-
2026-06-16days on market $120,000 Active 39 DOM
-
2026-06-15days on market $120,000 Active 38 DOM
-
2026-06-13days on market $120,000 Active 36 DOM
-
2026-06-12days on market $120,000 Active 35 DOM
-
2026-06-09days on market $120,000 Active 32 DOM
-
2026-06-08days on market $120,000 Active 31 DOM
-
2026-06-07days on market $120,000 Active 30 DOM
-
2026-06-07days on market $120,000 Active 29 DOM
-
2026-06-04days on market $120,000 Active 26 DOM
-
2026-06-02days on market $120,000 Active 25 DOM
-
2026-06-01days on market $120,000 Active 24 DOM
-
2026-05-31days on market $120,000 Active 23 DOM
-
2026-05-08$125,000 Active 677-char remark
-
2019-12-09soldstatus $33,000
-
2019-11-30status Under Contract- Do Not Show 272-char remark
Show marketing remark (272 chars)
Come take a look at this spacious home with natural woodwork and large living areas. There are built ins throughout the home. There is a small deck on the front and a private backyard. This home is close to shopping and restaurants! Call today to set up your appointment!
-
2019-11-21soldstatus $33,000 Closed Sale or Rented 272-char remark
Show marketing remark (272 chars)
Come take a look at this spacious home with natural woodwork and large living areas. There are built ins throughout the home. There is a small deck on the front and a private backyard. This home is close to shopping and restaurants! Call today to set up your appointment!
-
2019-09-05price $35,000 272-char remark
Show marketing remark (272 chars)
Come take a look at this spacious home with natural woodwork and large living areas. There are built ins throughout the home. There is a small deck on the front and a private backyard. This home is close to shopping and restaurants! Call today to set up your appointment!
-
2019-08-03$45,000 Active 272-char remark
Show marketing remark (272 chars)
Come take a look at this spacious home with natural woodwork and large living areas. There are built ins throughout the home. There is a small deck on the front and a private backyard. This home is close to shopping and restaurants! Call today to set up your appointment!
-
2013-10-23soldstatus $40,000
ⓘ Source: listings_history table (triggers on properties + properties_extension) + one-shot
backfill from property_details.listing_events for pre-trigger history.
Tax reassessment forecast NY · Partial reset (capped growth)
- Current annual tax
- $1,542 · $129/mo
- Projected year-2 tax
- $1,785 · $149/mo
- Expected delta
- +$243/yr (+$20/mo · 15.8%)
ⓘ Screening estimate from a state-policy table — verify with the county assessor before closing.
Climate risk First Street
- Flood 1/10 Low FEMA zone X · 0% chance over 30 yrs
- Wildfire 3/10 Moderate
- Heat 2/10 Low 8 d/yr ≥90°F today · 18 d/yr by 30 yrs out
- Wind 1/10 Low
- Air quality 1/10 Low 0 unhealthy d/yr today · 0 by 30 yrs out
Nearby sold comps map
Loading sold comps map…
Walkable amenities ~0.75 mi
Loading nearby amenities…
Taxation est. · year 1
- Rental income
- $16,176
- − Mortgage interest
- −$6,722
- − Property taxes
- −$1,542
- − Insurance
- −$600
- − Repairs & maintenance
- −$1,294
- − Management
- −$1,294
- − Depreciation
- −$3,491
- Taxable income
- $1,233
- Est. tax owed @ 24.0%
- −$296
- After-tax cash flow
- $2,790/yr
For passive investors: Depreciation is non-cash, so a rental often shows a tax loss while cash-flowing — sheltering income. Rental losses are passive: they offset passive income freely, and up to $25,000/yr can offset ordinary (W-2) income if you actively participate and your MAGI is under $100k (phasing out to $0 by $150k); unused losses carry forward. On sale, claimed depreciation is recaptured at up to 25%, and gains may owe capital-gains tax (a 1031 exchange can defer both). Figures are a year-1 estimate at your 24.0% rate — not tax advice; consult a CPA.
Schools (NCES district)
- District
- Olean City School District
- NCES district ID
- 3621720
- Math proficiency
- 40% ▼ -10.00%
- Reading proficiency
- 43% ▼ -3.00%
- Median HH income
- $40,365
- Composite
- 34.81/100
- National rank
- #5104
- State rank
- #511 of 590 in NY
Livability — Olean
- Score
- 72/100
- State rank
- #353
- US rank
- #5930
Category grades
Schools grade is shown separately in the Schools card above.
Census & demographics
- Census place
- Olean, NY
- City population
- 17,272
- Population (ZIP)
- 17,272
Population outlook (Cattaraugus County) Hauer SSP2
- Today (2025)
- 71,623 people
- By 2030
- 67,751 · -5.4%
- By 2040
- 59,488 · -16.9%
- By 2050
- 51,601 · -28.0%
- By 2075
- 35,025 · -51.1%
- By 2100
- 21,243 · -70.3%
Race, ethnicity, and origin ACS 2023
- Neighborhood character
- Predominantly White (89%)
- Race & ethnicity
- White 89% Two or more races 5% Black 2% Asian 2% Hispanic / Latino 1%
- Common ancestry
- Romanian 10% Iranian 2% Lithuanian 1%
- Foreign-born
- 3% · Canada
- Languages at home
- 97% English-only · Other Indo-European 1%
Political lean MEDSL · Cattaraugus
- 2024 margin
- Solid R (+32.8) · D 33.6% · R 66.4%
- 2008→2024 swing
- -22.2pp toward R · 2008: -10.6pp · 2024: -32.8pp
- All cycles
- 2024: R+32.8 2020: R+29.5 2016: R+34.4 2012: R+13.4 2008: R+10.6
Not yet ingested
- Civics
- —
Market trends
- HPI YoY
- ▼ -19.85%
- Current HPI
- 237.327
- Rent YoY
- —
- Metro
- —
- State GDP YoY
- ▲ 2.60%
- F500 in state
- 92
Industry mix (Fortune 500 HQ in NY)
| Industry | F500 HQs | Revenue |
|---|---|---|
| Financial Services | 10 | $950B |
|
||
| Consumer Goods | 9 | $162B |
|
||
| Insurance | 4 | $225B |
|
||
| Telecommunications | 2 | $144B |
|
||
| Pharmaceuticals | 2 | $112B |
|
||
| Media / Entertainment | 2 | $69B |
|
||
Price history
+200.0% since first listed8 events — show timeline
- 2026-05-25 Price Changed $120,000 UNYREIS
- 2026-05-08 Listed $125,000 UNYREIS
- 2019-12-09 Sold (Public Records) $33,000 Public Records
- 2019-11-30 Pending — UNYREIS
- 2019-11-21 Sold (MLS) $33,000 UNYREIS
- 2019-09-05 Price Changed $35,000 UNYREIS
- 2019-08-03 Listed $45,000 UNYREIS
- 2013-10-23 Sold (Public Records) $40,000 Public Records
Property tax history
+5.8%/yrLatest (2025): $1,542 · -38.9% YoY. Source: county tax records.
Cash-flow waterfall
monthlySold comps — $/sqft
last 12 mo · ≤1 miLoading sold comps…