 Multi-family
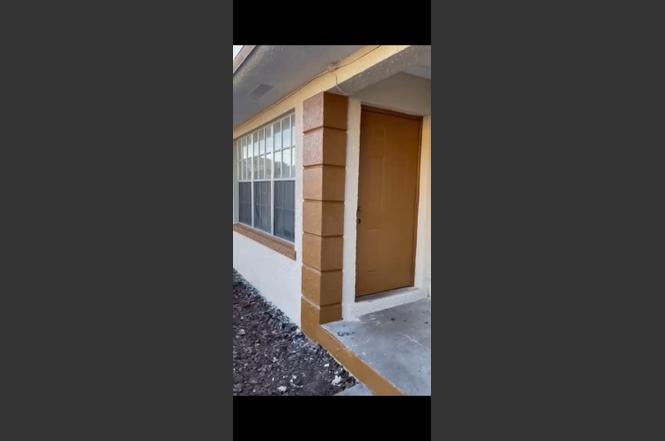
731 21st St Unit 1-2 · West Palm Beach, FL
Flood risk 1/10 · Minimal
- FEMA flood zone
- X (unshaded)
- Chance of flooding over 30 yrs
- 0.0%
- Est. flood insurance / yr
- $507 – $1,088
Fire risk 1/10 · Minimal
- Est. fire insurance / yr
- $947 – $1,759
Heat risk 10/10 · Severe
- Hot days now (above 105°F)
- 7 days/yr
- Hot days in 30 yrs
- 25 days/yr
Wind risk 10/10 · Severe
- Chance of severe wind over 30 yrs
- 99.0%
Air-quality risk 2/10 · Minimal
- Unhealthy air days now
- 1 days/yr
- Unhealthy air days in 30 yrs
- 1 days/yr
Risk factors via First Street. Map © Google.
Why this score? — see what drove the C grade
The composite is a weighted blend of 9 inputs, each scored 0–100. Each bar is that input's sub-score; the figure is the points it added to the 100-point composite (weight × sub-score).
- Cash flow +22.4/30.0
- ARV discount +7.5/15.0
- DSCR +7.2/10.0
- 1% rule +5.9/10.0
- Schools +4.3/10.0
- Livability +4.1/5.0
- Rent growth +3.3/5.0
- Condition / age +2.5/5.0
- Appreciation +0.0/10.0
$625,000
🖨 Deal sheet 📄 Offer letter ✓ Due diligence
Multi-family units
County records classify this as Multi-Family (2-4 Unit). Listing-text estimate: 1 unit. estimate disagrees with records
Key facts
- 5,756 sq ft lot
- Built 1983
- Listed 269 days
Property features AI
Finance
- Financial info: 2 total units; Gross income approximately $57,600; Net operating income approximately $45,880; Tenants pay electricity, sewer, and water
- HOA & community: No association amenities
Exterior
- Utilities: Public water; Public sewer; Three-phase electric; Sewer and water available
- Home design: Duplex; Resale property
- Construction: Block, stucco, and CBS construction; Other roof type
- Exterior features: No waterfront
Interior
- Flooring: Laminate; Tile; Wood
- Bathrooms: 4 total bathrooms
- Heating & cooling: Central electric heating (individual units); Central air conditioning (electric, individual units)
- Interior features: Laminate, tile, and wood flooring
Neighborhood map
What this means for you Summary
Snapshot
- This is a ?-bed/4.0-bath multifamily listed at $625k.
Deal economics
- At list price, monthly cash flow is $1k ($13k/yr) — positive.
- The deal already cash-flows at list — no discount required.
- Meets the 1% rule at list price ($7k rent vs $625k).
- Recommended offer: $550k (12.0% below list) — sets the bar for market timing.
- Cap rate 8.3% vs local median 3.8% in West Palm Beach — top-decile yield for the area; either an underpriced asset or a hidden risk that comps aren't pricing in. Stress-test before assuming the spread holds.
Location & tenants
- Location reads 82/100 on livability (#75 in FL, #1,255 nationally) — a professional / high-income tenant draw. Strengths: commute A+, housing A+, health & safety A+; Watch: employment C-, crime F.
- Palm Beach (suburban): math 46% / reading 53% proficiency, ranked #34 of 73 in FL (top 47%) — families likely to look elsewhere, expect single-tenant / working-renter base with shorter leases.
- Zoned schools: Pleasant City Elementary School (math 27% / reading 27%, grade F, #1,969 of 2,144 statewide, top 94%, 330 students, 94% FRL); Palm Beach Lakes High School (math 17% / reading 26%, grade F, #546 of 667 statewide, top 82%, 2,688 students, 70% FRL) — zoned schools average 82% FRL vs 52% district-wide (30 pts higher); higher-poverty schools than district average — tighter screening recommended.
- Zoned-school proficiency averages 24% at this address vs 50% district-wide (-25 pts) — the specific schools serving this property underperform the Palm Beach average; the district grade overstates school quality for this exact location.
- Market conditions: Rents rising (+3.1%/yr); 305 active listings in the ZIP; 16 comparable units currently listed for rent nearby; rentals at typical pace (median 24d on market — plan ~3-4 weeks tenant-placement turnaround); 3,974 units permitted in Palm Beach County in 2024 (1,012 in 5+ unit buildings).
- At $6,790/mo this rent would consume 136% of the median local household income ($60k/yr) (locally 2157% of renters already pay >50% of income on rent) — very limited rent-growth headroom before tenants either downsize or default.
Forward outlook
- Local home prices are declining (-3.0%/yr); year-one equity from $4k of loan paydown is wiped out by about $19k of value loss. Plan a longer hold.
- Palm Beach County population projected at +30% by 2050 — long-run rental-demand tailwind backs the buy-and-hold thesis.
Negotiation context
- It's been on market 270 days — a 12% lower offer ($550k) is reasonable based on typical stale-listing flexibility.
- 2 sale attempts with the ask held roughly flat each time — persistent listings suggest the price (not the market) is what's stuck; bring a comps-based counter.
Risks & watch-outs
- Climate carrying-cost: severe wind risk, 99% chance of damaging wind over 30y; extreme-heat days projected 7→25/yr by 2055 (HVAC capex compounding) — expect insurance premiums to compound above CPI over the hold.
Questions for the listing agent
- It's been on market 270 days. Have you received any prior offers? Is the seller open to a 12% concession, seller financing, or rate buy-down credit?
- Why hasn't it sold? Are there any deal-killer items the seller is aware of (foundation, flood, title, zoning, code violations)?
- Is there a deadline driving the sale (1031 exchange, divorce, estate, relocation)? That informs how much negotiation room exists.
- Crime grade is F in this area — have there been break-ins, vandalism, or insurance claims at this property in the last 3 years? What carrier currently insures it and at what premium?
- What's the average days-on-market for RENTAL listings here right now (not sales)? A rising rental-DOM trend means longer vacancies and softer asking-rent achievability than the comps imply.
- What's the recent tenant-quality profile in this submarket — average credit score on applications, eviction rate, late-payment / NSF rate, and stable-employment percentage? A property-management company in the area should have these aggregated.
- How much new apartment / multifamily construction is in the pipeline within 1–3 miles? Heavy new supply (>2% of stock underway) typically softens rents 12–24 months out; light construction supports rent growth.
Investment metrics
- 1% rule
- 1.09% ✓
- Cap rate
- 8.30%
- Cash-on-cash
- 7.16%
- DSCR
- 1.32
- GRM
- 7.7
CMA / ARV
No comps found within radius.
Projected returns pro-forma
-3.0% appreciation · 3.08% rent growth · sell at horizon
- IRR
- -5.2%
- Equity multiple
- 0.81×
- Total profit
- $-34,079
- Equity at exit
- $93,190
- IRR
- 4.6%
- Equity multiple
- 1.34×
- Total profit
- $58,680
- Equity at exit
- $54,039
Cash invested: $175,000 (down + closing). Projections, not guarantees.
Landlord ↔ Tenant lean methodology
- Overall (STATE)
- 87 Strongly Landlord-Friendly
- State Florida
- 87 Strongly Landlord-Friendly · R+3
- County
- — inherits STATE
- City
- — inherits STATE
ZIP-level market 33407
- Rents YoY
- 3.1%
- Active inventory
- 305
- Price-to-rent
- 15.3×
Monthly cashflow live
- Estimated rent
- $6,790 high interval (Pro) →
- Mortgage (P&I)
- −$3,278
- Tax est. 1.5%
- −$781 /mo · $9,375/yr
- Insurance
- −$260
- HOA
- −$0
- Vacancy / Maint / Mgmt
- −$1,426
- Net cashflow
- $1,045
Break-even live
2-unit breakdown (identical units grouped — click to expand)
| Units | Beds | Baths | Est. rent |
|---|---|---|---|
| 2× units | 2 | 2 | $6,790 |
| #1 | 2 | 2 | $3,395 |
| #2 | 2 | 2 | $3,395 |
| Total (2 units) | $6,790 | ||
UW: 25.0% down · 7.5% · 30yr · 1.5% tax · 5.0% vac · 8.0% maint · 8.0% mgmt
Financing live
Cash to close
- Down payment
- $156,250
- Closing costs
- $18,750
- Reserves months
- —
- Total cash needed
- —
Loan-product check · same deal, 3 products live
Conventional
25% down · 7.5% · 30yr
- Down + closing
- —
- Monthly P&I
- —
- Monthly cashflow
- —
- DSCR
- —
- Eligible?
- —
Personal DTI + credit; lowest rate.
DSCR
20% down · 8.5% · 30yr
- Down + closing
- —
- Monthly P&I
- —
- Monthly cashflow
- —
- DSCR
- —
- Eligible?
- —
No personal income docs; deal must DSCR.
Hard money
10% down · 12.0% · 12mo
- Down + closing
- —
- Monthly P&I
- —
- Monthly cashflow
- —
- DSCR
- —
- Eligible?
- —
Short-term bridge; refi at stabilization.
Rent comps 16 comps
| Address | Beds | Baths | Sqft | Rent | $/sqft | DOM | Units | Dist |
|---|---|---|---|---|---|---|---|---|
| 411 26th St West Palm Beach, FL | 3.0 | 3.5 | 1847 | $6,900 | $3.74 | 7d | 1 | 0.41mi |
| 419 30th St West Palm Beach, FL | 3.0 | 2.5 | 2104 | $7,700 | $3.66 | 24d | 1 | 0.58mi |
| 1801 N Flagler Dr West Palm Beach, FL | 1.0–2.0 | 1.0–2.0 | 1125 | $4,500 | $4.00 | 2d | 7 | 0.61mi |
| 2800 N Flagler Dr #404 West Palm Beach, FL | 3.0 | 3.0 | 2063 | $7,200 | $3.49 | 24d | 1 | 0.64mi |
| 1617 N Flagler Dr Unit 9B West Palm Beach, FL | 2.0 | 2.5 | 1817 | $8,900 | $4.90 | 14d | 1 | 0.65mi |
| 1551 N Flagler Dr Unit (Annual/Seasonal) Uph 11 West Palm Beach, FL | 2.0 | 2.0 | 1625 | $6,000 | $3.69 | 15d | 1 | 0.66mi |
| 216 32nd St West Palm Beach, FL | 3.0 | 3.0 | 1846 | $6,200 | $3.36 | 24d | 1 | 0.78mi |
| 202 32nd St West Palm Beach, FL | 3.0 | 2.0 | 1636 | $5,995 | $3.66 | 24d | 1 | 0.80mi |
| 406 35th St West Palm Beach, FL | 3.0 | 2.0 | 1835 | $8,000 | $4.36 | 24d | 1 | 0.82mi |
| 409 35th St West Palm Beach, FL | 3.0 | 2.0 | 2496 | $7,000 | $2.80 | 18d | 1 | 0.84mi |
| 575 N Lake Way Palm Beach, FL | 3.0 | 4.5 | 3038 | $25,000 | $8.23 | 24d | 1 | 1.20mi |
| 250 Bradley Pl Palm Beach, FL | 1.0–3.0 | 1.0–2.5 | 1265 | $17,550 | $13.87 | 18d | 3 | 1.29mi |
| 400 N Flagler Dr #2004 West Palm Beach, FL | 2.0 | 2.0 | 1797 | $25,000 | $13.91 | 2d | 1 | 1.33mi |
| 400 N Flagler Dr #2003 West Palm Beach, FL | 2.0 | 2.0 | 1797 | $25,000 | $13.91 | 24d | 1 | 1.33mi |
| 264 Everglade Ave Palm Beach, FL | 3.0 | 4.5 | 2903 | $40,000 | $13.78 | 24d | 1 | 1.39mi |
| 101 N Clematis St West Palm Beach, FL | 1.0–4.0 | 1.5–4.5 | 1906 | $12,400 | $6.50 | 24d | 2 | 1.47mi |
Listing history 15 events
-
2026-06-18days on market $625,000 Active 270 DOM
-
2026-06-17days on market $625,000 Active 269 DOM
-
2026-06-16days on market $625,000 Active 268 DOM
-
2026-06-15days on market $625,000 Active 267 DOM
-
2026-06-13days on market $625,000 Active 265 DOM
-
2026-06-09days on market $625,000 Active 261 DOM
-
2026-06-07days on market $625,000 Active 259 DOM
-
2026-06-04days on market $625,000 Active 256 DOM
-
2026-06-03days on market $625,000 Active 255 DOM
-
2026-06-01days on market $625,000 Active 253 DOM
-
2026-05-31days on market $625,000 Active 252 DOM
-
2026-04-01status Active
-
2026-03-31historical
-
2026-01-02price $625,000
-
2025-09-20$650,000 Active
ⓘ Source: listings_history table (triggers on properties + properties_extension) + one-shot
backfill from property_details.listing_events for pre-trigger history.
Climate risk First Street
- Flood 1/10 Low FEMA zone X (unshaded) · 0% chance over 30 yrs
- Wildfire 1/10 Low
- Heat 10/10 Extreme 7 d/yr ≥105°F today · 25 d/yr by 30 yrs out
- Wind 10/10 Extreme 99% chance of damaging wind over 30 yrs
- Air quality 2/10 Low 1 unhealthy d/yr today · 1 by 30 yrs out
Nearby sold comps map
Loading sold comps map…
Walkable amenities ~0.75 mi
Loading nearby amenities…
Taxation est. · year 1
- Rental income
- $81,480
- − Mortgage interest
- −$35,010
- − Property taxes
- −$9,375
- − Insurance
- −$3,125
- − Repairs & maintenance
- −$6,518
- − Management
- −$6,518
- − Depreciation
- −$18,182
- Taxable income
- $2,752
- Est. tax owed @ 24.0%
- −$660
- After-tax cash flow
- $11,878/yr
For passive investors: Depreciation is non-cash, so a rental often shows a tax loss while cash-flowing — sheltering income. Rental losses are passive: they offset passive income freely, and up to $25,000/yr can offset ordinary (W-2) income if you actively participate and your MAGI is under $100k (phasing out to $0 by $150k); unused losses carry forward. On sale, claimed depreciation is recaptured at up to 25%, and gains may owe capital-gains tax (a 1031 exchange can defer both). Figures are a year-1 estimate at your 24.0% rate — not tax advice; consult a CPA.
Schools (NCES district)
- District
- Palm Beach
- NCES district ID
- 1201500
- Math proficiency
- 46% ▼ -16.00%
- Reading proficiency
- 53% ▼ -4.00%
- Median HH income
- $53,943
- Composite
- 42.72/100
- National rank
- #3160
- State rank
- #34 of 73 in FL
Livability — West Palm Beach
- Score
- 82/100
- State rank
- #75
- US rank
- #1255
Category grades
Schools grade is shown separately in the Schools card above.
Census & demographics
- Census place
- West Palm Beach, FL
- County
- Palm Beach County · 1,438,312 people
- City population
- 222,012
- Metro
- Miami-Fort Lauderdale-Pompano Beach, FL
- Population (ZIP)
- 34,851
- Household income
- $59,993
- Rent vs Own
- Severe rent burden
- 2157.0
Population outlook (Palm Beach County) Hauer SSP2
- Today (2025)
- 1,637,487 people
- By 2030
- 1,743,255 · +6.5%
- By 2040
- 1,948,712 · +19.0%
- By 2050
- 2,132,979 · +30.3%
- By 2075
- 2,530,027 · +54.5%
- By 2100
- 2,706,979 · +65.3%
Race, ethnicity, and origin ACS 2023
- Neighborhood character
- Diverse neighborhood (Simpson 0.62)
- Race & ethnicity
- Black 54% White 21% Hispanic / Latino 20% Two or more races 13% Asian 2%
- Hispanic origin (detail)
- Mexican 2% Puerto Rican 2% Cuban 2%
- Common ancestry
- Hispanic 8% Lithuanian 1% Romanian 1%
- Foreign-born
- 26% · Canada, Vietnam, Jamaica
- Languages at home
- 72% English-only · Spanish 17% French/Haitian/Cajun 8% Other Indo-European 1%
Political lean MEDSL · Palm Beach
- 2024 margin
- Toss-up / Even · D 50.0% · R 49.2%
- 2008→2024 swing
- -22.1pp toward R · 2008: 22.9pp · 2024: 0.8pp
- All cycles
- 2024: D+0.8 2020: D+12.8 2016: D+15.3 2012: D+17.0 2008: D+22.9
Not yet ingested
- Civics
- —
Market trends
- HPI YoY
- ▼ -299.26%
- Current HPI
- 363.3995
- Rent YoY
- ▲ 3.08%
- Metro
- Miami-Fort Lauderdale-Pompano Beach, FL
- State GDP YoY
- ▲ 3.28%
- F500 in state
- 36
Industry mix (Fortune 500 HQ in FL)
| Industry | F500 HQs | Revenue |
|---|---|---|
| Industrial Technology | 2 | $29B |
|
||
| Insurance | 2 | $17B |
|
||
| Retail | 1 | $60B |
|
||
| Technology Distribution | 1 | $58B |
|
||
| Homebuilding | 1 | $35B |
|
||
| Technology Manufacturing | 1 | $35B |
|
||
Price history
-3.8% since first listed4 events — show timeline
- 2026-04-01 Relisted — Beaches MLS
- 2026-03-31 Listing Removed — Beaches MLS
- 2026-01-02 Price Changed $625,000 Beaches MLS
- 2025-09-20 Listed $650,000 Beaches MLS
Cash-flow waterfall
monthlySold comps — $/sqft
last 12 mo · ≤1 miLoading sold comps…