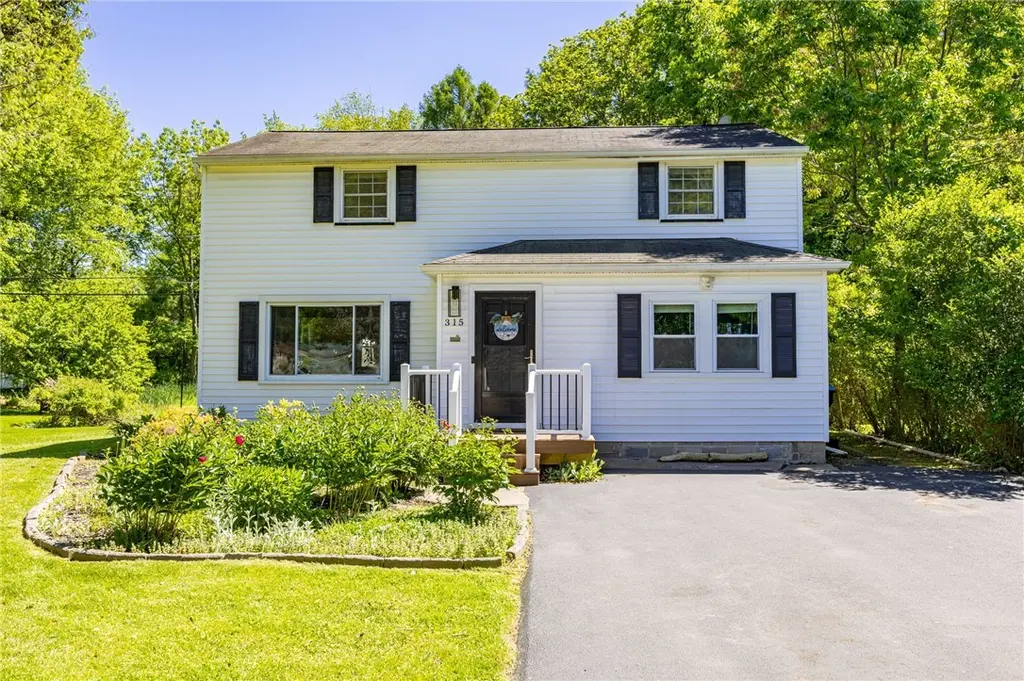
315 Eaton Rd · Irondequoit, NY
Flood risk 7/10 · Major
- FEMA flood zone
- X (unshaded)
- Chance of flooding over 30 yrs
- 0.77%
- Est. flood insurance / yr
- $473 – $860
Fire risk 3/10 · Minor
- Est. fire insurance / yr
- $691 – $1,283
Heat risk 2/10 · Minimal
- Hot days now (above 95°F)
- 7 days/yr
- Hot days in 30 yrs
- 15 days/yr
Wind risk 1/10 · Minimal
- Chance of severe wind over 30 yrs
- —
Air-quality risk 2/10 · Minimal
- Unhealthy air days now
- 1 days/yr
- Unhealthy air days in 30 yrs
- 2 days/yr
Risk factors via First Street. Map © Google.
Why this score? — see what drove the C grade
The composite is a weighted blend of 9 inputs, each scored 0–100. Each bar is that input's sub-score; the figure is the points it added to the 100-point composite (weight × sub-score).
- Cash flow +17.1/30.0
- ARV discount +15.0/15.0
- 1% rule +6.6/10.0
- Schools +6.2/10.0
- DSCR +5.3/10.0
- Livability +4.0/5.0
- Rent growth +2.5/5.0
- Condition / age +2.5/5.0
- Appreciation +0.0/10.0
$209,900
🖨 Deal sheet 📄 Offer letter ✓ Due diligence
Listing remarks MLS
Superb location for this 3 bedroom colonial. Private, wooded 1/2 acre lot with above ground pool, 12x17 shed. The interior has a neutral palette, freshly painted with hardwood floors just refinished! Kitchen has stainless appliances, white cabinetry, recessed light. Opens into the large family room which is a perfect space for entertaining. Bright front living room with separate dining area. First floor powder room, central air, triple pane replacement windows on first floor, brand new hot water tank. Primary bedroom has 3 closets. Maintenance-free vinyl siding, new double wide driveway offer tons of parking. Square footage is per an appraisal. It's a short walk to the riverfront, marinas, Lake Ontario, shopping and restaurants.
Key facts
- Beautiful patio area
- Private wooded lot
- Hardwood floors
Tags
Property features AI
Exterior
- Parking: No garage
- Utilities: Electricity connected (circuit breakers); Public water connected; Sewer connected; High-speed internet available; Cable available
- Home design: 2-story house; Existing (previously built); City street frontage; Rectangular, wooded residential lot
- Construction: Vinyl siding; Copper plumbing; Asphalt shingle roof; Block foundation; Full basement with sump pump
- Exterior features: Blacktop driveway; Open patio and porch; Patio; Porch; Shed(s) and storage
Interior
- Kitchen: Gas oven and gas range; Range hood; Dishwasher; Garbage disposal; Refrigerator; Exhaust fan; Pantry
- Bedrooms: Total rooms include bedrooms (total 7 rooms)
- Flooring: Hardwood; Tile; Vinyl; Varied flooring
- Bathrooms: 1 full bathroom; 1 half bathroom; 1 main-level bathroom
- Heating & cooling: Gas forced-air heating; Central air conditioning
- Interior features: Cedar closets; Ceiling fans; Separate/formal dining room; Separate/formal living room; Kitchen open to family room; Living/dining room arrangement; Pantry; Thermal windows
- Laundry & utility: Washer and dryer; Laundry located in basement; Gas water heater
Neighborhood map
What this means for you Summary
Snapshot
- This is a 3-bed/1.5-bath single-family listed at $210k.
Deal economics
- At list price, monthly cash flow is $91 ($1k/yr) — positive.
- The deal already cash-flows at list — no discount required.
- Meets the 1% rule at list price ($2k rent vs $210k).
- Cap rate 7.1% vs local median 4.5% in Irondequoit — top-decile yield for the area; either an underpriced asset or a hidden risk that comps aren't pricing in. Stress-test before assuming the spread holds.
Location & tenants
- Location reads 81/100 on livability (#92 in NY, #1,414 nationally) — a professional / high-income tenant draw. Strengths: housing A+, health & safety A+, crime B+; Watch: amenities F.
- West Irondequoit Central School District (suburban): math 73% / reading 70% proficiency, ranked #126 of 590 in NY (top 21%) — strong family-tenant draw, lease renewals of 3-5y typical; only 18% free/reduced lunch — higher-income household profile.
- Market conditions: 102 active listings in the ZIP; 8 comparable units currently listed for rent nearby; rentals leasing fast (median 3d on market — plan ~1-2 weeks tenant-placement turnaround); solid renter incomes; 1,169 units permitted in Monroe County in 2024 (591 in 5+ unit buildings).
- This rent runs 32% of the median local income ($90k/yr) — at the standard rent-burdened threshold; future hikes will face affordability resistance.
Forward outlook
- Local home prices are declining (-3.0%/yr); year-one equity from $1k of loan paydown is wiped out by about $6k of value loss. Plan a longer hold.
- Monroe County population projected to shrink 6% by 2050 — rents likely to lag national; underwrite the cash flow, not the appreciation.
Negotiation context
- Only 6 days on market — expect competitive offers; lowballing is unlikely to land.
- 2 sale attempts since 3y ago with the ask held roughly flat each time — persistent listings suggest the price (not the market) is what's stuck; bring a comps-based counter.
- Current owner paid $180k; 17% above their basis — modest negotiation headroom, anchor on the comps not their cost.
Risks & watch-outs
- Watch-outs: property tax is 3.4% of price; flood insurance adds $56/mo; built in 1955 — expect roof / HVAC / electrical / plumbing capex.
- Climate carrying-cost: major flood risk — expect insurance premiums to compound above CPI over the hold.
Questions for the listing agent
- Built in 1955 — when were the roof, HVAC, electrical panel, plumbing, and water heater last replaced?
- Property tax is high relative to price — has the assessment been appealed recently, and will the sale trigger a re-assessment?
- What's the actual annual flood-insurance premium (NFIP or private), and is the property in a SFHA with mandatory coverage?
- Is there a deadline driving the sale (1031 exchange, divorce, estate, relocation)? That informs how much negotiation room exists.
- Schools are B-rated — typically a magnet for longer-tenancy family renters. What's the average tenant stay here, and is there a school-zone premium baked into asking?
- What's the average days-on-market for RENTAL listings here right now (not sales)? A rising rental-DOM trend means longer vacancies and softer asking-rent achievability than the comps imply.
- What's the recent tenant-quality profile in this submarket — average credit score on applications, eviction rate, late-payment / NSF rate, and stable-employment percentage? A property-management company in the area should have these aggregated.
- How much new for-sale + rental construction is in the pipeline within 1–3 miles? Heavy new supply typically softens prices + rents 12–24 months out; constrained supply supports both.
Investment metrics
- 1% rule
- 1.16% ✓
- Cap rate
- 7.13%
- Cash-on-cash
- 3.00%
- DSCR
- 1.13
- GRM
- 7.2
CMA / ARV
- ARV (on-the-fly)
- $294,400
- Comps found
- 12
Show comp detail 12 sales within ~0.75 mi
| Address | Dist | Beds/Ba | Sqft | Sold | Price | $/sf | Match |
|---|---|---|---|---|---|---|---|
| 63 Shorewood Dr | 0.51mi | 3/1.0 | 1,556 (-3%) | 0mo | $210,000 | $135 | 70 |
| 230 Lake Shore Boulevard Ext | 0.20mi | 4/1.5 (+1) | 1,732 (+8%) | 9mo | $350,000 | $202 | 65 |
| 46 Dewey Ave | 0.26mi | 3/2.5 | 1,443 (-10%) | 4mo | $280,000 | $194 | 64 |
| 78 Ontario View St | 0.16mi | 3/1.0 | 1,394 (-13%) | 6mo | $185,000 | $133 | 64 |
| 15 Beaconview Ct | 0.39mi | 3/1.5 | 1,470 (-8%) | 8mo | $270,000 | $184 | 61 |
| 37 Oakmount Dr | 0.16mi | 4/2.0 (+1) | 1,368 (-14%) | 1mo | $295,000 | $216 | 60 |
| 539 Washington Ave | 0.28mi | 3/2.0 | 1,361 (-15%) | 1mo | $222,000 | $163 | 60 |
| 340 Washington Ave | 0.34mi | 3/2.0 | 1,428 (-11%) | 8mo | $225,000 | $158 | 58 |
| 18 Centre Ter | 0.57mi | 3/1.0 | 1,476 (-8%) | 6mo | $232,000 | $157 | 54 |
| 117 Shorewood Dr | 0.48mi | 3/1.0 | 1,395 (-13%) | 5mo | $260,000 | $186 | 50 |
| 62 Shorewood Dr | 0.53mi | 3/1.0 | 1,364 (-15%) | 5mo | $293,000 | $215 | 44 |
| 318 Thomas Ave | 0.63mi | 3/1.5 | 1,824 (+14%) | 8mo | $300,000 | $164 | 41 |
Match score weights: distance 35% · size 25% · config 20% · recency 20%. Top-matched comps best support the ARV.
Projected returns pro-forma
-3.0% appreciation · 3.0% rent growth · sell at horizon
- IRR
- -13.2%
- Equity multiple
- 0.52×
- Total profit
- $-27,928
- Equity at exit
- $31,297
- IRR
- -4.0%
- Equity multiple
- 0.73×
- Total profit
- $-15,727
- Equity at exit
- $18,148
Cash invested: $58,772 (down + closing). Projections, not guarantees.
Landlord ↔ Tenant lean methodology
- Overall (STATE)
- 15 Strongly Tenant-Friendly
- State New York
- 15 Strongly Tenant-Friendly · D+10
- County
- — inherits STATE
- City
- — inherits STATE
ZIP-level market 14617
- Active inventory
- 102
- Price-to-rent
- 7.2×
Monthly cashflow live
- Estimated rent
- $2,438 high interval (Pro) →
- Mortgage (P&I)
- −$1,101
- Tax from tax record
- −$591 /mo · $7,094/yr
- Insurance
- −$87
- Flood insurance flood zone
- −$56 /mo · $666/yr
- HOA
- −$0
- Vacancy / Maint / Mgmt
- −$512
- Net cashflow
- $91
Break-even live
UW: 25.0% down · 7.5% · 30yr · 1.5% tax · 5.0% vac · 8.0% maint · 8.0% mgmt
Financing live
Cash to close
- Down payment
- $52,475
- Closing costs
- $6,297
- Reserves months
- —
- Total cash needed
- —
Loan-product check · same deal, 3 products live
Conventional
25% down · 7.5% · 30yr
- Down + closing
- —
- Monthly P&I
- —
- Monthly cashflow
- —
- DSCR
- —
- Eligible?
- —
Personal DTI + credit; lowest rate.
DSCR
20% down · 8.5% · 30yr
- Down + closing
- —
- Monthly P&I
- —
- Monthly cashflow
- —
- DSCR
- —
- Eligible?
- —
No personal income docs; deal must DSCR.
Hard money
10% down · 12.0% · 12mo
- Down + closing
- —
- Monthly P&I
- —
- Monthly cashflow
- —
- DSCR
- —
- Eligible?
- —
Short-term bridge; refi at stabilization.
Rent comps 8 comps
| Address | Beds | Baths | Sqft | Rent | $/sqft | DOM | Units | Dist |
|---|---|---|---|---|---|---|---|---|
| 37 Oakmount Dr Rochester, NY | 4.0 | 2.0 | 1368 | $2,500 | $1.83 | 14d | 1 | 0.15mi |
| 4302 Lake Ave Unit 1 Rochester, NY | 3.0 | 1.5 | 1600 | $3,000 | $1.88 | 43d | 1 | 0.74mi |
| 485 Oakridge Dr Rochester, NY | 3.0 | 1.5 | 1826 | $4,000 | $2.19 | 2d | 1 | 0.91mi |
| 123 Spanish Trl Rochester, NY | 1.0–2.0 | 1.0–1.5 | 945 | $1,775 | $1.88 | 2d | 1 | 1.09mi |
| 3677 Lake Ave Rochester, NY | 2.0 | 1.0 | 1088 | $1,200 | $1.10 | 43d | 1 | 1.17mi |
| 500 Greenleaf Rd Rochester, NY | 1.0–2.0 | 1.0 | 1176 | $1,650 | $1.40 | 2d | 1 | 1.18mi |
| 125 Windsor Rd Rochester, NY | 2.0 | 1.0 | 1142 | $1,700 | $1.49 | 2d | 1 | 1.43mi |
| 58 Fairview Cres Rochester, NY | 4.0 | 1.5 | 2194 | $3,600 | $1.64 | 2d | 1 | 1.44mi |
Listing history 6 events
-
2026-06-10status $209,900 Pending 6 DOM
-
2026-06-09days on market $209,900 Active 6 DOM
-
2026-06-09days on market $209,900 Active 5 DOM
-
2026-06-07days on market $209,900 Active 4 DOM
-
2026-06-03remarks 699-char remark
-
2026-06-03$209,900 Active 1 DOM
ⓘ Source: listings_history table (triggers on properties + properties_extension) + one-shot
backfill from property_details.listing_events for pre-trigger history.
Tax reassessment forecast NY · Partial reset (capped growth)
- Current annual tax
- $7,094 · $591/mo
- Projected year-2 tax
- $7,094 · $591/mo
- Expected delta
- $0/yr ($0/mo · 0.0%)
ⓘ Screening estimate from a state-policy table — verify with the county assessor before closing.
Climate risk First Street
- Flood 7/10 Severe FEMA zone X (unshaded) · 77% chance over 30 yrs
- Wildfire 3/10 Moderate
- Heat 2/10 Low 7 d/yr ≥95°F today · 15 d/yr by 30 yrs out
- Wind 1/10 Low
- Air quality 2/10 Low 1 unhealthy d/yr today · 2 by 30 yrs out
Nearby sold comps map
Loading sold comps map…
Walkable amenities ~0.75 mi
Loading nearby amenities…
Taxation est. · year 1
- Rental income
- $29,258
- − Mortgage interest
- −$11,758
- − Property taxes
- −$7,094
- − Insurance
- −$1,716
- − Repairs & maintenance
- −$2,341
- − Management
- −$2,341
- − Depreciation
- −$6,106
- Taxable loss
- −$2,097
- Est. tax savings @ 24.0%
- +$503
- After-tax cash flow
- $1,598/yr
For passive investors: Depreciation is non-cash, so a rental often shows a tax loss while cash-flowing — sheltering income. Rental losses are passive: they offset passive income freely, and up to $25,000/yr can offset ordinary (W-2) income if you actively participate and your MAGI is under $100k (phasing out to $0 by $150k); unused losses carry forward. On sale, claimed depreciation is recaptured at up to 25%, and gains may owe capital-gains tax (a 1031 exchange can defer both). Figures are a year-1 estimate at your 24.0% rate — not tax advice; consult a CPA.
Schools (NCES district)
- District
- West Irondequoit Central School District
- NCES district ID
- 3615390
- Math proficiency
- 73% ▲ 3.00%
- Reading proficiency
- 70% ▲ 5.00%
- Median HH income
- $60,218
- Composite
- 61.61/100
- National rank
- #748
- State rank
- #126 of 590 in NY
Livability — Irondequoit
- Score
- 81/100
- State rank
- #92
- US rank
- #1414
Category grades
Schools grade is shown separately in the Schools card above.
Census & demographics
- Census place
- Irondequoit, NY
- County
- Monroe County · 674,131 people
- City population
- 74,252
- Metro
- Rochester, NY
- Population (ZIP)
- 21,788
- Household income
- $90,192
- Rent vs Own
- Severe rent burden
- 426.0
Population outlook (Monroe County) Hauer SSP2
- Today (2025)
- 759,460 people
- By 2030
- 757,154 · -0.3%
- By 2040
- 740,644 · -2.5%
- By 2050
- 714,443 · -5.9%
- By 2075
- 645,883 · -15.0%
- By 2100
- 547,084 · -28.0%
Race, ethnicity, and origin ACS 2023
- Neighborhood character
- Predominantly White (85%)
- Race & ethnicity
- White 85% Hispanic / Latino 8% Two or more races 6% Black 4%
- Hispanic origin (detail)
- Puerto Rican 4%
- Common ancestry
- Romanian 6% Iranian 3% Lithuanian 3%
- Foreign-born
- 4% · Canada
- Languages at home
- 93% English-only · Spanish 4% Other Indo-European 1% Russian/Polish/Slavic 1%
Political lean MEDSL · Monroe
- 2024 margin
- D (+19.1) · D 59.5% · R 40.5%
- 2008→2024 swing
- +1.4pp toward D · 2008: 17.7pp · 2024: 19.1pp
- All cycles
- 2024: D+19.1 2020: D+21.0 2016: D+14.1 2012: D+17.4 2008: D+17.7
Not yet ingested
- Civics
- —
Market trends
- HPI YoY
- ▼ -148.22%
- Current HPI
- 263.9973
- Rent YoY
- —
- Metro
- Rochester, NY
- State GDP YoY
- ▲ 2.60%
- F500 in state
- 92
Industry mix (Fortune 500 HQ in NY)
| Industry | F500 HQs | Revenue |
|---|---|---|
| Financial Services | 10 | $950B |
|
||
| Consumer Goods | 9 | $162B |
|
||
| Insurance | 4 | $225B |
|
||
| Telecommunications | 2 | $144B |
|
||
| Pharmaceuticals | 2 | $112B |
|
||
| Media / Entertainment | 2 | $69B |
|
||
Price history
+154.4% since first listed12 events — show timeline
- 2026-06-03 Listed $209,900 UNYREIS
- 2024-01-25 Sold (Public Records) $180,000 Public Records
- 2024-01-24 Sold (MLS) $180,000 UNYREIS
- 2023-12-27 Pending — UNYREIS
- 2023-12-05 Pending — UNYREIS
- 2023-12-04 Pending — UNYREIS
- 2023-12-04 Contingent — UNYREIS
- 2023-12-02 Price Changed $179,900 UNYREIS
- 2023-11-21 Listed $189,900 UNYREIS
- 2007-06-15 Sold (Public Records) $117,000 Public Records
- 2000-06-01 Sold (Public Records) $92,000 Public Records
- 1993-06-30 Sold (Public Records) $82,500 Public Records
Property tax history
+2.9%/yrLatest (2025): $7,094 · +4.0% YoY. Source: county tax records.
Cash-flow waterfall
monthlySold comps — $/sqft
last 12 mo · ≤1 miLoading sold comps…