545 Elm St #34 · Milford, NH
Flood risk 4/10 · Minor
- FEMA flood zone
- AE
- Chance of flooding over 30 yrs
- 0.21%
- Est. flood insurance / yr
- $1,737 – $8,500
Fire risk 1/10 · Minimal
- Est. fire insurance / yr
- $507 – $941
Heat risk 4/10 · Minor
- Hot days now (above 95°F)
- 7 days/yr
- Hot days in 30 yrs
- 17 days/yr
Wind risk 6/10 · Moderate
- Chance of severe wind over 30 yrs
- 27.0%
Air-quality risk 2/10 · Minimal
- Unhealthy air days now
- 1 days/yr
- Unhealthy air days in 30 yrs
- 1 days/yr
Risk factors via First Street. Map © Google.
Why this score? — see what drove the B grade
The composite is a weighted blend of 9 inputs, each scored 0–100. Each bar is that input's sub-score; the figure is the points it added to the 100-point composite (weight × sub-score).
- Cash flow +26.9/30.0
- ARV discount +15.0/15.0
- DSCR +9.3/10.0
- 1% rule +7.0/10.0
- Schools +3.8/10.0
- Livability +3.5/5.0
- Rent growth +2.5/5.0
- Condition / age +2.5/5.0
- Appreciation +0.0/10.0
$199,900
🖨 Deal sheet 📄 Offer letter ✓ Due diligence
Listing remarks
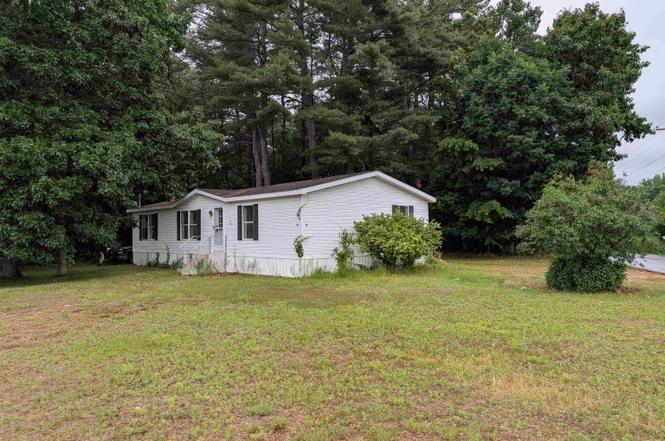
Spacious 3-bedroom 2-bath mobile home offering an opportunity for affordable home ownership in Milford! This 1989 doublewide home features an open concept living room, dining area and kitchen with ample counter & cabinet space and each bedroom has a really nicely sized walk-in closet!. The primary bedroom and bathroom are on one end of the home, and two additional bedrooms and the full bath are on the other. Mudroom/laundry area with washer/dryer as well. PRIVATE deck off the back and a small shed and this truly is on one of the nicest lots in the park!. The little corner lot is level and low maintenance and it is all located in a small, quiet park close to all of Milford's shopping a
Key facts
- Private deck
- Walk-in closet
- Small shed
Tags
Property features AI
Finance
- Other: Located in a mobile home park (Milhaven Park)
- HOA & community: Fees include trash and park rent
Exterior
- Parking: Dirt driveway
- Utilities: Public water; Public sewer; Eversource electric with circuit breakers; High-speed internet available; Cable available (Comcast); Phone service via Comcast
- Home design: Manufactured home (mobile); Vinyl siding; White exterior; Shingle (asphalt) roof; Located in a mobile home park (Milhaven Park); park approval granted; Unit/Lot #34; Built in 1989
- Construction: Manufactured construction; Vinyl siding; Asphalt shingle roof; Year built: 1989
- Exterior features: Corner lot; Level lot; Dirt driveway
Interior
- Kitchen: Kitchen (12 x 10); Dishwasher; Gas range with exhaust hood; Refrigerator
- Bedrooms: Master bedroom (level 1); Bedroom (12 x 10, level 1); Bedroom (11 x 11, level 1)
- Flooring: Carpet; Vinyl
- Bathrooms: One full bathroom; One three-quarter bathroom
- Heating & cooling: Hot air heating
- Interior features: Six total rooms; Carpet and vinyl flooring
- Laundry & utility: Washer; Dryer
Neighborhood map
What this means for you Summary
Snapshot
- This is a 3-bed/2.0-bath manufactured listed at $200k.
Deal economics
- At list price, monthly cash flow is $125 ($1k/yr) — positive.
- The deal already cash-flows at list — no discount required.
- Meets the 1% rule at list price ($2k rent vs $200k).
- Cap rate 9.6% vs local median 2.5% in Milford — top-decile yield for the area; either an underpriced asset or a hidden risk that comps aren't pricing in. Stress-test before assuming the spread holds.
Location & tenants
- Location reads 70/100 on livability (#45 in NH) — a middle-class / working-renter tenant base. Strengths: crime A+, housing A+, employment B; Watch: amenities F, commute F, health & safety D-.
- Milford School District (suburban): math 35% / reading 50% proficiency, ranked #57 of 98 in NH (top 58%) — families likely to look elsewhere, expect single-tenant / working-renter base with shorter leases; only 16% free/reduced lunch — higher-income household profile.
- Market conditions: 42 active listings in the ZIP; solid renter incomes; 981 units permitted in Hillsborough County in 2024 (381 in 5+ unit buildings).
Forward outlook
- Local home prices are declining (-3.0%/yr); year-one equity from $1k of loan paydown is wiped out by about $6k of value loss. Plan a longer hold.
- Hillsborough County population projected to shrink 8% by 2050 — rents likely to lag national; underwrite the cash flow, not the appreciation.
Negotiation context
- Only 1 days on market — expect competitive offers; lowballing is unlikely to land.
Risks & watch-outs
- Watch-outs: flood insurance adds $427/mo.
- Climate carrying-cost: in FEMA flood zone AE (mandatory federal flood insurance); major wind risk, 27% chance of damaging wind over 30y — expect insurance premiums to compound above CPI over the hold.
Questions for the listing agent
- What's the actual annual flood-insurance premium (NFIP or private), and is the property in a SFHA with mandatory coverage?
- Is there a deadline driving the sale (1031 exchange, divorce, estate, relocation)? That informs how much negotiation room exists.
- What's the average days-on-market for RENTAL listings here right now (not sales)? A rising rental-DOM trend means longer vacancies and softer asking-rent achievability than the comps imply.
- What's the recent tenant-quality profile in this submarket — average credit score on applications, eviction rate, late-payment / NSF rate, and stable-employment percentage? A property-management company in the area should have these aggregated.
- How much new for-sale + rental construction is in the pipeline within 1–3 miles? Heavy new supply typically softens prices + rents 12–24 months out; constrained supply supports both.
Investment metrics
- 1% rule
- 1.20% ✓
- Cap rate
- 9.60%
- Cash-on-cash
- 11.82%
- DSCR
- 1.53
- GRM
- 7.0
CMA / ARV
- ARV (on-the-fly)
- $239,616
- Comps found
- 2
Show comp detail 2 sales within ~0.75 mi
| Address | Dist | Beds/Ba | Sqft | Sold | Price | $/sf | Match |
|---|---|---|---|---|---|---|---|
| 545 Elm St #4 | 0.00mi | 3/2.0 | 1,104 (-4%) | 0mo | $229,900 | $208 | 93 |
| 545 Elm St #11 | 0.00mi | 3/2.0 | 1,188 (+3%) | 13mo | $215,000 | $181 | 84 |
Match score weights: distance 35% · size 25% · config 20% · recency 20%. Top-matched comps best support the ARV.
Projected returns pro-forma
-3.0% appreciation · 3.0% rent growth · sell at horizon
- IRR
- -11.9%
- Equity multiple
- 0.57×
- Total profit
- $-24,162
- Equity at exit
- $29,806
- IRR
- -2.5%
- Equity multiple
- 0.83×
- Total profit
- $-9,685
- Equity at exit
- $17,284
Cash invested: $55,972 (down + closing). Projections, not guarantees.
Landlord ↔ Tenant lean methodology
- Overall (STATE)
- 56 Moderately Landlord-Leaning
- State New Hampshire
- 56 Moderately Landlord-Leaning · D+1
- County
- — inherits STATE
- City
- — inherits STATE
ZIP-level market 03055
- Active inventory
- 42
- Price-to-rent
- 7.0×
Monthly cashflow live
- Estimated rent
- $2,395 medium interval (Pro) →
- Mortgage (P&I)
- −$1,048
- Tax from tax record
- −$209 /mo · $2,505/yr
- Insurance
- −$83
- Flood insurance flood zone
- −$427 /mo · $5,118/yr
- HOA
- −$0
- Vacancy / Maint / Mgmt
- −$503
- Net cashflow
- $125
Break-even live
UW: 25.0% down · 7.5% · 30yr · 1.5% tax · 5.0% vac · 8.0% maint · 8.0% mgmt
Financing live
Cash to close
- Down payment
- $49,975
- Closing costs
- $5,997
- Reserves months
- —
- Total cash needed
- —
Loan-product check · same deal, 3 products live
Conventional
25% down · 7.5% · 30yr
- Down + closing
- —
- Monthly P&I
- —
- Monthly cashflow
- —
- DSCR
- —
- Eligible?
- —
Personal DTI + credit; lowest rate.
DSCR
20% down · 8.5% · 30yr
- Down + closing
- —
- Monthly P&I
- —
- Monthly cashflow
- —
- DSCR
- —
- Eligible?
- —
No personal income docs; deal must DSCR.
Hard money
10% down · 12.0% · 12mo
- Down + closing
- —
- Monthly P&I
- —
- Monthly cashflow
- —
- DSCR
- —
- Eligible?
- —
Short-term bridge; refi at stabilization.
Listing history 2 events
-
2026-06-18remarks 695-char remark
-
2026-06-18$199,900 Active 1 DOM
ⓘ Source: listings_history table (triggers on properties + properties_extension) + one-shot
backfill from property_details.listing_events for pre-trigger history.
Tax reassessment forecast NH · Partial reset (capped growth)
- Current annual tax
- $2,505 · $209/mo
- Projected year-2 tax
- $3,431 · $286/mo
- Expected delta
- +$926/yr (+$77/mo · 37.0%)
ⓘ Screening estimate from a state-policy table — verify with the county assessor before closing.
Climate risk First Street
- Flood 4/10 Moderate FEMA zone AE · 21% chance over 30 yrs
- Wildfire 1/10 Low
- Heat 4/10 Moderate 7 d/yr ≥95°F today · 17 d/yr by 30 yrs out
- Wind 6/10 Major 27% chance of damaging wind over 30 yrs
- Air quality 2/10 Low 1 unhealthy d/yr today · 1 by 30 yrs out
Nearby sold comps map
Loading sold comps map…
Walkable amenities ~0.75 mi
Loading nearby amenities…
Taxation est. · year 1
- Rental income
- $28,736
- − Mortgage interest
- −$11,198
- − Property taxes
- −$2,505
- − Insurance
- −$6,118
- − Repairs & maintenance
- −$2,299
- − Management
- −$2,299
- − Depreciation
- −$5,815
- Taxable loss
- −$1,497
- Est. tax savings @ 24.0%
- +$359
- After-tax cash flow
- $1,859/yr
For passive investors: Depreciation is non-cash, so a rental often shows a tax loss while cash-flowing — sheltering income. Rental losses are passive: they offset passive income freely, and up to $25,000/yr can offset ordinary (W-2) income if you actively participate and your MAGI is under $100k (phasing out to $0 by $150k); unused losses carry forward. On sale, claimed depreciation is recaptured at up to 25%, and gains may owe capital-gains tax (a 1031 exchange can defer both). Figures are a year-1 estimate at your 24.0% rate — not tax advice; consult a CPA.
Schools (NCES district)
- District
- Milford School District
- NCES district ID
- 3304830
- Math proficiency
- 35% ▼ -18.00%
- Reading proficiency
- 50% ▼ -6.00%
- Median HH income
- $67,496
- Composite
- 38.18/100
- National rank
- #4262
- State rank
- #57 of 98 in NH
Livability — Milford
- Score
- 70/100
- State rank
- #45
- US rank
- #7432
Category grades
Schools grade is shown separately in the Schools card above.
Census & demographics
- County
- Hillsborough County · 309,362 people
- City population
- 16,337
- Metro
- Manchester-Nashua, NH
- Population (ZIP)
- 16,337
- Household income
- $97,768
- Rent vs Own
- Severe rent burden
- 495.0
Population outlook (Hillsborough County) Hauer SSP2
- Today (2025)
- 412,771 people
- By 2030
- 410,974 · -0.4%
- By 2040
- 399,959 · -3.1%
- By 2050
- 381,542 · -7.6%
- By 2075
- 339,855 · -17.7%
- By 2100
- 289,270 · -29.9%
Race, ethnicity, and origin ACS 2023
- Neighborhood character
- Predominantly White (88%)
- Race & ethnicity
- White 88% Two or more races 8% Hispanic / Latino 2% Asian 2%
- Common ancestry
- Lithuanian 11% Estonian 4% Slovak 3%
- Foreign-born
- 7% · Canada, China
- Languages at home
- 91% English-only · Other Indo-European 4% Spanish 1% Other Asian/Pacific 1%
Political lean MEDSL · Hillsborough
- 2024 margin
- Toss-up / Even · D 50.9% · R 48.0% · Other 1.0%
- 2008→2024 swing
- -0.9pp no change · 2008: 3.8pp · 2024: 2.9pp
- All cycles
- 2024: D+2.9 2020: D+7.7 2016: R+0.2 2012: D+1.7 2008: D+3.8
Not yet ingested
- Civics
- —
Market trends
- HPI YoY
- ▼ -111.91%
- Current HPI
- 207.1058
- Rent YoY
- —
- Metro
- Manchester-Nashua, NH
- State GDP YoY
- —
- F500 in state
- 0
Price history
+0.0% since first listed2 events — show timeline
- 2026-06-18 Listed $199,900 PrimeMLS
- 2025-11-05 Price Changed $199,900 PrimeMLS
Property tax history
+4.9%/yrLatest (2025): $2,505 · +9.5% YoY. Source: county tax records.
Cash-flow waterfall
monthlySold comps — $/sqft
last 12 mo · ≤1 miLoading sold comps…