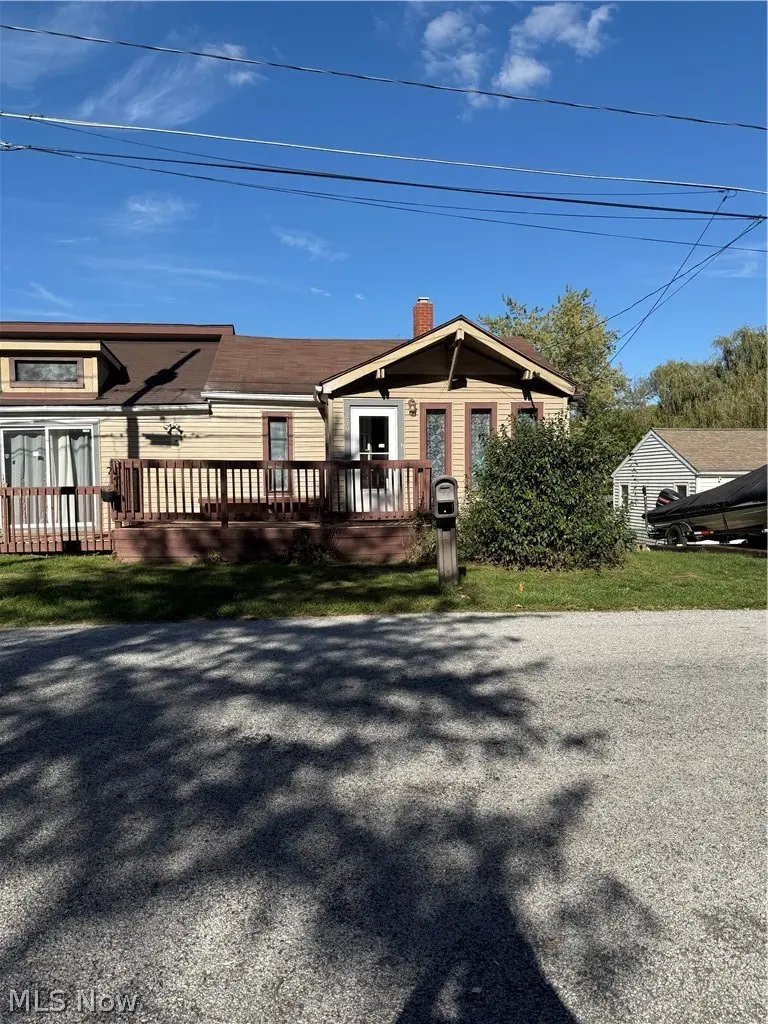
349 Canova Dr · Portage Lakes, OH
Flood risk 7/10 · Major
- FEMA flood zone
- X (unshaded)
- Chance of flooding over 30 yrs
- 0.77%
- Est. flood insurance / yr
- $473 – $860
Fire risk 1/10 · Minimal
- Est. fire insurance / yr
- $713 – $1,323
Heat risk 3/10 · Minor
- Hot days now (above 97°F)
- 7 days/yr
- Hot days in 30 yrs
- 17 days/yr
Wind risk 1/10 · Minimal
- Chance of severe wind over 30 yrs
- —
Air-quality risk 2/10 · Minimal
- Unhealthy air days now
- 1 days/yr
- Unhealthy air days in 30 yrs
- 2 days/yr
Risk factors via First Street. Map © Google.
Why this score? — see what drove the B+ grade
The composite is a weighted blend of 9 inputs, each scored 0–100. Each bar is that input's sub-score; the figure is the points it added to the 100-point composite (weight × sub-score).
- Cash flow +30.0/30.0
- ARV discount +15.0/15.0
- 1% rule +10.0/10.0
- DSCR +10.0/10.0
- Schools +5.0/10.0
- Livability +3.2/5.0
- Rent growth +2.5/5.0
- Condition / age +2.5/5.0
- Appreciation +0.0/10.0
$206,000
🖨 Deal sheet 📄 Offer letter ✓ Due diligence
Listing remarks MLS
Uniquely styled 3 bedroom 2.5 bath ranch in Coventry township. Vaulted ceilings give it a very open feeling. Master bedroom has a huge walk in closet. Large lot. Much larger than it looks. Close to Portage Lakes. Selling as is. Proof of funds with all offers. Buyer responsible for any inspections and repairs needed. VA does NOT allow contingencies and escalation clauses. VA Addendum’s are required. Seller does not pay title costs. Please note that the seller is Secretary of Veterans Affairs. Property was built prior to 1978 and lead based paint may potentially exist. “This property may qualify for seller financing”. Prior to seller receipt and approval of the full title package from foreclosure, title to the property will be conveyed by a quit claim deed.
Key facts
- Huge walk-in closet
- Ranch style home
- Cozy family room
Tags
Property features AI
Exterior
- Parking: Attached garage (1 car)
- Utilities: Public sewer; Well water
- Home design: Single-story home; Above-grade finished living area approximately 1,620; Lot approximately 0.344 acres; Facing / orientation not specified; Entry level not specified
- Construction: Aluminum siding; Asphalt/fiberglass roof; Year built from public records
- Exterior features: Deck
Interior
- Kitchen: Microwave; Range; Refrigerator
- Bedrooms: Three main-level bedrooms
- Bathrooms: Three full bathrooms; Two main-level bathrooms
- Heating & cooling: Forced air heating (gas); Central air conditioning
- Interior features: Partial basement
Neighborhood map
What this means for you Summary
Snapshot
- This is a 3-bed/3.0-bath single-family listed at $206k.
Deal economics
- At list price, monthly cash flow is $5k ($61k/yr) — positive.
- The deal already cash-flows at list — no discount required.
- Meets the 1% rule at list price ($8k rent vs $206k).
- Cap rate 36.3% vs local median 13.7% in Portage Lakes — top-decile yield for the area; either an underpriced asset or a hidden risk that comps aren't pricing in. Stress-test before assuming the spread holds.
Location & tenants
- Location reads 64/100 on livability (#772 in OH) — a middle-class / working-renter tenant base. Strengths: cost of living A+, housing A+, crime B+; Watch: employment D+, schools D-, amenities F.
- Coventry Local (suburban): math 52% / reading 64% proficiency, ranked #315 of 656 in OH (top 48%) — acceptable for families but not a draw, mixed tenant base, ~2y average lease.
- Market conditions: 90 active listings in the ZIP; 3 comparable units currently listed for rent nearby; rentals at typical pace (median 15d on market — plan ~3-4 weeks tenant-placement turnaround); 1,114 units permitted in Summit County in 2024 (397 in 5+ unit buildings).
- At $8,394/mo this rent would consume 135% of the median local household income ($75k/yr) — very limited rent-growth headroom before tenants either downsize or default.
Forward outlook
- Local home prices are declining (-3.0%/yr); year-one equity from $1k of loan paydown is wiped out by about $6k of value loss. Plan a longer hold.
- Summit County population projected to shrink 6% by 2050 — rents likely to lag national; underwrite the cash flow, not the appreciation.
- At projected returns (-3.0% appreciation + 3.0% rent growth), your $58k cash investment doubles in ~2 years — after that, you're playing with house money.
Negotiation context
- Only 4 days on market — expect competitive offers; lowballing is unlikely to land.
- 9 sale attempts since 27y ago with the ask held roughly flat each time — persistent listings suggest the price (not the market) is what's stuck; bring a comps-based counter.
- Current owner paid $83k; list at $206k implies a 149% gain — meaningful room to come down on a strong offer.
Risks & watch-outs
- Watch-outs: flood insurance adds $56/mo; built in 1945 — expect roof / HVAC / electrical / plumbing capex.
- Climate carrying-cost: major flood risk — expect insurance premiums to compound above CPI over the hold.
Questions for the listing agent
- Built in 1945 — when were the roof, HVAC, electrical panel, plumbing, and water heater last replaced?
- What's the actual annual flood-insurance premium (NFIP or private), and is the property in a SFHA with mandatory coverage?
- Is there a deadline driving the sale (1031 exchange, divorce, estate, relocation)? That informs how much negotiation room exists.
- Schools are D-rated, which usually means shorter tenancies and higher turnover. Who's the typical renter profile here, and what's been the actual vacancy rate?
- What's the average days-on-market for RENTAL listings here right now (not sales)? A rising rental-DOM trend means longer vacancies and softer asking-rent achievability than the comps imply.
- What's the recent tenant-quality profile in this submarket — average credit score on applications, eviction rate, late-payment / NSF rate, and stable-employment percentage? A property-management company in the area should have these aggregated.
- How much new for-sale + rental construction is in the pipeline within 1–3 miles? Heavy new supply typically softens prices + rents 12–24 months out; constrained supply supports both.
Investment metrics
- 1% rule
- 4.07% ✓
- Cap rate
- 36.28%
- Cash-on-cash
- 107.11%
- DSCR
- 5.77
- GRM
- 2.0
CMA / ARV
- ARV (on-the-fly)
- $294,840
- Comps found
- 12
Show comp detail 12 sales within ~0.75 mi
| Address | Dist | Beds/Ba | Sqft | Sold | Price | $/sf | Match |
|---|---|---|---|---|---|---|---|
| 541 Canova Dr | 0.30mi | 3/2.0 | 1,615 (-0%) | 12mo | $245,000 | $152 | 71 |
| 472 Saunders Ave | 0.26mi | 3/2.0 | 1,512 (-7%) | 10mo | $425,000 | $281 | 65 |
| 156 W Ingleside Dr | 0.53mi | 4/3.0 (+1) | 1,534 (-5%) | 2mo | $240,000 | $156 | 60 |
| 2976 S Main St | 0.73mi | 3/1.5 | 1,639 (+1%) | 8mo | $265,000 | $162 | 52 |
| 325 Hohman Ave | 0.39mi | 3/2.0 | 1,450 (-10%) | 12mo | $244,000 | $168 | 51 |
| 3648 Portage Point Blvd | 0.46mi | 4/2.0 (+1) | 1,543 (-5%) | 14mo | $572,000 | $371 | 50 |
| 680 Isle View Dr | 0.58mi | 3/2.5 | 1,494 (-8%) | 12mo | $750,000 | $502 | 48 |
| 3673 Ace Dr | 0.56mi | 3/1.5 | 1,482 (-8%) | 9mo | $585,000 | $395 | 46 |
| 3691 S Turkeyfoot Rd | 0.66mi | 3/2.0 | 1,517 (-6%) | 12mo | $273,500 | $180 | 44 |
| 3078 Greenhill Rd | 0.59mi | 3/2.0 | 1,450 (-10%) | 9mo | $295,000 | $203 | 44 |
| 445 W Willowview Dr | 0.61mi | 3/2.0 | 1,487 (-8%) | 13mo | $270,000 | $182 | 43 |
| 3704 S Turkeyfoot Rd | 0.69mi | 2/1.5 (-1) | 1,404 (-13%) | 8mo | $212,000 | $151 | 28 |
Match score weights: distance 35% · size 25% · config 20% · recency 20%. Top-matched comps best support the ARV.
Projected returns pro-forma
-3.0% appreciation · 3.0% rent growth · sell at horizon
- IRR
- —
- Equity multiple
- 6.05×
- Total profit
- $291,197
- Equity at exit
- $30,715
- IRR
- —
- Equity multiple
- 12.65×
- Total profit
- $672,063
- Equity at exit
- $17,811
Cash invested: $57,680 (down + closing). Projections, not guarantees.
Landlord ↔ Tenant lean methodology
- Overall (STATE)
- 73 Landlord-Friendly
- State Ohio
- 73 Landlord-Friendly · R+6
- County
- — inherits STATE
- City
- — inherits STATE
ZIP-level market 44319
- Active inventory
- 90
- Price-to-rent
- 2.0×
Monthly cashflow live
- Estimated rent
- $8,394 medium interval (Pro) →
- Mortgage (P&I)
- −$1,080
- Tax from tax record
- −$316 /mo · $3,797/yr
- Insurance
- −$86
- Flood insurance flood zone
- −$56 /mo · $666/yr
- HOA
- −$0
- Vacancy / Maint / Mgmt
- −$1,763
- Net cashflow
- $5,093
Break-even live
UW: 25.0% down · 7.5% · 30yr · 1.5% tax · 5.0% vac · 8.0% maint · 8.0% mgmt
Financing live
Cash to close
- Down payment
- $51,500
- Closing costs
- $6,180
- Reserves months
- —
- Total cash needed
- —
Loan-product check · same deal, 3 products live
Conventional
25% down · 7.5% · 30yr
- Down + closing
- —
- Monthly P&I
- —
- Monthly cashflow
- —
- DSCR
- —
- Eligible?
- —
Personal DTI + credit; lowest rate.
DSCR
20% down · 8.5% · 30yr
- Down + closing
- —
- Monthly P&I
- —
- Monthly cashflow
- —
- DSCR
- —
- Eligible?
- —
No personal income docs; deal must DSCR.
Hard money
10% down · 12.0% · 12mo
- Down + closing
- —
- Monthly P&I
- —
- Monthly cashflow
- —
- DSCR
- —
- Eligible?
- —
Short-term bridge; refi at stabilization.
Rent comps 3 comps
| Address | Beds | Baths | Sqft | Rent | $/sqft | DOM | Units | Dist |
|---|---|---|---|---|---|---|---|---|
| 3581 Mong Ave Unit 1496037P Akron, OH | 4.0 | 2.0 | 2142 | $11,111 | $5.19 | 44d | 1 | 0.37mi |
| 829 Portage Lakes Dr Unit 1496076P Akron, OH | 3.0 | 1.0 | 1356 | $7,700 | $5.68 | 14d | 1 | 0.50mi |
| 234 Mallard Point Dr Akron, OH | 1.0–2.0 | 1.0–2.0 | 945 | $1,530 | $1.62 | 14d | 18 | 0.90mi |
Listing history 4 events
-
2026-06-09statusdays on market $206,000 Pending 4 DOM
-
2026-06-08days on market $206,000 Active 3 DOM
-
2026-06-07remarks 699-char remark
-
2026-06-07$206,000 Active 2 DOM
ⓘ Source: listings_history table (triggers on properties + properties_extension) + one-shot
backfill from property_details.listing_events for pre-trigger history.
Tax reassessment forecast OH · Partial reset (capped growth)
- Current annual tax
- $3,797 · $316/mo
- Projected year-2 tax
- $3,797 · $316/mo
- Expected delta
- $0/yr ($0/mo · 0.0%)
ⓘ Screening estimate from a state-policy table — verify with the county assessor before closing.
Climate risk First Street
- Flood 7/10 Severe FEMA zone X (unshaded) · 77% chance over 30 yrs
- Wildfire 1/10 Low
- Heat 3/10 Moderate 7 d/yr ≥97°F today · 17 d/yr by 30 yrs out
- Wind 1/10 Low
- Air quality 2/10 Low 1 unhealthy d/yr today · 2 by 30 yrs out
Nearby sold comps map
Loading sold comps map…
Walkable amenities ~0.75 mi
Loading nearby amenities…
Taxation est. · year 1
- Rental income
- $100,727
- − Mortgage interest
- −$11,539
- − Property taxes
- −$3,797
- − Insurance
- −$1,696
- − Repairs & maintenance
- −$8,058
- − Management
- −$8,058
- − Depreciation
- −$5,993
- Taxable income
- $61,585
- Est. tax owed @ 24.0%
- −$14,780
- After-tax cash flow
- $46,337/yr
For passive investors: Depreciation is non-cash, so a rental often shows a tax loss while cash-flowing — sheltering income. Rental losses are passive: they offset passive income freely, and up to $25,000/yr can offset ordinary (W-2) income if you actively participate and your MAGI is under $100k (phasing out to $0 by $150k); unused losses carry forward. On sale, claimed depreciation is recaptured at up to 25%, and gains may owe capital-gains tax (a 1031 exchange can defer both). Figures are a year-1 estimate at your 24.0% rate — not tax advice; consult a CPA.
Schools (NCES district)
- District
- Coventry Local
- NCES district ID
- 3904999
- Math proficiency
- 52% ▼ -13.00%
- Reading proficiency
- 64% ▼ -2.00%
- Median HH income
- $52,981
- Composite
- 49.66/100
- National rank
- #1976
- State rank
- #315 of 656 in OH
Livability — Portage Lakes
- Score
- 64/100
- State rank
- #772
- US rank
- #14032
Category grades
Schools grade is shown separately in the Schools card above.
Census & demographics
- Census place
- Portage Lakes, OH
- County
- Summit · 539,389 people
- Metro
- Akron, OH
- Population (ZIP)
- 21,469
- Household income
- $74,781
- Rent vs Own
- Severe rent burden
- 12.4
Population outlook (Summit County) Hauer SSP2
- Today (2025)
- 546,583 people
- By 2030
- 544,028 · -0.5%
- By 2040
- 531,363 · -2.8%
- By 2050
- 514,923 · -5.8%
- By 2075
- 481,765 · -11.9%
- By 2100
- 432,265 · -20.9%
Race, ethnicity, and origin ACS 2023
- Neighborhood character
- Predominantly White (91%)
- Race & ethnicity
- White 91% Two or more races 4% Black 2% Hispanic / Latino 2% Asian 2%
- Common ancestry
- Romanian 5% Slovak 2% Serbian 1%
- Foreign-born
- 2% · China, Vietnam
- Languages at home
- 97% English-only · Other Indo-European 1% Spanish 1% Chinese 1%
Political lean MEDSL · Summit
- 2024 margin
- Lean D (+7.0) · D 53.0% · R 46.0%
- 2008→2024 swing
- -9.6pp toward R · 2008: 16.6pp · 2024: 7.0pp
- All cycles
- 2024: D+7.0 2020: D+9.6 2016: D+8.2 2012: D+14.8 2008: D+16.6
Not yet ingested
- Civics
- —
Market trends
- HPI YoY
- ▼ -236.58%
- Current HPI
- 213.2267
- Rent YoY
- —
- Metro
- —
- State GDP YoY
- ▲ 1.98%
- F500 in state
- 48
Industry mix (Fortune 500 HQ in OH)
| Industry | F500 HQs | Revenue |
|---|---|---|
| Insurance | 3 | $145B |
|
||
| Industrial Machinery | 3 | $49B |
|
||
| Financial Services | 3 | $24B |
|
||
| Consumer Goods | 2 | $93B |
|
||
| Aerospace / Defense | 2 | $47B |
|
||
| Utilities | 2 | $33B |
|
||
Price history
+692.3% since first listed25 events — show timeline
- 2026-06-04 Listed $206,000 MLSNOW
- 2025-12-16 Listing Removed — MLSNOW
- 2025-12-15 Relisted — MLSNOW
- 2025-10-14 Listed $189,500 MLSNOW
- 2019-05-16 Sold (MLS) $82,600 MLSNOW
- 2019-05-10 Pending — MLSNOW
- 2019-04-07 Contingent — MLSNOW
- 2019-03-29 Listed $82,500 MLSNOW
- 2015-08-24 Sold (MLS) $124,000 MLSNOW
- 2015-08-13 Sold (Public Records) $124,000 Public Records
- 2015-07-20 Pending — MLSNOW
- 2015-07-02 Contingent — MLSNOW
- 2015-06-24 Listed $124,000 MLSNOW
- 2007-02-15 Sold (MLS) $80,000 MLSNOW
- 2006-11-30 Listing Removed — MLSNOW
- 2006-09-02 Listed $87,900 MLSNOW
- 2003-02-14 Sold (Public Records) $103,000 Public Records
- 2000-04-17 Sold (Public Records) $98,000 Public Records
- 2000-03-23 Listing Removed — MLSNOW
- 2000-02-23 Listed $104,900 MLSNOW
- 2000-02-19 Listing Removed — MLSNOW
- 2000-01-21 Listed $119,900 MLSNOW
- 1999-10-26 Listing Removed — MLSNOW
- 1999-07-26 Listed $128,900 MLSNOW
- 1986-01-09 Sold (Public Records) $26,000 Public Records
Property tax history
+5.9%/yrLatest (2025): $3,797 · +3.3% YoY. Source: county tax records.
Cash-flow waterfall
monthlySold comps — $/sqft
last 12 mo · ≤1 miLoading sold comps…