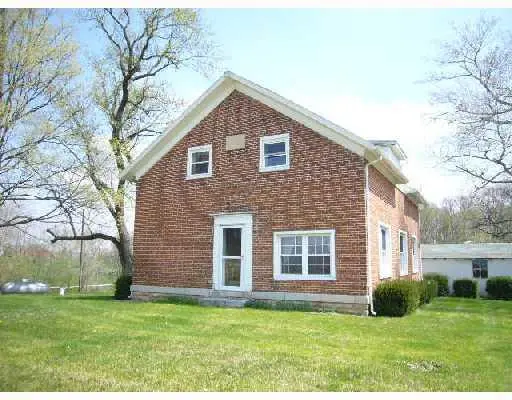
9681 N Spiker Rd · Piqua, OH
Flood risk 1/10 · Minimal
- FEMA flood zone
- X (unshaded)
- Chance of flooding over 30 yrs
- 0.0%
- Est. flood insurance / yr
- $473 – $860
Fire risk 1/10 · Minimal
- Est. fire insurance / yr
- $713 – $1,323
Heat risk 3/10 · Minor
- Hot days now (above 101°F)
- 7 days/yr
- Hot days in 30 yrs
- 17 days/yr
Wind risk 2/10 · Minimal
- Chance of severe wind over 30 yrs
- —
Air-quality risk 2/10 · Minimal
- Unhealthy air days now
- 1 days/yr
- Unhealthy air days in 30 yrs
- 3 days/yr
Risk factors via First Street. Map © Google.
Why this score? — see what drove the D grade
The composite is a weighted blend of 9 inputs, each scored 0–100. Each bar is that input's sub-score; the figure is the points it added to the 100-point composite (weight × sub-score).
- Cash flow +14.8/30.0
- ARV discount +7.5/15.0
- DSCR +4.5/10.0
- 1% rule +4.3/10.0
- Schools +4.0/10.0
- Livability +3.1/5.0
- Rent growth +2.5/5.0
- Condition / age +2.5/5.0
- Appreciation +0.0/10.0
$184,900
🖨 Deal sheet (PDF) 📄 Offer letter ✓ Due diligence
Listing remarks MLS
Eligible under Freddie Mac First Look Initiative ''good through 6/14/2026'' where only owner-occupant & approved public entity buyers are eligible to purchase. On the 30th day, all buyers will be eligible to purchase. Property must be in MLS for a minimum of 72 hours before any offer can be considered. Offers can be emailed to [email protected] or dotlooped to the same email address. Read the attached doc, print & forward w/all offers. Seller addendum required. Info believed accurate, not warranted. Rely on your own inspections.
Key facts
- 0.95 acre lot
- Garage
- Built 1886
Property features AI
Finance
- Financial info: Offered for sale
Exterior
- Parking: Detached one-car garage
- Utilities: Well water; Septic system; Utilities available
- Home design: Two-story brick home
- Construction: Brick construction
- Exterior features: Nearly one-acre residential lot; Residential zoning
Interior
- Kitchen: Kitchen on the main level measuring 14 x 11
- Bedrooms: One bedroom on the second level measuring 25 x 13; One bedroom on the second level measuring 11 x 11; Two bedrooms on the second level each measuring 13 x 8
- Bathrooms: One full bathroom (main level)
- Heating & cooling: Baseboard heating; Central air conditioning
- Interior features: Partial, unfinished basement; Office on the main level; Dining room on the main level; Living room on the main level
Neighborhood map
What this means for you Summary
Snapshot
- This is a 4-bed/1.0-bath single-family listed at $185k.
Deal economics
- At list price, monthly cash flow is $51 ($608/yr) — positive.
- The deal already cash-flows at list — no discount required.
- To meet the 1% rule (rent ≥ 1% of price), the offer needs to be $172k (6.7% below list).
- Recommended offer: $172k (6.7% below list) — sets the bar for 1% rule.
- Cap rate 6.6% vs local median 4.7% in Piqua — top-decile yield for the area; either an underpriced asset or a hidden risk that comps aren't pricing in. Stress-test before assuming the spread holds.
Location & tenants
- Location reads 62/100 on livability (#887 in OH) — a middle-class / working-renter tenant base. Strengths: cost of living A+, housing A+; Watch: employment D+, crime F, amenities F.
- Piqua City (rural): math 45% / reading 50% proficiency, ranked #482 of 656 in OH (top 74%) — families likely to look elsewhere, expect single-tenant / working-renter base with shorter leases.
- Zoned schools: Piqua High School (math 12% / reading 57%, grade F, #582 of 781 statewide, top 76%, 876 students, 52% FRL) — zoned schools at 52% FRL track the district average.
- Zoned-school proficiency averages 34% at this address vs 48% district-wide (-13 pts) — the specific schools serving this property underperform the Piqua City average; the district grade overstates school quality for this exact location.
- Market conditions: 139 active listings in the ZIP; 326 units permitted in Miami County in 2024 (0 in 5+ unit buildings).
Forward outlook
- Local home prices are declining (-3.0%/yr); year-one equity from $1k of loan paydown is wiped out by about $6k of value loss. Plan a longer hold.
Negotiation context
- Only 11 days on market — expect competitive offers; lowballing is unlikely to land.
- 6 sale attempts since 18y ago with the ask held roughly flat each time — persistent listings suggest the price (not the market) is what's stuck; bring a comps-based counter.
- Current owner paid $150k; 23% above their basis — modest negotiation headroom, anchor on the comps not their cost.
Risks & watch-outs
- Watch-outs: built in 1886 — expect roof / HVAC / electrical / plumbing capex.
Questions for the listing agent
- Built in 1886 — when were the roof, HVAC, electrical panel, plumbing, and water heater last replaced?
- Is there a deadline driving the sale (1031 exchange, divorce, estate, relocation)? That informs how much negotiation room exists.
- Crime grade is F in this area — have there been break-ins, vandalism, or insurance claims at this property in the last 3 years? What carrier currently insures it and at what premium?
- The area grade is low — what's the realistic commute time and amenity access for the typical tenant pool here? Any planned neighborhood developments (good or bad) we should know about?
- What's the average days-on-market for RENTAL listings here right now (not sales)? A rising rental-DOM trend means longer vacancies and softer asking-rent achievability than the comps imply.
- What's the recent tenant-quality profile in this submarket — average credit score on applications, eviction rate, late-payment / NSF rate, and stable-employment percentage? A property-management company in the area should have these aggregated.
- How much new for-sale + rental construction is in the pipeline within 1–3 miles? Heavy new supply typically softens prices + rents 12–24 months out; constrained supply supports both.
Investment metrics
- 1% rule
- 0.93% ✗
- Cap rate
- 6.62%
- Cash-on-cash
- 1.17%
- DSCR
- 1.05
- GRM
- 8.9
CMA / ARV
No comps found within radius.
Projected returns pro-forma
-3.0% appreciation · 3.0% rent growth · sell at horizon
- IRR
- -14.4%
- Equity multiple
- 0.48×
- Total profit
- $-26,688
- Equity at exit
- $27,569
- IRR
- -5.6%
- Equity multiple
- 0.64×
- Total profit
- $-18,894
- Equity at exit
- $15,987
Cash invested: $51,772 (down + closing). Projections, not guarantees.
Landlord ↔ Tenant lean methodology
- Overall (STATE)
- 73 Landlord-Friendly
- State Ohio
- 73 Landlord-Friendly · R+6
- County
- — inherits STATE
- City
- — inherits STATE
ZIP-level market 45356
- Active inventory
- 139
- Price-to-rent
- 8.9×
Monthly cashflow live
- Estimated rent
- $1,725 medium interval (Pro) →
- Mortgage (P&I)
- −$970
- Tax from tax record
- −$265 /mo · $3,183/yr
- Insurance
- −$77
- HOA
- −$0
- Vacancy / Maint / Mgmt
- −$362
- Net cashflow
- $51
Break-even live
Sensitivity live
| Price | -10% $155 | -5% $103 | +0% $51 | +5% $-2 | +10% $-54 |
|---|---|---|---|---|---|
| Rent | -10% $-86 | -5% $-17 | +0% $51 | +5% $119 | +10% $187 |
| Rate | -1.0pp $144 | -0.5pp $98 | base $51 | +0.5pp $3 | +1.0pp $-46 |
UW: 25.0% down · 7.5% · 30yr · 1.5% tax · 5.0% vac · 8.0% maint · 8.0% mgmt
Financing live
Cash to close
- Down payment
- $46,225
- Closing costs
- $5,547
- Reserves months
- —
- Total cash needed
- —
Loan-product check · same deal, 3 products live
Conventional
25% down · 7.5% · 30yr
- Down + closing
- —
- Monthly P&I
- —
- Monthly cashflow
- —
- DSCR
- —
- Eligible?
- —
Personal DTI + credit; lowest rate.
DSCR
20% down · 8.5% · 30yr
- Down + closing
- —
- Monthly P&I
- —
- Monthly cashflow
- —
- DSCR
- —
- Eligible?
- —
No personal income docs; deal must DSCR.
Hard money
10% down · 12.0% · 12mo
- Down + closing
- —
- Monthly P&I
- —
- Monthly cashflow
- —
- DSCR
- —
- Eligible?
- —
Short-term bridge; refi at stabilization.
Listing history 11 events
-
2026-06-21days on market $184,900 Active 11 DOM
-
2026-06-18days on market $184,900 Active 8 DOM
-
2026-06-17days on market $184,900 Active 7 DOM
-
2026-06-16status $184,900 Active 6 DOM
-
2026-06-13status $184,900 Pending 6 DOM
-
2026-06-10days on market $184,900 Active 6 DOM
-
2026-06-09days on market $184,900 Active 5 DOM
-
2026-06-08days on market $184,900 Active 4 DOM
-
2026-06-07days on market $184,900 Active 3 DOM
-
2026-06-05remarks 133-char remark
-
2026-06-05$184,900 Active 1 DOM
ⓘ Source: listings_history table (triggers on properties + properties_extension) + one-shot
backfill from property_details.listing_events for pre-trigger history.
Tax reassessment forecast OH · Partial reset (capped growth)
- Current annual tax
- $3,183 · $265/mo
- Projected year-2 tax
- $3,183 · $265/mo
- Expected delta
- $0/yr ($0/mo · 0.0%)
ⓘ Screening estimate from a state-policy table — verify with the county assessor before closing.
Climate risk First Street
- Flood 1/10 Low FEMA zone X (unshaded) · 0% chance over 30 yrs
- Wildfire 1/10 Low
- Heat 3/10 Moderate 7 d/yr ≥101°F today · 17 d/yr by 30 yrs out
- Wind 2/10 Low
- Air quality 2/10 Low 1 unhealthy d/yr today · 3 by 30 yrs out
Nearby sold comps map
Loading sold comps map…
Walkable amenities ~0.75 mi
Loading nearby amenities…
Taxation est. · year 1
- Rental income
- $20,697
- − Mortgage interest
- −$10,357
- − Property taxes
- −$3,183
- − Insurance
- −$924
- − Repairs & maintenance
- −$1,656
- − Management
- −$1,656
- − Depreciation
- −$5,379
- Taxable loss
- −$2,458
- Est. tax savings @ 24.0%
- +$590
- After-tax cash flow
- $1,198/yr
For passive investors: Depreciation is non-cash, so a rental often shows a tax loss while cash-flowing — sheltering income. Rental losses are passive: they offset passive income freely, and up to $25,000/yr can offset ordinary (W-2) income if you actively participate and your MAGI is under $100k (phasing out to $0 by $150k); unused losses carry forward. On sale, claimed depreciation is recaptured at up to 25%, and gains may owe capital-gains tax (a 1031 exchange can defer both). Figures are a year-1 estimate at your 24.0% rate — not tax advice; consult a CPA.
Schools (NCES district)
- District
- Piqua City
- NCES district ID
- 3904464
- Math proficiency
- 45% ▼ -11.00%
- Reading proficiency
- 50% ▼ -7.00%
- Median HH income
- $41,751
- Composite
- 39.91/100
- National rank
- #3855
- State rank
- #482 of 656 in OH
Livability — Piqua
- Score
- 62/100
- State rank
- #887
- US rank
- #16830
Category grades
Schools grade is shown separately in the Schools card above.
Census & demographics
- County
- Miami County · 85,667 people
- City population
- 25,237
- Metro
- Dayton-Kettering, OH
- Population (ZIP)
- 25,237
- Household income
- $69,188
- Rent vs Own
- Severe rent burden
- 748.0
Population outlook (Miami County) Hauer SSP2
- Today (2025)
- 107,816 people
- By 2030
- 108,896 · +1.0%
- By 2040
- 109,581 · +1.6%
- By 2050
- 108,110 · +0.3%
- By 2075
- 101,523 · -5.8%
- By 2100
- 85,787 · -20.4%
Race, ethnicity, and origin ACS 2023
- Neighborhood character
- Predominantly White (92%)
- Race & ethnicity
- White 92% Two or more races 3% Black 2% Hispanic / Latino 1%
- Common ancestry
- Iranian 2% Italian 2% Lithuanian 2%
- Foreign-born
- 1%
- Languages at home
- 99% English-only · Spanish 1% Vietnamese 0%
Political lean MEDSL · Miami
- 2024 margin
- Solid R (+45.1) · D 27.0% · R 72.1%
- 2008→2024 swing
- -16.6pp toward R · 2008: -28.5pp · 2024: -45.1pp
- All cycles
- 2024: R+45.1 2020: R+44.3 2016: R+45.6 2012: R+35.6 2008: R+28.5
Not yet ingested
- Civics
- —
Market trends
- HPI YoY
- ▼ -137.96%
- Current HPI
- 251.435
- Rent YoY
- —
- Metro
- Dayton-Kettering, OH
- State GDP YoY
- ▲ 1.98%
- F500 in state
- 48
Industry mix (Fortune 500 HQ in OH)
| Industry | F500 HQs | Revenue |
|---|---|---|
| Insurance | 3 | $145B |
|
||
| Industrial Machinery | 3 | $49B |
|
||
| Financial Services | 3 | $24B |
|
||
| Consumer Goods | 2 | $93B |
|
||
| Aerospace / Defense | 2 | $47B |
|
||
| Utilities | 2 | $33B |
|
||
Price history
+302.0% since first listed19 events — show timeline
- 2026-06-04 Listed $184,900 Dayton MLS
- 2026-06-04 Listed $184,900 WRIST
- 2019-11-04 Sold (Public Records) $150,000 Public Records
- 2019-11-03 Sold (MLS) $150,000 Dayton MLS
- 2019-11-03 Sold (MLS) $150,000 Dayton MLS
- 2019-11-01 Sold (MLS) $150,000 WRIST
- 2019-10-02 Pending — Dayton MLS
- 2019-08-18 Relisted — Dayton MLS
- 2019-08-17 Contingent — Dayton MLS
- 2019-08-05 Price Changed $149,000 Dayton MLS
- 2019-07-09 Price Changed $159,000 Dayton MLS
- 2019-06-25 Price Changed $169,000 Dayton MLS
- 2019-06-25 Price Changed $169,900 Dayton MLS
- 2019-05-28 Listed $149,000 WRIST
- 2019-05-28 Listed $179,000 Dayton MLS
- 2009-01-27 Sold (MLS) $51,150 WRIST
- 2008-09-30 Listed $57,500 WRIST
- 1993-09-14 Sold (Public Records) $79,000 Public Records
- 1987-03-02 Sold (Public Records) $46,000 Public Records
Property tax history
+12.7%/yrLatest (2025): $3,183 · +23.1% YoY. Source: county tax records.
Cash-flow waterfall
monthlySold comps — $/sqft
last 12 mo · ≤1 miLoading sold comps…