 🔨 Auction
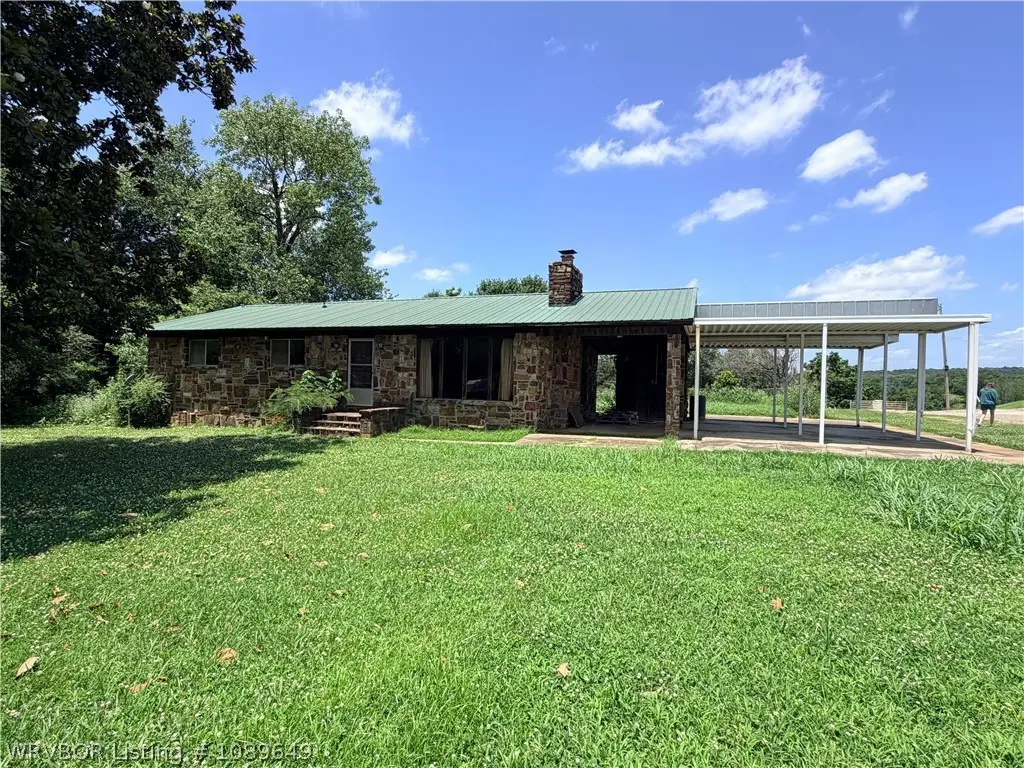
203 N Stacy St · Gans, OK
Flood risk No data
- FEMA flood zone
- —
- Chance of flooding over 30 yrs
- —
- Est. flood insurance / yr
- —
Fire risk No data
- Est. fire insurance / yr
- —
Heat risk No data
- Hot days now (above threshold)
- —
- Hot days in 30 yrs
- —
Wind risk No data
- Chance of severe wind over 30 yrs
- —
Air-quality risk No data
- Unhealthy air days now
- —
- Unhealthy air days in 30 yrs
- —
Risk factors via First Street. Map © Google.
Why this score? — see what drove the F grade
The composite is a weighted blend of 9 inputs, each scored 0–100. Each bar is that input's sub-score; the figure is the points it added to the 100-point composite (weight × sub-score).
- Appreciation +10.0/10.0
- ARV discount +7.5/15.0
- Cash flow +5.3/30.0
- Livability +3.3/5.0
- Rent growth +2.5/5.0
- Condition / age +2.5/5.0
- Schools +2.2/10.0
- 1% rule +0.9/10.0
- DSCR +0.0/10.0
$1
🖨 Deal sheet 📄 Offer letter ✓ Due diligence
Listing remarks
Auction – July 2, 2026 at 10:00 AM | 203 N Stacy Ave, Gans, OK Great opportunity for investors, flippers, landlords, or buyers looking to build equity. This 3-bedroom, 2-bath home located at 203 Stacy Avenue in Gans, Oklahoma was built in 1977 and offers plenty of potential for renovation, rental income, or a primary residence. Situated on a corner city lot with convenient access to local amenities, this property provides a solid foundation for your next investment project. Whether you're looking to update and resell, add to your rental portfolio, or create an affordable home of your own, this property presents an excellent opportunity to purchase real estate at auction. Properties
Key facts
- 0.3 acre lot
- Built 1977
- Listed 8 days
Property features AI
Finance
- Other: Residential single-family property
Exterior
- Parking: Attached carport; Gravel parking; 1 covered parking space
- Utilities: Electricity available
- Home design: Single-family house; One story; Irregular lot shape; Faces unspecified direction
- Construction: Stone construction; Metal roof
- Exterior features: Front porch; Back yard fenced; Cleared lot; County road frontage; Paved road access
Interior
- Flooring: Carpet
- Bathrooms: 1 full bathroom
- Heating & cooling: Electric heating; Electric cooling
- Interior features: Electric water heater; Fireplace in the living room
- Laundry & utility: Electric dryer hookup
Neighborhood map
What this means for you Summary
Snapshot
- This is a 3-bed/1.0-bath single-family listed at $1.
Deal economics
- At list price, monthly cash flow is $-415 ($-5k/yr) — negative.
- The deal already cash-flows at list — no discount required.
- Meets the 1% rule at list price ($1k rent vs $1).
Location & tenants
- Location reads 66/100 on livability (#105 in OK) — a middle-class / working-renter tenant base. Strengths: crime A+, cost of living A+, housing A+; Watch: amenities F, commute F, employment F.
- Gans (rural): math 20% / reading 25% proficiency, ranked #379 of 513 in OK (top 74%) — low school quality limits family demand, transient renter base, plan for 1-2y turnover; 69% free/reduced lunch — lower-income household profile, screen leases tightly.
- Zoned schools: Gans Es (math 17% / reading 22%, grade F, #479 of 845 statewide, top 63%, 239 students, 0% FRL); Gans Hs (math 10% / reading 10%, grade F, #361 of 447 statewide, top 94%, 107 students, 0% FRL) — zoned schools average 0% FRL vs 69% district-wide (69 pts lower); this property's tenant base skews higher-income than the district average.
- Market conditions: 11 active listings in the ZIP; 125 units permitted in Sequoyah County in 2024 (0 in 5+ unit buildings).
Forward outlook
- In year one you build about $20k of equity ($1k loan paydown + $19k appreciation (10.0% local appreciation)).
- Sequoyah County population projected at -16% by 2050 — secular population decline; favor cash flow + early exit over multi-decade hold.
- By year 2, paydown + projected appreciation supports a ~$32k cash-out refi (75% LTV) — recoverable capital for the next deal without selling this one.
Negotiation context
- Only 8 days on market — expect competitive offers; lowballing is unlikely to land.
Risks & watch-outs
- Watch-outs: property tax is 279450.0% of price.
Questions for the listing agent
- What do current leases actually rent for vs. the listed asking? Can we see a recent rent roll and the last 12 months of T-12 income?
- Built in 1977 — when were the roof, HVAC, electrical panel, plumbing, and water heater last replaced?
- Property tax is high relative to price — has the assessment been appealed recently, and will the sale trigger a re-assessment?
- Is there a deadline driving the sale (1031 exchange, divorce, estate, relocation)? That informs how much negotiation room exists.
- Schools are F-rated, which usually means shorter tenancies and higher turnover. Who's the typical renter profile here, and what's been the actual vacancy rate?
- The area grade is low — what's the realistic commute time and amenity access for the typical tenant pool here? Any planned neighborhood developments (good or bad) we should know about?
- What's the average days-on-market for RENTAL listings here right now (not sales)? A rising rental-DOM trend means longer vacancies and softer asking-rent achievability than the comps imply.
- What's the recent tenant-quality profile in this submarket — average credit score on applications, eviction rate, late-payment / NSF rate, and stable-employment percentage? A property-management company in the area should have these aggregated.
- How much new for-sale + rental construction is in the pipeline within 1–3 miles? Heavy new supply typically softens prices + rents 12–24 months out; constrained supply supports both.
Investment metrics
- 1% rule
- 0.59% ✗
- Cap rate
- 3.62%
- Cash-on-cash
- -9.54%
- DSCR
- 0.58
- GRM
- 14.1
CMA / ARV
- ARV (on-the-fly)
- $186,300
- Comps found
- 1
Show comp detail 1 sale within ~0.75 mi
| Address | Dist | Beds/Ba | Sqft | Sold | Price | $/sf | Match |
|---|---|---|---|---|---|---|---|
| 307 Cherokee St | 0.29mi | 3/1.0 | 1,136 (-8%) | 14mo | $170,000 | $150 | 61 |
Match score weights: distance 35% · size 25% · config 20% · recency 20%. Top-matched comps best support the ARV.
Projected returns pro-forma
10.0% appreciation · 3.0% rent growth · sell at horizon
- IRR
- 17.6%
- Equity multiple
- 2.44×
- Total profit
- $75,067
- Equity at exit
- $167,834
- IRR
- 16.5%
- Equity multiple
- 5.64×
- Total profit
- $241,865
- Equity at exit
- $361,940
Cash invested: $52,164 (down + closing). Projections, not guarantees.
Landlord ↔ Tenant lean methodology
- Overall (STATE)
- 83 Strongly Landlord-Friendly
- State Oklahoma
- 83 Strongly Landlord-Friendly · R+20
- County
- — inherits STATE
- City
- — inherits STATE
ZIP-level market 74936
- Home prices YoY
- 3.7%
- Active inventory
- 11
Monthly cashflow live
- Estimated rent
- $1,105 medium interval (Pro) →
- Mortgage (P&I)
- −$977
- Tax est. 1.5%
- −$233 /mo · $2,794/yr
- Insurance
- −$78
- HOA
- −$0
- Vacancy / Maint / Mgmt
- −$232
- Net cashflow
- $-415
Break-even live
UW: 25.0% down · 7.5% · 30yr · 1.5% tax · 5.0% vac · 8.0% maint · 8.0% mgmt
Financing live
Cash to close
- Down payment
- $46,575
- Closing costs
- $5,589
- Reserves months
- —
- Total cash needed
- —
Loan-product check · same deal, 3 products live
Conventional
25% down · 7.5% · 30yr
- Down + closing
- —
- Monthly P&I
- —
- Monthly cashflow
- —
- DSCR
- —
- Eligible?
- —
Personal DTI + credit; lowest rate.
DSCR
20% down · 8.5% · 30yr
- Down + closing
- —
- Monthly P&I
- —
- Monthly cashflow
- —
- DSCR
- —
- Eligible?
- —
No personal income docs; deal must DSCR.
Hard money
10% down · 12.0% · 12mo
- Down + closing
- —
- Monthly P&I
- —
- Monthly cashflow
- —
- DSCR
- —
- Eligible?
- —
Short-term bridge; refi at stabilization.
Listing history 7 events
-
2026-06-18days on market $1 Active 8 DOM
-
2026-06-17days on market $1 Active 7 DOM
-
2026-06-16days on market $1 Active 6 DOM
-
2026-06-15days on market $1 Active 5 DOM
-
2026-06-13days on market $1 Active 3 DOM
-
2026-06-12remarks 693-char remark
-
2026-06-12$1 Active 2 DOM
ⓘ Source: listings_history table (triggers on properties + properties_extension) + one-shot
backfill from property_details.listing_events for pre-trigger history.
Nearby sold comps map
Loading sold comps map…
Walkable amenities ~0.75 mi
Loading nearby amenities…
Taxation est. · year 1
- Rental income
- $13,257
- − Mortgage interest
- −$10,436
- − Property taxes
- −$2,794
- − Insurance
- −$932
- − Repairs & maintenance
- −$1,061
- − Management
- −$1,061
- − Depreciation
- −$5,420
- Taxable loss
- −$8,445
- Est. tax savings @ 24.0%
- +$2,027
- After-tax cash flow
- $-2,950/yr
For passive investors: Depreciation is non-cash, so a rental often shows a tax loss while cash-flowing — sheltering income. Rental losses are passive: they offset passive income freely, and up to $25,000/yr can offset ordinary (W-2) income if you actively participate and your MAGI is under $100k (phasing out to $0 by $150k); unused losses carry forward. On sale, claimed depreciation is recaptured at up to 25%, and gains may owe capital-gains tax (a 1031 exchange can defer both). Figures are a year-1 estimate at your 24.0% rate — not tax advice; consult a CPA.
Schools (NCES district)
- District
- Gans
- NCES district ID
- 4012390
- Math proficiency
- 20% ▲ 5.00%
- Reading proficiency
- 25% ▬ 0.00%
- Median HH income
- $39,614
- Composite
- 22.13/100
- National rank
- #13526
- State rank
- #379 of 513 in OK
Livability — Gans
- Score
- 66/100
- State rank
- #105
- US rank
- #11429
Category grades
Schools grade is shown separately in the Schools card above.
Census & demographics
- Census place
- Gans, OK
- Population (ZIP)
- 1,338
Population outlook (Sequoyah County) Hauer SSP2
- Today (2025)
- 39,398 people
- By 2030
- 38,215 · -3.0%
- By 2040
- 35,625 · -9.6%
- By 2050
- 32,943 · -16.4%
- By 2075
- 27,805 · -29.4%
- By 2100
- 23,311 · -40.8%
Race, ethnicity, and origin ACS 2023
- Neighborhood character
- Diverse neighborhood (Simpson 0.66)
- Race & ethnicity
- White 58% Native American 24% Two or more races 13% Hispanic / Latino 4% Black 2%
- Common ancestry
- Serbian 1% Iranian 1% Lithuanian 1%
- Foreign-born
- 1% · Canada
- Languages at home
- 96% English-only · Spanish 4% Other Asian/Pacific 1%
Political lean MEDSL · Sequoyah
- 2024 margin
- Solid R (+61.5) · D 18.6% · R 80.2% · Other 1.2%
- 2008→2024 swing
- -25.5pp toward R · 2008: -36.0pp · 2024: -61.5pp
- All cycles
- 2024: R+61.5 2020: R+59.0 2016: R+54.2 2012: R+39.1 2008: R+36.0
Not yet ingested
- Civics
- —
Market trends
- HPI YoY
- ▲ 11.24%
- Current HPI
- 315.2615
- Rent YoY
- —
- Metro
- —
- State GDP YoY
- ▲ 1.55%
- F500 in state
- 6
Industry mix (Fortune 500 HQ in OK)
| Industry | F500 HQs | Revenue |
|---|---|---|
| Energy | 3 | $48B |
|
||
Cash-flow waterfall
monthlySold comps — $/sqft
last 12 mo · ≤1 miLoading sold comps…