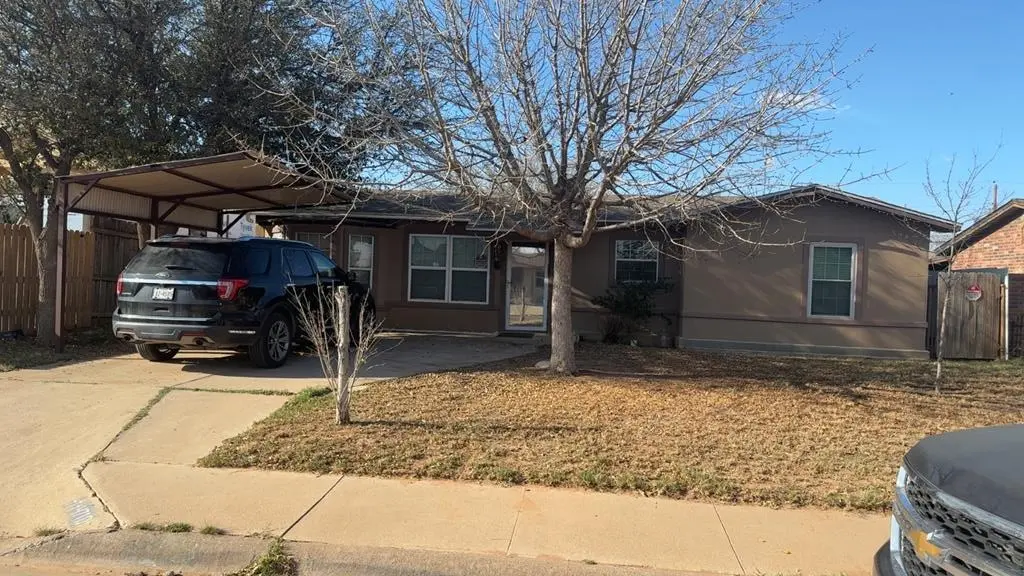
4710 Cherokee Dr · Midland, TX
Flood risk 1/10 · Minimal
- FEMA flood zone
- X
- Chance of flooding over 30 yrs
- 0.0%
- Est. flood insurance / yr
- $507 – $1,088
Fire risk 8/10 · Major
- Est. fire insurance / yr
- $1,222 – $2,270
Heat risk 6/10 · Moderate
- Hot days now (above 102°F)
- 7 days/yr
- Hot days in 30 yrs
- 20 days/yr
Wind risk 2/10 · Minimal
- Chance of severe wind over 30 yrs
- 4.0%
Air-quality risk 1/10 · Minimal
- Unhealthy air days now
- 0 days/yr
- Unhealthy air days in 30 yrs
- 0 days/yr
Risk factors via First Street. Map © Google.
Why this score? — see what drove the C+ grade
The composite is a weighted blend of 9 inputs, each scored 0–100. Each bar is that input's sub-score; the figure is the points it added to the 100-point composite (weight × sub-score).
- Cash flow +27.6/30.0
- DSCR +9.7/10.0
- 1% rule +7.1/10.0
- ARV discount +6.7/15.0
- Livability +4.0/5.0
- Schools +3.2/10.0
- Condition / age +2.5/5.0
- Rent growth +2.4/5.0
- Appreciation +0.0/10.0
$160,000
🖨 Deal sheet 📄 Offer letter ✓ Due diligence
Listing remarks MLS
Great diamond in the rough !!! 3 bedroom 1 bath will look at offers home to be sold as is !! has great 2 car garage 2 storage buildings nice location.
Key facts
- 7,405 sq ft lot
- 2 garage spots
- Built 1959
Neighborhood map
What this means for you Summary
Snapshot
- This is a 3-bed/1.0-bath single-family listed at $160k.
Deal economics
- At list price, monthly cash flow is $477 ($6k/yr) — positive.
- The deal already cash-flows at list — no discount required.
- Meets the 1% rule at list price ($2k rent vs $160k).
- Recommended offer: $146k (9.0% below list) — sets the bar for market timing.
- Cap rate 9.9% vs local median 4.7% in Midland — top-decile yield for the area; either an underpriced asset or a hidden risk that comps aren't pricing in. Stress-test before assuming the spread holds.
Location & tenants
- Location reads 79/100 on livability (#57 in TX, #2,192 nationally) — a middle-class / working-renter tenant base. Strengths: employment A+, housing A+, health & safety A+; Watch: schools C-, crime C-, commute D+.
- Midland ISD (urban): math 34% / reading 36% proficiency, ranked #477 of 826 in TX (top 58%) — families likely to look elsewhere, expect single-tenant / working-renter base with shorter leases.
- Market conditions: Rents soft (-0.3%/yr); 64 active listings in the ZIP; 24 comparable units currently listed for rent nearby; rentals at typical pace (median 21d on market — plan ~3-4 weeks tenant-placement turnaround); solid renter incomes; 1,504 units permitted in Midland County in 2024 (0 in 5+ unit buildings).
- This rent runs 30% of the median local income ($77k/yr) — at the standard rent-burdened threshold; future hikes will face affordability resistance.
Forward outlook
- Local home prices are declining (-3.0%/yr); year-one equity from $1k of loan paydown is wiped out by about $5k of value loss. Plan a longer hold.
- Midland County population projected at +83% by 2050 — long-run rental-demand tailwind backs the buy-and-hold thesis.
Negotiation context
- It's been on market 99 days — a 9% lower offer ($146k) is reasonable based on typical stale-listing flexibility.
- 2 sale attempts with the ask held roughly flat each time — persistent listings suggest the price (not the market) is what's stuck; bring a comps-based counter.
Risks & watch-outs
- Watch-outs: built in 1959 — expect roof / HVAC / electrical / plumbing capex.
- Climate carrying-cost: severe wildfire risk; extreme-heat days projected 7→20/yr by 2055 (HVAC capex compounding) — expect insurance premiums to compound above CPI over the hold.
Questions for the listing agent
- It's been on market 99 days. Have you received any prior offers? Is the seller open to a 9% concession, seller financing, or rate buy-down credit?
- Built in 1959 — when were the roof, HVAC, electrical panel, plumbing, and water heater last replaced?
- Why hasn't it sold? Are there any deal-killer items the seller is aware of (foundation, flood, title, zoning, code violations)?
- Is there a deadline driving the sale (1031 exchange, divorce, estate, relocation)? That informs how much negotiation room exists.
- What's the average days-on-market for RENTAL listings here right now (not sales)? A rising rental-DOM trend means longer vacancies and softer asking-rent achievability than the comps imply.
- What's the recent tenant-quality profile in this submarket — average credit score on applications, eviction rate, late-payment / NSF rate, and stable-employment percentage? A property-management company in the area should have these aggregated.
- How much new for-sale + rental construction is in the pipeline within 1–3 miles? Heavy new supply typically softens prices + rents 12–24 months out; constrained supply supports both.
Investment metrics
- 1% rule
- 1.21% ✓
- Cap rate
- 9.87%
- Cash-on-cash
- 12.79%
- DSCR
- 1.57
- GRM
- 6.9
CMA / ARV
- ARV (median comp)
- $157,087
- List price
- $160,000
- Delta
- 1.85%
- Verdict
- FAIR
- Comps
- 3 within 1.0 mi
Show comp detail 2 sales within ~0.75 mi
| Address | Dist | Beds/Ba | Sqft | Sold | Price | $/sf | Match |
|---|---|---|---|---|---|---|---|
| 4626 Wilshire Dr | 0.57mi | 3/2.0 | 1,166 (+3%) | 8mo | $160,000 | $137 | 58 |
| 4210 Pleasant Dr | 0.60mi | 3/1.0 | 1,259 (+11%) | 15mo | $160,000 | $127 | 41 |
Match score weights: distance 35% · size 25% · config 20% · recency 20%. Top-matched comps best support the ARV.
Projected returns pro-forma
-3.0% appreciation · 0.0% rent growth · sell at horizon
- IRR
- -0.7%
- Equity multiple
- 0.97×
- Total profit
- $-1,204
- Equity at exit
- $23,857
- IRR
- 5.6%
- Equity multiple
- 1.36×
- Total profit
- $16,156
- Equity at exit
- $13,834
Cash invested: $44,800 (down + closing). Projections, not guarantees.
Landlord ↔ Tenant lean methodology
- Overall (STATE)
- 87 Strongly Landlord-Friendly
- State Texas
- 87 Strongly Landlord-Friendly · R+5
- County
- — inherits STATE
- City
- — inherits STATE
ZIP-level market 79703
- Rents YoY
- -0.3%
- Active inventory
- 64
- Price-to-rent
- 6.9×
Monthly cashflow live
- Estimated rent
- $1,936 high interval (Pro) →
- Mortgage (P&I)
- −$839
- Tax from tax record
- −$146 /mo · $1,756/yr
- Insurance
- −$67
- HOA
- −$0
- Vacancy / Maint / Mgmt
- −$407
- Net cashflow
- $477
Break-even live
UW: 25.0% down · 7.5% · 30yr · 1.5% tax · 5.0% vac · 8.0% maint · 8.0% mgmt
Financing live
Cash to close
- Down payment
- $40,000
- Closing costs
- $4,800
- Reserves months
- —
- Total cash needed
- —
Loan-product check · same deal, 3 products live
Conventional
25% down · 7.5% · 30yr
- Down + closing
- —
- Monthly P&I
- —
- Monthly cashflow
- —
- DSCR
- —
- Eligible?
- —
Personal DTI + credit; lowest rate.
DSCR
20% down · 8.5% · 30yr
- Down + closing
- —
- Monthly P&I
- —
- Monthly cashflow
- —
- DSCR
- —
- Eligible?
- —
No personal income docs; deal must DSCR.
Hard money
10% down · 12.0% · 12mo
- Down + closing
- —
- Monthly P&I
- —
- Monthly cashflow
- —
- DSCR
- —
- Eligible?
- —
Short-term bridge; refi at stabilization.
Rent comps 24 comps
| Address | Beds | Baths | Sqft | Rent | $/sqft | DOM | Units | Dist |
|---|---|---|---|---|---|---|---|---|
| 5109 Graceland Dr Unit A Midland, TX | 3.0 | 2.0 | 1365 | $2,250 | $1.65 | 43d | 1 | 0.53mi |
| 3712 Amelia Dr Midland, TX | 3.0 | 1.0 | 1046 | $2,000 | $1.91 | 21d | 1 | 0.98mi |
| 4409 Roosevelt Dr Midland, TX | 3.0 | 2.0 | 1230 | $1,750 | $1.42 | 44d | 1 | 0.99mi |
| 1811 Tradewinds Blvd Midland, TX | 1.0–3.0 | 1.0–2.0 | 1013 | $1,617 | $1.60 | 43d | 1 | 1.00mi |
| 117 N Glenwood Dr Unit D Midland, TX | 2.0 | 2.0 | 1000 | $1,795 | $1.79 | 21d | 1 | 1.03mi |
| 4707 Shadylane Dr Unit B Midland, TX | 2.0 | 1.0 | 960 | $1,400 | $1.46 | 13d | 1 | 1.05mi |
| 123 N Glenwood Dr Unit A Midland, TX | 2.0 | 1.0 | 1000 | $1,695 | $1.70 | 43d | 1 | 1.06mi |
| 1808 Tradewinds Blvd Midland, TX | 1.0–3.0 | 1.0–2.0 | 1126 | $2,078 | $1.84 | 13d | 13 | 1.10mi |
| 3811 Cedar Spring Dr Midland, TX | 4.0 | 2.0 | 1500 | $2,600 | $1.73 | 43d | 1 | 1.12mi |
| 4701 W Illinois Ave Unit D Midland, TX | 2.0 | 1.0 | 942 | $1,050 | $1.11 | 21d | 1 | 1.13mi |
| 4610 Storey Ave Midland, TX | 3.0 | 2.0 | 1184 | $1,899 | $1.60 | 21d | 1 | 1.27mi |
| 3506 Apache Dr Midland, TX | 2.0 | 1.0 | 1004 | $1,800 | $1.79 | 21d | 1 | 1.28mi |
| 4506 Storey Ave Midland, TX | 3.0 | 1.0 | 1400 | $1,650 | $1.18 | 13d | 1 | 1.33mi |
| 5202 Ric Dr Midland, TX | 3.0 | 2.0 | 1258 | $1,975 | $1.57 | 21d | 1 | 1.34mi |
| 4000 W Illinois Ave Midland, TX | 1.0–2.0 | 1.0–2.0 | 755 | $1,545 | $2.05 | 21d | 10 | 1.36mi |
| 516 North Loop 250 W Midland, TX | 1.0–2.0 | 1.0–2.0 | 757 | $1,724 | $2.28 | 13d | 28 | 1.41mi |
| 4525 Crockett Ave Midland, TX | 2.0 | 2.0 | 1400 | $4,250 | $3.04 | 21d | 1 | 1.41mi |
| 4519 Crockett Ave Midland, TX | 2.0 | 2.0 | 1465 | $1,900 | $1.30 | 21d | 1 | 1.42mi |
| 4503 Crockett Ave Unit B Midland, TX | 2.0 | 2.0 | 1250 | $2,000 | $1.60 | 43d | 1 | 1.43mi |
| 4405 Crockett Ave Unit A Midland, TX | 3.0 | 2.0 | 1100 | $1,800 | $1.64 | 43d | 1 | 1.45mi |
| 4719 Bowie Dr Midland, TX | 3.0 | 2.0 | 991 | $4,500 | $4.54 | 21d | 1 | 1.45mi |
| 4403 Crockett Ave Unit A Midland, TX | 3.0 | 2.0 | 1065 | $1,800 | $1.69 | 21d | 1 | 1.46mi |
| 509 Delmar St Midland, TX | 1.0–2.0 | 1.0–2.5 | 1116 | $1,796 | $1.61 | 13d | 8 | 1.46mi |
| 4313 Storey Ave Unit A Midland, TX | 3.0 | 2.0 | 1255 | $2,000 | $1.59 | 43d | 1 | 1.47mi |
Listing history 20 events
-
2026-06-19days on market $160,000 Active 99 DOM
-
2026-06-18days on market $160,000 Active 98 DOM
-
2026-06-17days on market $160,000 Active 97 DOM
-
2026-06-16days on market $160,000 Active 96 DOM
-
2026-06-15days on market $160,000 Active 95 DOM
-
2026-06-14days on market $160,000 Active 93 DOM
-
2026-06-13days on market $160,000 Active 92 DOM
-
2026-06-10days on market $160,000 Active 90 DOM
-
2026-06-09days on market $160,000 Active 89 DOM
-
2026-06-08days on market $160,000 Active 88 DOM
-
2026-06-07days on market $160,000 Active 87 DOM
-
2026-06-03days on market $160,000 Active 83 DOM
-
2026-06-02days on market $160,000 Active 82 DOM
-
2026-06-01days on market $160,000 Active 81 DOM
-
2026-05-31days on market $160,000 Active 80 DOM
-
2026-05-30days on market $160,000 Active 79 DOM
-
2026-05-09price $160,000 150-char remark
Show marketing remark (150 chars)
Great diamond in the rough !!! 3 bedroom 1 bath will look at offers home to be sold as is !! has great 2 car garage 2 storage buildings nice location.
-
2026-03-12$168,000 Active 150-char remark
Show marketing remark (150 chars)
Great diamond in the rough !!! 3 bedroom 1 bath will look at offers home to be sold as is !! has great 2 car garage 2 storage buildings nice location.
-
2026-03-10$168,000 Active 166-char remark
Show marketing remark (166 chars)
Diamond in the rough great 3 Bedroom 1 bath 2 car garage and 2 storage sheds will look at offers please call Stormy Self 432-235-2238 for all showings and combo code
-
1998-07-10soldstatus
ⓘ Source: listings_history table (triggers on properties + properties_extension) + one-shot
backfill from property_details.listing_events for pre-trigger history.
Tax reassessment forecast TX · Resets to sale price
- Current annual tax
- $1,756 · $146/mo
- Projected year-2 tax
- $2,928 · $244/mo
- Expected delta
- +$1,172/yr (+$98/mo · 66.7%)
ⓘ Screening estimate from a state-policy table — verify with the county assessor before closing.
Climate risk First Street
- Flood 1/10 Low FEMA zone X · 0% chance over 30 yrs
- Wildfire 8/10 Severe
- Heat 6/10 Major 7 d/yr ≥102°F today · 20 d/yr by 30 yrs out
- Wind 2/10 Low 4% chance of damaging wind over 30 yrs
- Air quality 1/10 Low 0 unhealthy d/yr today · 0 by 30 yrs out
Nearby sold comps map
Loading sold comps map…
Walkable amenities ~0.75 mi
Loading nearby amenities…
Taxation est. · year 1
- Rental income
- $23,231
- − Mortgage interest
- −$8,962
- − Property taxes
- −$1,756
- − Insurance
- −$800
- − Repairs & maintenance
- −$1,858
- − Management
- −$1,858
- − Depreciation
- −$4,655
- Taxable income
- $3,341
- Est. tax owed @ 24.0%
- −$802
- After-tax cash flow
- $4,926/yr
For passive investors: Depreciation is non-cash, so a rental often shows a tax loss while cash-flowing — sheltering income. Rental losses are passive: they offset passive income freely, and up to $25,000/yr can offset ordinary (W-2) income if you actively participate and your MAGI is under $100k (phasing out to $0 by $150k); unused losses carry forward. On sale, claimed depreciation is recaptured at up to 25%, and gains may owe capital-gains tax (a 1031 exchange can defer both). Figures are a year-1 estimate at your 24.0% rate — not tax advice; consult a CPA.
Schools (NCES district)
- District
- Midland ISD
- NCES district ID
- 4830570
- Math proficiency
- 34% ▼ -7.00%
- Reading proficiency
- 36% ▬ 0.00%
- Median HH income
- $63,457
- Composite
- 31.63/100
- National rank
- #5938
- State rank
- #477 of 826 in TX
Livability — Midland
- Score
- 79/100
- State rank
- #57
- US rank
- #2192
Category grades
Schools grade is shown separately in the Schools card above.
Census & demographics
- Census place
- Midland, TX
- County
- Midland County · 168,494 people
- City population
- 168,494
- Metro
- Midland, TX
- Population (ZIP)
- 20,419
- Household income
- $77,285
- Rent vs Own
- Severe rent burden
- 417.0
Population outlook (Midland County) Hauer SSP2
- Today (2025)
- 220,895 people
- By 2030
- 253,667 · +14.8%
- By 2040
- 325,498 · +47.4%
- By 2050
- 404,168 · +83.0%
- By 2075
- 609,802 · +176.1%
- By 2100
- 760,172 · +244.1%
Race, ethnicity, and origin ACS 2023
- Neighborhood character
- Diverse neighborhood (Simpson 0.59)
- Race & ethnicity
- Hispanic / Latino 54% White 34% Two or more races 16% Black 8% Asian 2%
- Hispanic origin (detail)
- Mexican 45% Cuban 4%
- Common ancestry
- Slovak 1% Italian 1% Serbian 1%
- Foreign-born
- 20% · Canada, Jamaica, Vietnam
- Languages at home
- 58% English-only · Spanish 38% Arabic 1% Chinese 1%
Political lean MEDSL · Midland
- 2024 margin
- Solid R (+60.5) · D 19.3% · R 79.8%
- 2008→2024 swing
- -3.3pp toward R · 2008: -57.3pp · 2024: -60.5pp
- All cycles
- 2024: R+60.5 2020: R+56.6 2016: R+55.2 2012: R+61.5 2008: R+57.3
Not yet ingested
- Civics
- —
Market trends
- HPI YoY
- ▼ -250.72%
- Current HPI
- 224.6222
- Rent YoY
- ▼ -0.33%
- Metro
- Midland, TX
- State GDP YoY
- ▲ 3.95%
- F500 in state
- 110
Industry mix (Fortune 500 HQ in TX)
| Industry | F500 HQs | Revenue |
|---|---|---|
| Energy | 16 | $1,198B |
|
||
| Technology | 5 | $198B |
|
||
| Engineering / Construction | 4 | $72B |
|
||
| Energy Services | 3 | $60B |
|
||
| Utilities | 3 | $41B |
|
||
| Healthcare | 2 | $330B |
|
||
Price history
-4.8% since first listed4 events — show timeline
- 2026-05-09 Price Changed $160,000 ODMLS
- 2026-03-12 Listed $168,000 ODMLS
- 2026-03-10 Listed $168,000 PBBOR
- 1998-07-10 Sold (Public Records) — Public Records
Property tax history
+3.2%/yrLatest (2025): $1,756 · +6.2% YoY. Source: county tax records.
Cash-flow waterfall
monthlySold comps — $/sqft
last 12 mo · ≤1 miLoading sold comps…