 6-Plex
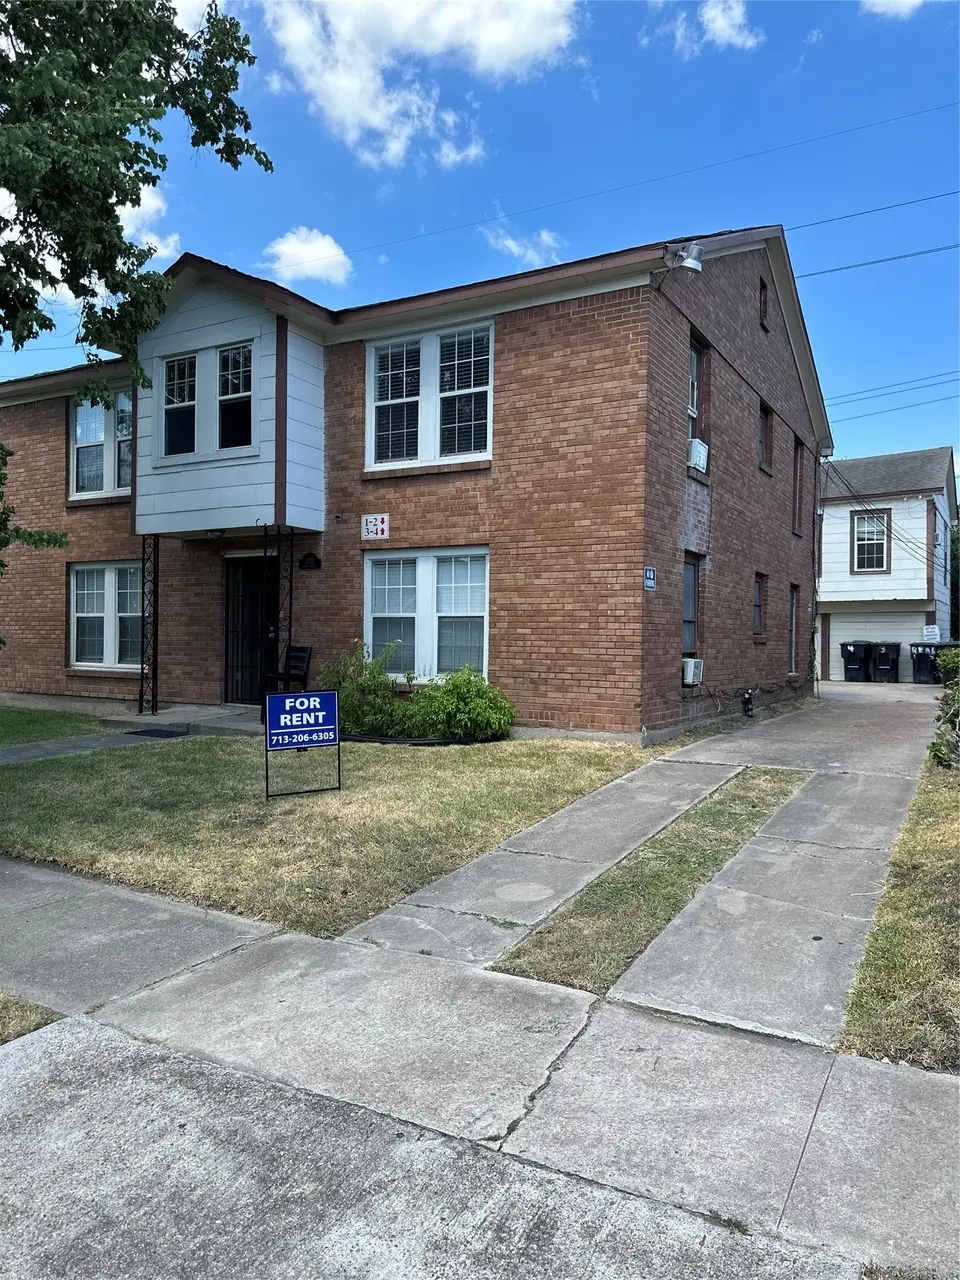
2711 Ruth St · Houston, TX
Flood risk 1/10 · Minimal
- FEMA flood zone
- X (unshaded)
- Chance of flooding over 30 yrs
- 0.0%
- Est. flood insurance / yr
- $507 – $1,088
Fire risk 1/10 · Minimal
- Est. fire insurance / yr
- $1,222 – $2,270
Heat risk 10/10 · Severe
- Hot days now (above 109°F)
- 7 days/yr
- Hot days in 30 yrs
- 25 days/yr
Wind risk 9/10 · Severe
- Chance of severe wind over 30 yrs
- 99.0%
Air-quality risk 2/10 · Minimal
- Unhealthy air days now
- 2 days/yr
- Unhealthy air days in 30 yrs
- 2 days/yr
Risk factors via First Street. Map © Google.
Why this score? — see what drove the C- grade
The composite is a weighted blend of 9 inputs, each scored 0–100. Each bar is that input's sub-score; the figure is the points it added to the 100-point composite (weight × sub-score).
- Cash flow +26.0/30.0
- DSCR +8.8/10.0
- 1% rule +6.9/10.0
- Livability +3.7/5.0
- Schools +2.7/10.0
- Rent growth +2.4/5.0
- Condition / age +2.2/5.0
- ARV discount +0.0/15.0
- Appreciation +0.0/10.0
$545,000
🖨 Deal sheet 📄 Offer letter ✓ Due diligence
Multi-family units
County records classify this as Multi-Family (5+ Unit). Listing-text estimate: 6 units. confirmed
5+ unit building — per-unit beds/baths from public records are typically unavailable; the breakdown below (if shown) is an estimate from the listing text.
Listing remarks MLS
Rare opportunity. 6 Plex easy walking distance to Texas Southern University. Short drive to The University of Houston, or Downtown. Front house consists of 2,604sqft. (4) 1 Bedroom 1 Bathroom apartments. These 4 units are around 650 sqft. each. The garage is 950 sqft. with (2) 1 Bedroom 1 Bathroom apartments. These 2 units are around 475 sqft. each. Total living space with the front house and garage apartments is 3,554 sqft. on a 5,250 sqft. lot. Incredible chance to own 6 rental units in the heart of Houston.
Key facts
- Heart of houston
- 6 rental units
- 5,250 sq ft lot
Tags
Neighborhood map
What this means for you Summary
Snapshot
- This is a 6 × 1-bed/1.0-bath units multifamily listed at $545k. Condition is rated fair.
Deal economics
- At list price, monthly cash flow is $1k ($16k/yr) — positive. Per door: $227/mo.
- The deal already cash-flows at list — no discount required.
- Meets the 1% rule at list price ($6k rent vs $545k).
- Recommended offer: $480k (12.0% below list) — sets the bar for market timing.
- Cap rate 9.3% vs local median 3.2% in Houston — top-decile yield for the area; either an underpriced asset or a hidden risk that comps aren't pricing in. Stress-test before assuming the spread holds.
Location & tenants
- Location reads 74/100 on livability (#184 in TX, #4,771 nationally) — a middle-class / working-renter tenant base. Strengths: amenities A+, cost of living A+, housing A+; Watch: schools D, crime F.
- Houston ISD (urban): math 27% / reading 35% proficiency, ranked #593 of 826 in TX (top 72%) — families likely to look elsewhere, expect single-tenant / working-renter base with shorter leases; 71% free/reduced lunch — lower-income household profile, screen leases tightly.
- Market conditions: Rents soft (-0.3%/yr); 581 active listings in the ZIP; 3 comparable units currently listed for rent nearby; rentals at typical pace (median 24d on market — plan ~3-4 weeks tenant-placement turnaround); 29,883 units permitted in Harris County in 2024 (8,621 in 5+ unit buildings).
- At $6,493/mo this rent would consume 109% of the median local household income ($71k/yr) (locally 3072% of renters already pay >50% of income on rent) — very limited rent-growth headroom before tenants either downsize or default.
Forward outlook
- Local home prices are declining (-3.0%/yr); year-one equity from $4k of loan paydown is wiped out by about $16k of value loss. Plan a longer hold.
- Harris County population projected at +47% by 2050 — long-run rental-demand tailwind backs the buy-and-hold thesis.
Negotiation context
- It's been on market 410 days — a 12% lower offer ($480k) is reasonable based on typical stale-listing flexibility.
Risks & watch-outs
- Watch-outs: built in 1955 — expect roof / HVAC / electrical / plumbing capex.
- Climate carrying-cost: severe wind risk, 99% chance of damaging wind over 30y; extreme-heat days projected 7→25/yr by 2055 (HVAC capex compounding) — expect insurance premiums to compound above CPI over the hold.
Questions for the listing agent
- It's been on market 410 days. Have you received any prior offers? Is the seller open to a 12% concession, seller financing, or rate buy-down credit?
- Can we see the unit-by-unit rent roll, current vacancy, and any below-market leases? What's the average tenancy length?
- What capital expenditures (roof, boiler, parking lot, exteriors) have been made in the last 5 years, and what's planned in the next 2?
- Have any recent inspections been done? Can we get a copy of the seller's disclosures and any deferred-maintenance estimates?
- Built in 1955 — when were the roof, HVAC, electrical panel, plumbing, and water heater last replaced?
- Why hasn't it sold? Are there any deal-killer items the seller is aware of (foundation, flood, title, zoning, code violations)?
- Is there a deadline driving the sale (1031 exchange, divorce, estate, relocation)? That informs how much negotiation room exists.
- Schools are D-rated, which usually means shorter tenancies and higher turnover. Who's the typical renter profile here, and what's been the actual vacancy rate?
- Crime grade is F in this area — have there been break-ins, vandalism, or insurance claims at this property in the last 3 years? What carrier currently insures it and at what premium?
- What's the average days-on-market for RENTAL listings here right now (not sales)? A rising rental-DOM trend means longer vacancies and softer asking-rent achievability than the comps imply.
- What's the recent tenant-quality profile in this submarket — average credit score on applications, eviction rate, late-payment / NSF rate, and stable-employment percentage? A property-management company in the area should have these aggregated.
- How much new apartment / multifamily construction is in the pipeline within 1–3 miles? Heavy new supply (>2% of stock underway) typically softens rents 12–24 months out; light construction supports rent growth.
Investment metrics
- 1% rule
- 1.19% ✓
- Cap rate
- 9.29%
- Cash-on-cash
- 10.72%
- DSCR
- 1.48
- GRM
- 7.0
CMA / ARV
- ARV (median comp)
- $465,987
- List price
- $545,000
- Delta
- 16.96%
- Verdict
- OVERPRICED
- Comps
- 20 within 1.0 mi
Show comp detail 2 sales within ~0.75 mi
| Address | Dist | Beds/Ba | Sqft | Sold | Price | $/sf | Match |
|---|---|---|---|---|---|---|---|
| 2218 Arbor St | 0.36mi | 5/3.0 (-1) | 2,628 (+1%) | 4mo | $420,000 | $160 | 62 |
| 3444 Blodgett St | 0.68mi | 6/2.0 | 2,608 (+0%) | 13mo | $379,000 | $145 | 41 |
Match score weights: distance 35% · size 25% · config 20% · recency 20%. Top-matched comps best support the ARV.
Projected returns pro-forma
-3.0% appreciation · 0.0% rent growth · sell at horizon
- IRR
- -3.7%
- Equity multiple
- 0.87×
- Total profit
- $-20,427
- Equity at exit
- $81,261
- IRR
- 2.2%
- Equity multiple
- 1.14×
- Total profit
- $20,863
- Equity at exit
- $47,122
Cash invested: $152,600 (down + closing). Projections, not guarantees.
Landlord ↔ Tenant lean methodology
- Overall (STATE)
- 87 Strongly Landlord-Friendly
- State Texas
- 87 Strongly Landlord-Friendly · R+5
- County
- — inherits STATE
- City
- — inherits STATE
ZIP-level market 77004
- Rents YoY
- -0.3%
- Active inventory
- 581
- Price-to-rent
- 42.0×
Monthly cashflow live
- Estimated rent
- $6,493 medium interval (Pro) →
- Mortgage (P&I)
- −$2,858
- Tax est. 1.5%
- −$681 /mo · $8,175/yr
- Insurance
- −$227
- HOA
- −$0
- Vacancy / Maint / Mgmt
- −$1,364
- Net cashflow
- $1,363
Break-even live
6-unit breakdown (identical units grouped — click to expand)
| Units | Beds | Baths | Est. rent |
|---|---|---|---|
| 6× units | 1 | 1 | $6,492 |
| #1 | 1 | 1 | $1,082 |
| #2 | 1 | 1 | $1,082 |
| #3 | 1 | 1 | $1,082 |
| #4 | 1 | 1 | $1,082 |
| #5 | 1 | 1 | $1,082 |
| #6 | 1 | 1 | $1,082 |
| Total (6 units) | $6,493 | ||
UW: 25.0% down · 7.5% · 30yr · 1.5% tax · 5.0% vac · 8.0% maint · 8.0% mgmt
Financing live
Cash to close
- Down payment
- $136,250
- Closing costs
- $16,350
- Reserves months
- —
- Total cash needed
- —
Loan-product check · same deal, 3 products live
Conventional
25% down · 7.5% · 30yr
- Down + closing
- —
- Monthly P&I
- —
- Monthly cashflow
- —
- DSCR
- —
- Eligible?
- —
Personal DTI + credit; lowest rate.
DSCR
20% down · 8.5% · 30yr
- Down + closing
- —
- Monthly P&I
- —
- Monthly cashflow
- —
- DSCR
- —
- Eligible?
- —
No personal income docs; deal must DSCR.
Hard money
10% down · 12.0% · 12mo
- Down + closing
- —
- Monthly P&I
- —
- Monthly cashflow
- —
- DSCR
- —
- Eligible?
- —
Short-term bridge; refi at stabilization.
Rent comps 3 comps
| Address | Beds | Baths | Sqft | Rent | $/sqft | DOM | Units | Dist |
|---|---|---|---|---|---|---|---|---|
| 2703 Blodgett St Unit 1047952P Houston, TX | 1.0–5.0 | 1.5–5.5 | 2497 | $13,847 | $5.55 | 1d | 2 | 0.05mi |
| 3122 Lucinda St Houston, TX | 5.0 | 5.0 | 1984 | $999 | $0.50 | 24d | 1 | 1.26mi |
| 3719 Elgin St Houston, TX | 1.0–5.0 | 1.0–5.0 | 1241 | $1,899 | $1.53 | 24d | 14 | 1.33mi |
Listing history 5 events
-
2026-06-04days on market $545,000 Active 410 DOM
-
2026-06-01days on market $545,000 Active 407 DOM
-
2026-05-31days on market $545,000 Active 406 DOM
-
2025-11-20price $545,000 523-char remark
Show marketing remark (523 chars)
Rare opportunity. 6 Plex easy walking distance to Texas Southern University. Short drive to The University of Houston, or Downtown. Front house consists of 2,604sqft. (4) 1 Bedroom 1 Bathroom apartments. These 4 units are around 650 sqft. each. The garage is 950 sqft. with (2) 1 Bedroom 1 Bathroom apartments. These 2 units are around 475 sqft. each. Total living space with the front house and garage apartments is 3,554 sqft. on a 5,250 sqft. lot. Incredible chance to own 6 rental units in the heart of Houston.
-
2025-04-20$575,000 Active 523-char remark
Show marketing remark (523 chars)
Rare opportunity. 6 Plex easy walking distance to Texas Southern University. Short drive to The University of Houston, or Downtown. Front house consists of 2,604sqft. (4) 1 Bedroom 1 Bathroom apartments. These 4 units are around 650 sqft. each. The garage is 950 sqft. with (2) 1 Bedroom 1 Bathroom apartments. These 2 units are around 475 sqft. each. Total living space with the front house and garage apartments is 3,554 sqft. on a 5,250 sqft. lot. Incredible chance to own 6 rental units in the heart of Houston.
ⓘ Source: listings_history table (triggers on properties + properties_extension) + one-shot
backfill from property_details.listing_events for pre-trigger history.
Climate risk First Street
- Flood 1/10 Low FEMA zone X (unshaded) · 0% chance over 30 yrs
- Wildfire 1/10 Low
- Heat 10/10 Extreme 7 d/yr ≥109°F today · 25 d/yr by 30 yrs out
- Wind 9/10 Extreme 99% chance of damaging wind over 30 yrs
- Air quality 2/10 Low 2 unhealthy d/yr today · 2 by 30 yrs out
Nearby sold comps map
Loading sold comps map…
Walkable amenities ~0.75 mi
Loading nearby amenities…
Taxation est. · year 1
- Rental income
- $77,916
- − Mortgage interest
- −$30,528
- − Property taxes
- −$8,175
- − Insurance
- −$2,725
- − Repairs & maintenance
- −$6,233
- − Management
- −$6,233
- − Depreciation
- −$15,855
- Taxable income
- $8,166
- Est. tax owed @ 24.0%
- −$1,960
- After-tax cash flow
- $14,397/yr
For passive investors: Depreciation is non-cash, so a rental often shows a tax loss while cash-flowing — sheltering income. Rental losses are passive: they offset passive income freely, and up to $25,000/yr can offset ordinary (W-2) income if you actively participate and your MAGI is under $100k (phasing out to $0 by $150k); unused losses carry forward. On sale, claimed depreciation is recaptured at up to 25%, and gains may owe capital-gains tax (a 1031 exchange can defer both). Figures are a year-1 estimate at your 24.0% rate — not tax advice; consult a CPA.
Condition & rehab AI · 12 photos
This multi-family property requires significant repairs and updates to improve its condition and value. The exterior and interior need fresh paint, new carpet, and modern kitchen and bathrooms.
Repairs flagged
- Major roof — Photos don't show roof, but weathered siding suggests potential issues
- Major exterior siding — Weathered siding
- Major interior walls/paint — Worn paint
- Major flooring — Worn carpet
- Major kitchen — Outdated kitchen
- Major bathrooms — Outdated bathrooms
Value-add opportunities
- Resale Paint interior walls — Fresh paint enhances curb appeal
- Resale Replace carpet — Fresh carpet improves living space
- Both Upgrade kitchen and bathrooms — Modern kitchen and bathrooms increase both resale and rental value
Renovation cost estimate screening
| Repair item | Severity | Est. cost |
|---|---|---|
| roof · Photos don't show roof, but weathered siding suggests potential issues | Major | $15,000–50,000 |
| exterior siding · Weathered siding | Major | $15,000–50,000 |
| interior walls/paint · Worn paint | Major | $15,000–50,000 |
| flooring · Worn carpet | Major | $15,000–50,000 |
| kitchen · Outdated kitchen | Major | $15,000–50,000 |
| bathrooms · Outdated bathrooms | Major | $15,000–50,000 |
| Total estimated repair cost · 6 items | $90,000–300,000 |
Value-add ROI direction
- Resale Paint interior walls — Fresh paint enhances curb appeal ↑
- Resale Replace carpet — Fresh carpet improves living space ↑
- Both Upgrade kitchen and bathrooms — Modern kitchen and bathrooms increase both resale and rental value ↑
ⓘ Cost ranges are severity-bucket heuristics (US national rule-of-thumb). Get contractor quotes + a written scope before underwriting a rehab budget.
Schools (NCES district)
- District
- Houston ISD
- NCES district ID
- 4823640
- Math proficiency
- 27% ▼ -18.00%
- Reading proficiency
- 35% ▼ -6.00%
- Median HH income
- $46,054
- Composite
- 26.63/100
- National rank
- #7173
- State rank
- #593 of 826 in TX
Livability — Houston
- Score
- 74/100
- State rank
- #184
- US rank
- #4771
Category grades
Schools grade is shown separately in the Schools card above.
Census & demographics
- Census place
- Houston, TX
- County
- Harris County · 4,702,590 people
- City population
- 3,226,434
- Metro
- Houston-The Woodlands-Sugar Land, TX
- Population (ZIP)
- 35,997
- Household income
- $71,199
- Rent vs Own
- Severe rent burden
- 3072.0
Population outlook (Harris County) Hauer SSP2
- Today (2025)
- 5,571,493 people
- By 2030
- 6,089,821 · +9.3%
- By 2040
- 7,142,806 · +28.2%
- By 2050
- 8,185,864 · +46.9%
- By 2075
- 10,574,329 · +89.8%
- By 2100
- 12,109,958 · +117.4%
Race, ethnicity, and origin ACS 2023
- Neighborhood character
- Diverse neighborhood (Simpson 0.68)
- Race & ethnicity
- Black 48% White 27% Hispanic / Latino 13% Two or more races 11% Asian 8%
- Hispanic origin (detail)
- Mexican 9%
- Common ancestry
- Lithuanian 1% Romanian 1% Italian 1%
- Foreign-born
- 14% · Canada, China, South Korea
- Languages at home
- 82% English-only · Spanish 10% Chinese 2% Other Indo-European 2%
Political lean MEDSL · Harris
- 2024 margin
- Lean D (+5.5) · D 52.0% · R 46.4% · Other 1.6%
- 2008→2024 swing
- +3.9pp toward D · 2008: 1.6pp · 2024: 5.5pp
- All cycles
- 2024: D+5.5 2020: D+13.3 2016: D+12.4 2012: D+0.1 2008: D+1.6
Not yet ingested
- Civics
- —
Market trends
- HPI YoY
- ▼ -139.34%
- Current HPI
- 199.6066
- Rent YoY
- ▼ -0.32%
- Metro
- Houston-The Woodlands-Sugar Land, TX
- State GDP YoY
- ▲ 3.95%
- F500 in state
- 110
Industry mix (Fortune 500 HQ in TX)
| Industry | F500 HQs | Revenue |
|---|---|---|
| Energy | 16 | $1,198B |
|
||
| Technology | 5 | $198B |
|
||
| Engineering / Construction | 4 | $72B |
|
||
| Energy Services | 3 | $60B |
|
||
| Utilities | 3 | $41B |
|
||
| Healthcare | 2 | $330B |
|
||
Price history
-5.2% since first listed2 events — show timeline
- 2025-11-20 Price Changed $545,000 HARMLS
- 2025-04-20 Listed $575,000 HARMLS
Cash-flow waterfall
monthlySold comps — $/sqft
last 12 mo · ≤1 miLoading sold comps…