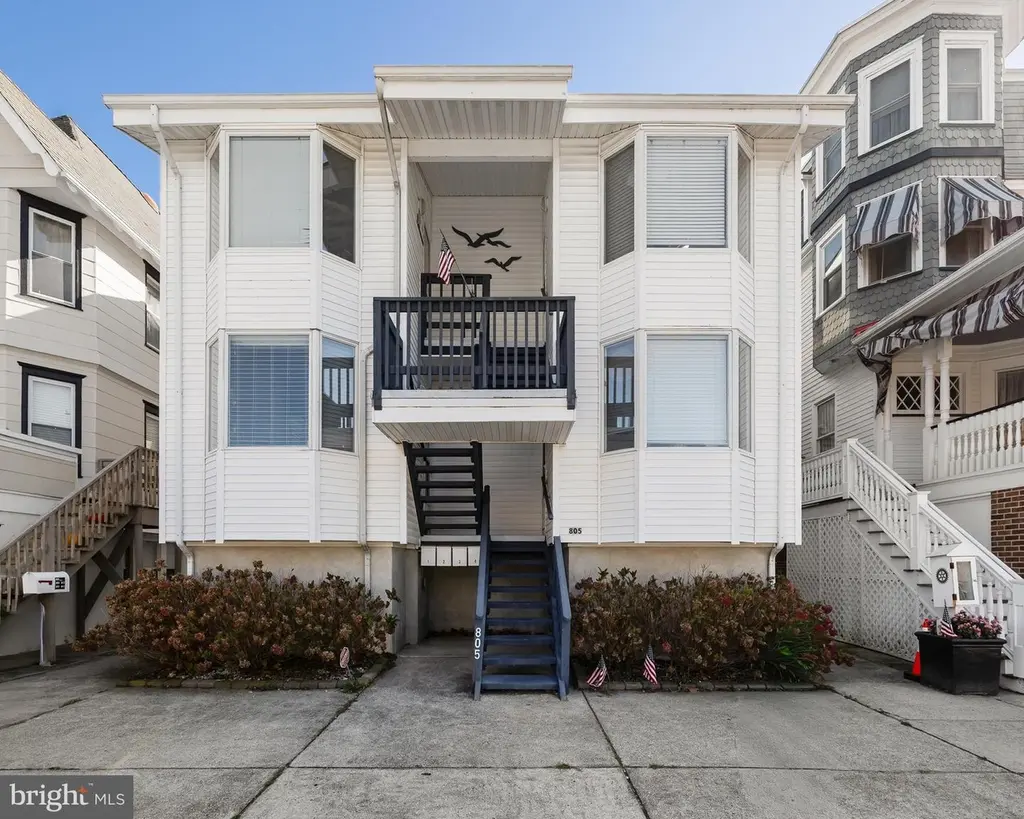
805 Central Ave #3 · Ocean City, NJ
Flood risk 8/10 · Major
- FEMA flood zone
- AE
- Chance of flooding over 30 yrs
- 0.99%
- Est. flood insurance / yr
- $1,737 – $8,500
Fire risk 1/10 · Minimal
- Est. fire insurance / yr
- $526 – $976
Heat risk 8/10 · Major
- Hot days now (above 98°F)
- 7 days/yr
- Hot days in 30 yrs
- 16 days/yr
Wind risk 8/10 · Major
- Chance of severe wind over 30 yrs
- 80.0%
Air-quality risk 2/10 · Minimal
- Unhealthy air days now
- 1 days/yr
- Unhealthy air days in 30 yrs
- 2 days/yr
Risk factors via First Street. Map © Google.
Why this score? — see what drove the C grade
The composite is a weighted blend of 9 inputs, each scored 0–100. Each bar is that input's sub-score; the figure is the points it added to the 100-point composite (weight × sub-score).
- Cash flow +23.1/30.0
- ARV discount +7.5/15.0
- DSCR +7.4/10.0
- 1% rule +5.4/10.0
- Livability +4.0/5.0
- Schools +3.7/10.0
- Rent growth +2.5/5.0
- Condition / age +2.5/5.0
- Appreciation +0.0/10.0
$590,000
🖨 Deal sheet (PDF) 📄 Offer letter ✓ Due diligence
Listing remarks MLS
Awesome location in the Center of all the action. Parking for 2-3 cars but in walking distance to all of Ocean City's greatest attaractions; Boardwalk, Beach, Shopping District, Restaurants, Ice cream Parlors and much more. You piece of America's Greatest Family Resort awaits you! call today for your private showing.
Key facts
- $150 HOA
- Parking
- Built 1975
Property features AI
Finance
- Other: Pets allowed with no pet restrictions; Lease not being considered
- HOA & community: HOA/Condo fee is $450 quarterly; HOA covers insurance, management, trash, and common area maintenance
Exterior
- Parking: Attached carport (1 space); Driveway parking; Crushed stone, unassigned parking; One total garage/parking space reported
- Utilities: Public water; Public sewer; Electric heating, cooling, and hot water
- Home design: Garden-style building (1–4 floors); Unit/flat; Entry on level 2; Condominium ownership; Bay/bow windows, skylights, vinyl-clad windows
- Construction: Block construction; Asbestos shingle roof; Year built estimated
- Exterior features: No basement; Above-grade and below-grade structures noted; Lot dimensions estimated
Interior
- Kitchen: Dishwasher; Microwave; Icemaker; Oven/Range - Electric; Stove; Refrigerator; Stainless steel appliances; Exhaust fan
- Bedrooms: Two bedrooms on the main level
- Flooring: Laminate flooring
- Bathrooms: One full bathroom on the main level
- Heating & cooling: Electric baseboard heat; Window cooling units (electric)
- Interior features: Tub/shower; Estimated living area
- Laundry & utility: Washer; Dryer - Electric; Washer/dryer stacked; Washer/dryer hookup in unit; Water heater
Neighborhood map
What this means for you Summary
Snapshot
- This is a 2-bed/1.0-bath condo listed at $590k.
Deal economics
- At list price, monthly cash flow is $631 ($8k/yr) — positive.
- The deal already cash-flows at list — no discount required.
- Meets the 1% rule at list price ($6k rent vs $590k).
- Recommended offer: $572k (3.0% below list) — sets the bar for market timing.
- Cap rate 8.4% vs local median 3.3% in Ocean City — top-decile yield for the area; either an underpriced asset or a hidden risk that comps aren't pricing in. Stress-test before assuming the spread holds.
Location & tenants
- Location reads 80/100 on livability (#72 in NJ, #1,762 nationally) — a professional / high-income tenant draw. Strengths: amenities A+, employment A+, health & safety A+; Watch: housing D+, cost of living F.
- Ocean City School District (urban): math 31% / reading 53% proficiency, ranked #212 of 472 in NJ (top 45%) — families likely to look elsewhere, expect single-tenant / working-renter base with shorter leases.
- Zoned schools: Ocean City Primary School (math 54% / reading 42%, grade D, #299 of 1,303 statewide, top 23%, 280 students, 31% FRL); Ocean City Intermediate School (math 26% / reading 49%, grade F, #217 of 431 statewide, top 51%, 370 students, 27% FRL); Ocean City High School (math 33% / reading 63%, grade D, #117 of 399 statewide, top 30%, 1,215 students, 13% FRL) — zoned schools at 24% FRL track the district average.
- Market conditions: 427 active listings in the ZIP; 4 comparable units currently listed for rent nearby; rentals lingering (median 46d on market — plan ~5-8 weeks vacancy on turnover, expect pricing pressure); 100% of comp listings sitting > 30 days — soft ceiling on asking rent; 877 units permitted in Cape May County in 2024 (35 in 5+ unit buildings).
Forward outlook
- Local home prices are declining (-3.0%/yr); year-one equity from $4k of loan paydown is wiped out by about $18k of value loss. Plan a longer hold.
- Cape May County population projected at -24% by 2050 — secular population decline; favor cash flow + early exit over multi-decade hold.
Negotiation context
- It's been on market 31 days — a 3% lower offer ($572k) is reasonable based on typical stale-listing flexibility.
- 5 sale attempts since 23y ago with the ask held roughly flat each time — persistent listings suggest the price (not the market) is what's stuck; bring a comps-based counter.
- Current owner paid $300k; list at $590k implies a 97% gain — meaningful room to come down on a strong offer.
Risks & watch-outs
- Watch-outs: flood insurance adds $427/mo.
- Climate carrying-cost: in FEMA flood zone AE (mandatory federal flood insurance); severe wind risk, 80% chance of damaging wind over 30y; extreme-heat days projected 7→16/yr by 2055 (HVAC capex compounding) — expect insurance premiums to compound above CPI over the hold.
Questions for the listing agent
- It's been on market 31 days. Have you received any prior offers? Is the seller open to a 3% concession, seller financing, or rate buy-down credit?
- Built in 1975 — when were the roof, HVAC, electrical panel, plumbing, and water heater last replaced?
- What's the actual annual flood-insurance premium (NFIP or private), and is the property in a SFHA with mandatory coverage?
- What does the HOA fee cover, when was the last increase, and are there any pending special assessments or reserve-fund shortfalls?
- Any open or pending special assessments — roof, HVAC, plumbing, elevator, façade? What's the per-unit balance and payoff schedule, and is the seller paying it off at close or rolling it to the buyer?
- Is there a deadline driving the sale (1031 exchange, divorce, estate, relocation)? That informs how much negotiation room exists.
- Schools are A-rated — typically a magnet for longer-tenancy family renters. What's the average tenant stay here, and is there a school-zone premium baked into asking?
- What's the average days-on-market for RENTAL listings here right now (not sales)? A rising rental-DOM trend means longer vacancies and softer asking-rent achievability than the comps imply.
- What's the recent tenant-quality profile in this submarket — average credit score on applications, eviction rate, late-payment / NSF rate, and stable-employment percentage? A property-management company in the area should have these aggregated.
- How much new apartment / multifamily construction is in the pipeline within 1–3 miles? Heavy new supply (>2% of stock underway) typically softens rents 12–24 months out; light construction supports rent growth.
Investment metrics
- 1% rule
- 1.04% ✓
- Cap rate
- 8.44%
- Cash-on-cash
- 7.68%
- DSCR
- 1.34
- GRM
- 8.0
CMA / ARV
- ARV (median comp)
- $389,844
- List price
- $590,000
- Delta
- 51.34%
- Verdict
- OVERPRICED
- Comps
- 20 within 1.0 mi
Projected returns pro-forma
-3.0% appreciation · 3.0% rent growth · sell at horizon
- IRR
- -9.1%
- Equity multiple
- 0.67×
- Total profit
- $-55,277
- Equity at exit
- $87,971
- IRR
- 0.4%
- Equity multiple
- 1.03×
- Total profit
- $4,265
- Equity at exit
- $51,012
Cash invested: $165,200 (down + closing). Projections, not guarantees.
Landlord ↔ Tenant lean methodology
- Overall (STATE)
- 21 Tenant-Leaning
- State New Jersey
- 21 Tenant-Leaning · D+6
- County
- — inherits STATE
- City
- — inherits STATE
ZIP-level market 08226
- Active inventory
- 427
- Price-to-rent
- 8.0×
Monthly cashflow live
- Estimated rent
- $6,119 medium interval (Pro) →
- Mortgage (P&I)
- −$3,094
- Tax from tax record
- −$287 /mo · $3,443/yr
- Insurance
- −$246
- Flood insurance flood zone
- −$427 /mo · $5,118/yr
- HOA
- −$150
- Vacancy / Maint / Mgmt
- −$1,285
- Net cashflow
- $631
Break-even live
Sensitivity live
| Price | -10% $965 | -5% $798 | +0% $631 | +5% $464 | +10% $297 |
|---|---|---|---|---|---|
| Rent | -10% $147 | -5% $389 | +0% $631 | +5% $872 | +10% $1,114 |
| Rate | -1.0pp $928 | -0.5pp $781 | base $631 | +0.5pp $478 | +1.0pp $322 |
UW: 25.0% down · 7.5% · 30yr · 1.5% tax · 5.0% vac · 8.0% maint · 8.0% mgmt
Financing live
Cash to close
- Down payment
- $147,500
- Closing costs
- $17,700
- Reserves months
- —
- Total cash needed
- —
Loan-product check · same deal, 3 products live
Conventional
25% down · 7.5% · 30yr
- Down + closing
- —
- Monthly P&I
- —
- Monthly cashflow
- —
- DSCR
- —
- Eligible?
- —
Personal DTI + credit; lowest rate.
DSCR
20% down · 8.5% · 30yr
- Down + closing
- —
- Monthly P&I
- —
- Monthly cashflow
- —
- DSCR
- —
- Eligible?
- —
No personal income docs; deal must DSCR.
Hard money
10% down · 12.0% · 12mo
- Down + closing
- —
- Monthly P&I
- —
- Monthly cashflow
- —
- DSCR
- —
- Eligible?
- —
Short-term bridge; refi at stabilization.
Rent comps 4 comps
| Address | Beds | Baths | Sqft | Rent | $/sqft | DOM | Units | Dist |
|---|---|---|---|---|---|---|---|---|
| 714 West Ave Unit 1308989P Ocean City, NJ | 2.0 | 1.0 | 742 | $6,384 | $8.60 | 45d | 1 | 0.18mi |
| 935 Ocean Ave Ocean City, NJ | 1.0–3.0 | 1.0–2.5 | 1112 | $5,350 | $4.81 | 45d | 1 | 0.24mi |
| 1142 Simpson Ave Unit 1308992P Ocean City, NJ | 3.0 | 2.0 | 1097 | $7,788 | $7.10 | 45d | 1 | 0.48mi |
| 101 West Ave Unit 1309011P Ocean City, NJ | 3.0 | 1.0 | 990 | $5,019 | $5.07 | 45d | 1 | 0.75mi |
HOA detail condo
- Monthly dues
- $150 · $1,800/yr
- Assessments
- None detected in remarks — confirm with the listing agent.
Listing history 34 events
-
2026-06-21days on market $590,000 Active 31 DOM
-
2026-06-21days on market $590,000 Active 30 DOM
-
2026-06-18days on market $590,000 Active 28 DOM
-
2026-06-17days on market $590,000 Active 27 DOM
-
2026-06-17remarks 677-char remark
-
2026-06-17price $590,000 Active 26 DOM
-
2026-06-16days on market $595,000 Active 26 DOM
-
2026-06-15days on market $595,000 Active 25 DOM
-
2026-06-13days on market $595,000 Active 23 DOM
-
2026-06-12days on market $595,000 Active 22 DOM
-
2026-06-09days on market $595,000 Active 19 DOM
-
2026-06-08days on market $595,000 Active 18 DOM
-
2026-06-07days on market $595,000 Active 17 DOM
-
2026-06-07days on market $595,000 Active 16 DOM
-
2026-06-04days on market $595,000 Active 13 DOM
-
2026-06-02days on market $595,000 Active 12 DOM
-
2026-06-01days on market $595,000 Active 11 DOM
-
2026-05-31days on market $595,000 Active 10 DOM
-
2026-05-05historical $595,000
-
2026-01-02historical
-
2025-11-15$600,000 Active
-
2025-11-03historical
-
2012-04-13soldstatus $300,000
-
2011-11-15historical
Show marketing remark (318 chars)
Awesome location in the Center of all the action. Parking for 2-3 cars but in walking distance to all of Ocean City's greatest attaractions; Boardwalk, Beach, Shopping District, Restaurants, Ice cream Parlors and much more. You piece of America's Greatest Family Resort awaits you! call today for your private showing.
-
2011-05-26$359,990
Show marketing remark (318 chars)
Awesome location in the Center of all the action. Parking for 2-3 cars but in walking distance to all of Ocean City's greatest attaractions; Boardwalk, Beach, Shopping District, Restaurants, Ice cream Parlors and much more. You piece of America's Greatest Family Resort awaits you! call today for your private showing.
-
2005-11-23soldstatus $389,000
-
2005-10-28soldstatus $389,000
-
2005-10-07historical
-
2005-06-28$399,900
-
2003-09-03soldstatus $233,000
-
2003-09-03soldstatus $233,000
-
2003-08-04soldstatus $233,000
-
2003-06-17historical
-
2003-02-15$242,000
ⓘ Source: listings_history table (triggers on properties + properties_extension) + one-shot
backfill from property_details.listing_events for pre-trigger history.
Tax reassessment forecast NJ · Partial reset (capped growth)
- Current annual tax
- $3,443 · $287/mo
- Projected year-2 tax
- $9,067 · $756/mo
- Expected delta
- +$5,624/yr (+$469/mo · 163.4%)
ⓘ Screening estimate from a state-policy table — verify with the county assessor before closing.
Climate risk First Street
- Flood 8/10 Severe FEMA zone AE · 99% chance over 30 yrs
- Wildfire 1/10 Low
- Heat 8/10 Severe 7 d/yr ≥98°F today · 16 d/yr by 30 yrs out
- Wind 8/10 Severe 80% chance of damaging wind over 30 yrs
- Air quality 2/10 Low 1 unhealthy d/yr today · 2 by 30 yrs out
Nearby sold comps map
Loading sold comps map…
Walkable amenities ~0.75 mi
Loading nearby amenities…
Taxation est. · year 1
- Rental income
- $73,425
- − Mortgage interest
- −$33,049
- − Property taxes
- −$3,443
- − Insurance
- −$8,068
- − Repairs & maintenance
- −$5,874
- − Management
- −$5,874
- − HOA
- −$1,800
- − Depreciation
- −$17,164
- Taxable loss
- −$1,847
- Est. tax savings @ 24.0%
- +$443
- After-tax cash flow
- $8,010/yr
For passive investors: Depreciation is non-cash, so a rental often shows a tax loss while cash-flowing — sheltering income. Rental losses are passive: they offset passive income freely, and up to $25,000/yr can offset ordinary (W-2) income if you actively participate and your MAGI is under $100k (phasing out to $0 by $150k); unused losses carry forward. On sale, claimed depreciation is recaptured at up to 25%, and gains may owe capital-gains tax (a 1031 exchange can defer both). Figures are a year-1 estimate at your 24.0% rate — not tax advice; consult a CPA.
Schools (NCES district)
- District
- Ocean City School District
- NCES district ID
- 3411970
- Math proficiency
- 31% ▼ -12.00%
- Reading proficiency
- 53% ▼ -9.00%
- Median HH income
- $60,444
- Composite
- 37.07/100
- National rank
- #4506
- State rank
- #212 of 472 in NJ
Livability — Ocean City
- Score
- 80/100
- State rank
- #72
- US rank
- #1762
Category grades
Schools grade is shown separately in the Schools card above.
Census & demographics
- Census place
- Ocean City, NJ
- City population
- 11,260
- Population (ZIP)
- 11,260
Population outlook (Cape May County) Hauer SSP2
- Today (2025)
- 88,234 people
- By 2030
- 84,144 · -4.6%
- By 2040
- 75,146 · -14.8%
- By 2050
- 67,389 · -23.6%
- By 2075
- 55,732 · -36.8%
- By 2100
- 44,972 · -49.0%
Race, ethnicity, and origin ACS 2023
- Neighborhood character
- Predominantly White (86%)
- Race & ethnicity
- White 86% Hispanic / Latino 9% Black 2% Two or more races 2%
- Hispanic origin (detail)
- Mexican 7% Puerto Rican 1%
- Common ancestry
- Romanian 6% Slovak 2% Scotch-Irish 1%
- Foreign-born
- 7% · Canada
- Languages at home
- 89% English-only · Spanish 8% Russian/Polish/Slavic 2% Other Indo-European 2%
Political lean MEDSL · Cape May
- 2024 margin
- R (+19.2) · D 39.7% · R 58.9% · Other 1.4%
- 2008→2024 swing
- -10.6pp toward R · 2008: -8.7pp · 2024: -19.2pp
- All cycles
- 2024: R+19.2 2020: R+15.9 2016: R+19.9 2012: R+8.9 2008: R+8.7
Not yet ingested
- Civics
- —
Market trends
- HPI YoY
- ▼ -381.90%
- Current HPI
- 389.3687
- Rent YoY
- —
- Metro
- —
- State GDP YoY
- ▲ 2.05%
- F500 in state
- 34
Industry mix (Fortune 500 HQ in NJ)
| Industry | F500 HQs | Revenue |
|---|---|---|
| Consumer Goods | 3 | $31B |
|
||
| Pharmaceuticals | 2 | $153B |
|
||
| Technology | 2 | $21B |
|
||
| Insurance | 2 | $20B |
|
||
| Healthcare | 2 | $19B |
|
||
| Financial Services | 1 | $70B |
|
||
Price history
+143.8% since first listed18 events — show timeline
- 2026-06-16 Price Changed $590,000 BRIGHT MLS
- 2026-05-22 Listed $595,000 BRIGHT MLS
- 2026-05-05 Coming Soon $595,000 BRIGHT MLS
- 2026-01-02 Listing Removed — BRIGHT MLS
- 2025-11-15 Listed $600,000 BRIGHT MLS
- 2025-11-03 Coming Soon — BRIGHT MLS
- 2012-04-13 Sold (Public Records) $300,000 Public Records
- 2011-11-15 Listing Removed — SJSRMLS
- 2011-05-26 Listed $359,990 SJSRMLS
- 2005-11-23 Sold (Public Records) $389,000 Public Records
- 2005-10-28 Sold (MLS) $389,000 SJSRMLS
- 2005-10-07 Listing Removed — SJSRMLS
- 2005-06-28 Listed $399,900 SJSRMLS
- 2003-09-03 Sold (Public Records) $233,000 Public Records
- 2003-09-03 Sold (Public Records) $233,000 Public Records
- 2003-08-04 Sold (MLS) $233,000 SJSRMLS
- 2003-06-17 Listing Removed — SJSRMLS
- 2003-02-15 Listed $242,000 SJSRMLS
Property tax history
+2.5%/yrLatest (2025): $3,443 · +3.4% YoY. Source: county tax records.
Cash-flow waterfall
monthlySold comps — $/sqft
last 12 mo · ≤1 miLoading sold comps…