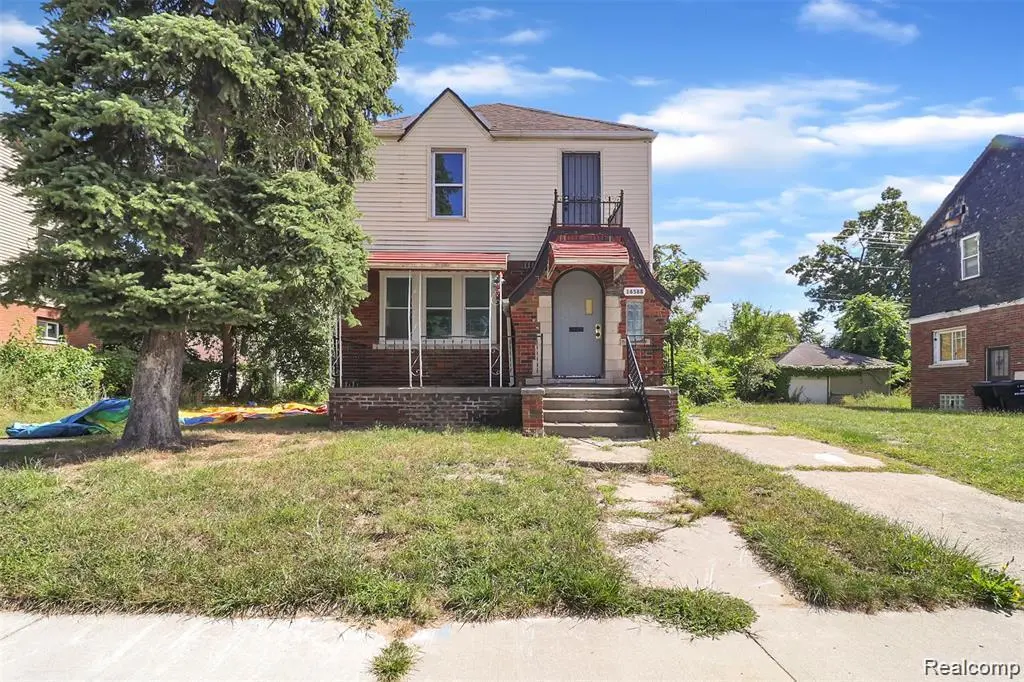
16588 Woodingham Dr · Detroit, MI
Flood risk 1/10 · Minimal
- FEMA flood zone
- X (unshaded)
- Chance of flooding over 30 yrs
- 0.0%
- Est. flood insurance / yr
- $473 – $860
Fire risk 1/10 · Minimal
- Est. fire insurance / yr
- $784 – $1,456
Heat risk 3/10 · Minor
- Hot days now (above 97°F)
- 7 days/yr
- Hot days in 30 yrs
- 14 days/yr
Wind risk 2/10 · Minimal
- Chance of severe wind over 30 yrs
- —
Air-quality risk 4/10 · Minor
- Unhealthy air days now
- 4 days/yr
- Unhealthy air days in 30 yrs
- 6 days/yr
Risk factors via First Street. Map © Google.
Why this score? — see what drove the C- grade
The composite is a weighted blend of 9 inputs, each scored 0–100. Each bar is that input's sub-score; the figure is the points it added to the 100-point composite (weight × sub-score).
- Cash flow +23.2/30.0
- DSCR +7.4/10.0
- ARV discount +7.0/15.0
- 1% rule +6.3/10.0
- Livability +3.7/5.0
- Rent growth +3.4/5.0
- Condition / age +2.5/5.0
- Schools +1.3/10.0
- Appreciation +0.0/10.0
$123,000
🖨 Deal sheet (PDF) 📄 Offer letter ✓ Due diligence
Listing remarks MLS
This home is truly a must-see! Every update reflects thoughtful craftsmanship and attention to detail - it's more than a renovation; it's a careful restoration that preserves the unique character and timeless Detroit appeal throughout. From corner to corner, you'll notice the care that went into maintaining its original charm while enhancing it with modern touches. An amazing starter home and a standout investment opportunity. Seller financing available - schedule your showing today!
Key facts
- 3,049 sq ft lot
- Built 1929
- Listed 115 days
Neighborhood map
What this means for you Summary
Snapshot
- This is a 3-bed/1.0-bath single-family listed at $123k.
Deal economics
- At list price, monthly cash flow is $222 ($3k/yr) — positive.
- The deal already cash-flows at list — no discount required.
- Meets the 1% rule at list price ($1k rent vs $123k).
- Recommended offer: $112k (9.0% below list) — sets the bar for market timing.
Location & tenants
- Location reads 73/100 on livability (#218 in MI) — a middle-class / working-renter tenant base. Strengths: amenities A+, commute A+, cost of living A+; Watch: schools F, crime F, employment F.
- Detroit Public Schools Community District (urban): math 10% / reading 24% proficiency, ranked #499 of 540 in MI (top 92%) — low school quality limits family demand, transient renter base, plan for 1-2y turnover; 90% free/reduced lunch — lower-income household profile, screen leases tightly.
- Market conditions: Rents rising (+3.4%/yr); 349 active listings in the ZIP; 40 comparable units currently listed for rent nearby; rentals at typical pace (median 25d on market — plan ~3-4 weeks tenant-placement turnaround); 42% of comp listings sitting > 30 days — soft ceiling on asking rent; 2,639 units permitted in Wayne County in 2024 (1,216 in 5+ unit buildings).
Forward outlook
- Local home prices are declining (-3.0%/yr); year-one equity from $850 of loan paydown is wiped out by about $4k of value loss. Plan a longer hold.
- Wayne County population projected at -17% by 2050 — secular population decline; favor cash flow + early exit over multi-decade hold.
Negotiation context
- It's been on market 115 days — a 9% lower offer ($112k) is reasonable based on typical stale-listing flexibility.
- 8 sale attempts since 4y ago with the ask held roughly flat each time — persistent listings suggest the price (not the market) is what's stuck; bring a comps-based counter.
- Current owner paid $65k; list at $123k implies a 89% gain — meaningful room to come down on a strong offer.
Risks & watch-outs
- Watch-outs: built in 1929 — expect roof / HVAC / electrical / plumbing capex.
Questions for the listing agent
- It's been on market 115 days. Have you received any prior offers? Is the seller open to a 9% concession, seller financing, or rate buy-down credit?
- Built in 1929 — when were the roof, HVAC, electrical panel, plumbing, and water heater last replaced?
- Why hasn't it sold? Are there any deal-killer items the seller is aware of (foundation, flood, title, zoning, code violations)?
- Is there a deadline driving the sale (1031 exchange, divorce, estate, relocation)? That informs how much negotiation room exists.
- Schools are F-rated, which usually means shorter tenancies and higher turnover. Who's the typical renter profile here, and what's been the actual vacancy rate?
- Crime grade is F in this area — have there been break-ins, vandalism, or insurance claims at this property in the last 3 years? What carrier currently insures it and at what premium?
- What's the average days-on-market for RENTAL listings here right now (not sales)? A rising rental-DOM trend means longer vacancies and softer asking-rent achievability than the comps imply.
- What's the recent tenant-quality profile in this submarket — average credit score on applications, eviction rate, late-payment / NSF rate, and stable-employment percentage? A property-management company in the area should have these aggregated.
- How much new for-sale + rental construction is in the pipeline within 1–3 miles? Heavy new supply typically softens prices + rents 12–24 months out; constrained supply supports both.
Investment metrics
- 1% rule
- 1.13% ✓
- Cap rate
- 8.46%
- Cash-on-cash
- 7.74%
- DSCR
- 1.34
- GRM
- 7.4
CMA / ARV
- ARV (median comp)
- $121,519
- List price
- $123,000
- Delta
- 1.22%
- Verdict
- FAIR
- Comps
- 20 within 1.0 mi
Show comp detail 12 sales within ~0.75 mi
| Address | Dist | Beds/Ba | Sqft | Sold | Price | $/sf | Match |
|---|---|---|---|---|---|---|---|
| 16659 Lilac St | 0.14mi | 3/2.0 | 1,296 (-6%) | 1mo | $40,000 | $31 | 78 |
| 15703 Northlawn St | 0.54mi | 4/1.0 (+1) | 1,365 (-1%) | 5mo | $70,000 | $51 | 64 |
| 16820 Santa Rosa Dr | 0.38mi | 3/1.0 | 1,224 (-11%) | 0mo | $10,000 | $8 | 63 |
| 17600 Santa Barbara Dr | 0.60mi | 3/1.0 | 1,446 (+5%) | 2mo | $145,000 | $100 | 62 |
| 16204 Wisconsin St | 0.38mi | 3/1.5 | 1,536 (+11%) | 1mo | $163,000 | $106 | 61 |
| 16811 Stoepel St | 0.40mi | 3/2.0 | 1,500 (+8%) | 5mo | $138,000 | $92 | 59 |
| 16143 Monica St | 0.36mi | 4/2.0 (+1) | 1,500 (+8%) | 2mo | $175,000 | $117 | 58 |
| 16500 Griggs St | 0.69mi | 3/1.5 | 1,427 (+3%) | 4mo | $130,000 | $91 | 57 |
| 16800 Ilene St | 0.64mi | 3/2.5 | 1,298 (-6%) | 1mo | $210,000 | $162 | 53 |
| 15379 Woodingham Dr | 0.66mi | 4/1.0 (+1) | 1,300 (-6%) | 4mo | $7,000 | $5 | 51 |
| 17421 Quincy St | 0.73mi | 3/1.5 | 1,474 (+7%) | 2mo | $234,500 | $159 | 51 |
| 17190 Washburn St | 0.67mi | 4/1.0 (+1) | 1,581 (+14%) | 3mo | $65,250 | $41 | 38 |
Match score weights: distance 35% · size 25% · config 20% · recency 20%. Top-matched comps best support the ARV.
Projected returns pro-forma
-3.0% appreciation · 3.44% rent growth · sell at horizon
- IRR
- -4.0%
- Equity multiple
- 0.85×
- Total profit
- $-5,125
- Equity at exit
- $18,340
- IRR
- 6.3%
- Equity multiple
- 1.48×
- Total profit
- $16,456
- Equity at exit
- $10,635
Cash invested: $34,440 (down + closing). Projections, not guarantees.
Landlord ↔ Tenant lean methodology
- Overall (STATE)
- 62 Landlord-Friendly
- State Michigan
- 62 Landlord-Friendly · EVEN
- County
- — inherits STATE
- City
- — inherits STATE
ZIP-level market 48221
- Rents YoY
- 3.4%
- Active inventory
- 349
- Price-to-rent
- 7.4×
Monthly cashflow live
- Estimated rent
- $1,385 high interval (Pro) →
- Mortgage (P&I)
- −$645
- Tax from tax record
- −$176 /mo · $2,110/yr
- Insurance
- −$51
- HOA
- −$0
- Vacancy / Maint / Mgmt
- −$291
- Net cashflow
- $222
Break-even live
Sensitivity live
| Price | -10% $292 | -5% $257 | +0% $222 | +5% $187 | +10% $153 |
|---|---|---|---|---|---|
| Rent | -10% $113 | -5% $168 | +0% $222 | +5% $277 | +10% $332 |
| Rate | -1.0pp $284 | -0.5pp $254 | base $222 | +0.5pp $190 | +1.0pp $158 |
UW: 25.0% down · 7.5% · 30yr · 1.5% tax · 5.0% vac · 8.0% maint · 8.0% mgmt
Financing live
Cash to close
- Down payment
- $30,750
- Closing costs
- $3,690
- Reserves months
- —
- Total cash needed
- —
Loan-product check · same deal, 3 products live
Conventional
25% down · 7.5% · 30yr
- Down + closing
- —
- Monthly P&I
- —
- Monthly cashflow
- —
- DSCR
- —
- Eligible?
- —
Personal DTI + credit; lowest rate.
DSCR
20% down · 8.5% · 30yr
- Down + closing
- —
- Monthly P&I
- —
- Monthly cashflow
- —
- DSCR
- —
- Eligible?
- —
No personal income docs; deal must DSCR.
Hard money
10% down · 12.0% · 12mo
- Down + closing
- —
- Monthly P&I
- —
- Monthly cashflow
- —
- DSCR
- —
- Eligible?
- —
Short-term bridge; refi at stabilization.
Rent comps 40 comps
| Address | Beds | Baths | Sqft | Rent | $/sqft | DOM | Units | Dist |
|---|---|---|---|---|---|---|---|---|
| 16722 Tuller St Detroit, MI | 3.0 | 1.5 | 1100 | $1,500 | $1.36 | 17d | 1 | 0.15mi |
| 16255 Lilac St Detroit, MI | 3.0 | 1.0 | 1312 | $1,394 | $1.06 | 18d | 1 | 0.20mi |
| 17159 Northlawn St Unit 17161 Detroit, MI | 2.0 | 1.0 | 1122 | $975 | $0.87 | 5d | 1 | 0.34mi |
| 16546 Wisconsin St Detroit, MI | 3.0 | 1.0 | 1577 | $1,500 | $0.95 | 44d | 1 | 0.35mi |
| 17163 Prairie St Unit 1B Detroit, MI | 3.0 | 1.5 | 1317 | $1,350 | $1.03 | 44d | 1 | 0.36mi |
| 17195 Northlawn St #1 Detroit, MI | 2.0 | 1.0 | 1200 | $1,100 | $0.92 | 20d | 1 | 0.37mi |
| 17195 Northlawn St #2 Detroit, MI | 2.0 | 1.0 | 1200 | $1,050 | $0.88 | 25d | 1 | 0.37mi |
| 16582 Santa Rosa Dr Detroit, MI | 3.0 | 1.0 | 1314 | $1,399 | $1.06 | 18d | 1 | 0.38mi |
| 17147 Monica St Unit 2 1 Detroit, MI | 2.0 | 1.0 | 900 | $975 | $1.08 | 25d | 1 | 0.39mi |
| 17368 Woodingham Dr Detroit, MI | 3.0 | 1.5 | 1200 | $1,800 | $1.50 | 44d | 1 | 0.41mi |
| 16183 Wisconsin St Detroit, MI | 3.0 | 1.5 | 1370 | $1,400 | $1.02 | 44d | 1 | 0.41mi |
| 16230 Indiana St Unit 2 Detroit, MI | 2.0 | 1.0 | 1050 | $1,200 | $1.14 | 18d | 1 | 0.42mi |
| 17145 Santa Rosa Dr Unit 1 Detroit, MI | 3.0 | 1.0 | 1050 | $1,400 | $1.33 | 18d | 1 | 0.43mi |
| 15771 Turner St Detroit, MI | 2.0 | 1.0 | 1000 | $1,049 | $1.05 | 44d | 1 | 0.47mi |
| 15791 Cherrylawn St Detroit, MI | 2.0 | 1.0 | 1792 | $1,100 | $0.61 | 44d | 1 | 0.50mi |
| 17530 Roselawn St Unit 1 Detroit, MI | 3.0 | 2.0 | 1600 | $2,000 | $1.25 | 25d | 1 | 0.51mi |
| 7350 Globe St Detroit, MI | 3.0 | 1.0 | 1000 | $1,550 | $1.55 | 4d | 1 | 0.56mi |
| 15777 Wisconsin St Unit 77 Detroit, MI | 2.0 | 1.0 | 900 | $950 | $1.06 | 5d | 1 | 0.57mi |
| 17215 Warrington Dr Detroit, MI | 2.0 | 1.0 | 1015 | $2,000 | $1.97 | 44d | 1 | 0.60mi |
| 16889 Washburn St Detroit, MI | 3.0 | 1.5 | 1300 | $1,100 | $0.85 | 18d | 1 | 0.61mi |
| 15457 Cloverlawn St Detroit, MI | 3.0 | 2.0 | 1500 | $1,275 | $0.85 | 25d | 1 | 0.62mi |
| 17551 Santa Rosa Dr Detroit, MI | 2.0 | 1.0 | 1036 | $1,095 | $1.06 | 44d | 1 | 0.62mi |
| 16934 Ilene St Detroit, MI | 3.0 | 1.5 | 1516 | $1,400 | $0.92 | 20d | 1 | 0.65mi |
| 17596 Santa Rosa Dr Detroit, MI | 2.0 | 1.0 | 1350 | $1,195 | $0.89 | 44d | 1 | 0.67mi |
| 17596 Santa Rosa Dr Unit 2 Detroit, MI | 2.0 | 1.0 | 1350 | $1,195 | $0.89 | 25d | 1 | 0.67mi |
| 15765 Washburn St Detroit, MI | 2.0 | 1.0 | 1093 | $950 | $0.87 | 44d | 1 | 0.75mi |
| 16834 Fairfield St Detroit, MI | 2.0 | 1.0 | 1516 | $1,363 | $0.90 | 25d | 1 | 0.78mi |
| 15708 Birwood St Detroit, MI | 3.0 | 1.0 | 1255 | $1,100 | $0.88 | 5d | 1 | 0.89mi |
| 15512 Mendota St Detroit, MI | 2.0 | 1.0 | 931 | $1,200 | $1.29 | 5d | 1 | 0.95mi |
| 15512 Mendota St Apt 2 Detroit, MI | 2.0 | 1.0 | 1000 | $1,200 | $1.20 | 44d | 1 | 0.95mi |
| 17540 Pinehurst St Detroit, MI | 3.0 | 1.0 | 1200 | $1,395 | $1.16 | 44d | 1 | 0.99mi |
| 15760 Monte Vista St Detroit, MI | 2.0 | 1.0 | 1080 | $1,250 | $1.16 | 44d | 1 | 1.01mi |
| 15906 Alden St Detroit, MI | 3.0 | 1.0 | 1030 | $1,150 | $1.12 | 17d | 1 | 1.05mi |
| 16174 Princeton St Unit 2 Detroit, MI | 2.0 | 1.0 | 985 | $1,100 | $1.12 | 44d | 1 | 1.11mi |
| 16174 Princeton St Detroit, MI | 2.0 | 1.0 | 985 | $1,100 | $1.12 | 20d | 1 | 1.11mi |
| 16204 Steel St Detroit, MI | 3.0 | 1.0 | 969 | $1,150 | $1.19 | 44d | 1 | 1.13mi |
| 14656 Roselawn St Detroit, MI | 3.0 | 1.0 | 1000 | $1,200 | $1.20 | 18d | 1 | 1.14mi |
| 15345 Parkside St Detroit, MI | 3.0 | 1.0 | 1152 | $1,300 | $1.13 | 44d | 1 | 1.18mi |
| 18935 Indiana St Detroit, MI | 3.0 | 1.0 | 1248 | $1,523 | $1.22 | 5d | 1 | 1.21mi |
| 2521 W McNichols Rd Unit B2 Detroit, MI | 2.0 | 1.0 | 1300 | $1,250 | $0.96 | 44d | 1 | 1.23mi |
Listing history 31 events
-
2026-06-18days on market $123,000 Active 115 DOM
-
2026-06-17days on market $123,000 Active 114 DOM
-
2026-06-15pricedays on market $123,000 Active 112 DOM
-
2026-06-13days on market $124,000 Active 110 DOM
-
2026-06-13days on market $124,000 Active 109 DOM
-
2026-06-09days on market $124,000 Active 106 DOM
-
2026-06-08days on market $124,000 Active 105 DOM
-
2026-06-07days on market $124,000 Active 104 DOM
-
2026-06-04days on market $124,000 Active 101 DOM
-
2026-06-03days on market $124,000 Active 100 DOM
-
2026-06-01days on market $124,000 Active 98 DOM
-
2026-05-31days on market $124,000 Active 97 DOM
-
2026-05-04price $124,000 488-char remark
Show marketing remark (514 chars)
This home is truly a must-see! Every update reflects thoughtful craftsmanship and attention to detail—it’s more than a renovation; it’s a careful restoration that preserves the unique character and timeless Detroit appeal throughout. From corner to corner, you’ll notice the care that went into maintaining its original charm while enhancing it with modern touches. An amazing starter home and a standout investment opportunity. Seller financing available—schedule your showing today!
-
2026-05-04price $124,000 514-char remark
Show marketing remark (514 chars)
This home is truly a must-see! Every update reflects thoughtful craftsmanship and attention to detail—it’s more than a renovation; it’s a careful restoration that preserves the unique character and timeless Detroit appeal throughout. From corner to corner, you’ll notice the care that went into maintaining its original charm while enhancing it with modern touches. An amazing starter home and a standout investment opportunity. Seller financing available—schedule your showing today!
-
2026-02-23$125,000 Active 514-char remark
Show marketing remark (488 chars)
This home is truly a must-see! Every update reflects thoughtful craftsmanship and attention to detail - it's more than a renovation; it's a careful restoration that preserves the unique character and timeless Detroit appeal throughout. From corner to corner, you'll notice the care that went into maintaining its original charm while enhancing it with modern touches. An amazing starter home and a standout investment opportunity. Seller financing available - schedule your showing today!
-
2026-02-23$125,000 Active 488-char remark
Show marketing remark (488 chars)
This home is truly a must-see! Every update reflects thoughtful craftsmanship and attention to detail - it's more than a renovation; it's a careful restoration that preserves the unique character and timeless Detroit appeal throughout. From corner to corner, you'll notice the care that went into maintaining its original charm while enhancing it with modern touches. An amazing starter home and a standout investment opportunity. Seller financing available - schedule your showing today!
-
2026-02-12historical
-
2025-09-10status Active
-
2025-09-10status Active
-
2025-08-18historical
-
2025-08-18price $125,000
-
2025-08-18historical
-
2025-08-18price $125,000
-
2025-08-11$69,999 Active
-
2025-08-11$69,999 Active
-
2022-12-09soldstatus $65,000
-
2022-07-28historical
-
2022-07-27historical
-
2022-06-19$69,000 Active
-
2022-06-19$69,000 Active
-
2019-10-30soldstatus $76,900
ⓘ Source: listings_history table (triggers on properties + properties_extension) + one-shot
backfill from property_details.listing_events for pre-trigger history.
Tax reassessment forecast MI · Partial reset (capped growth)
- Current annual tax
- $2,110 · $176/mo
- Projected year-2 tax
- $2,110 · $176/mo
- Expected delta
- $0/yr ($0/mo · 0.0%)
ⓘ Screening estimate from a state-policy table — verify with the county assessor before closing.
Climate risk First Street
- Flood 1/10 Low FEMA zone X (unshaded) · 0% chance over 30 yrs
- Wildfire 1/10 Low
- Heat 3/10 Moderate 7 d/yr ≥97°F today · 14 d/yr by 30 yrs out
- Wind 2/10 Low
- Air quality 4/10 Moderate 4 unhealthy d/yr today · 6 by 30 yrs out
Nearby sold comps map
Loading sold comps map…
Walkable amenities ~0.75 mi
Loading nearby amenities…
Taxation est. · year 1
- Rental income
- $16,624
- − Mortgage interest
- −$6,890
- − Property taxes
- −$2,110
- − Insurance
- −$615
- − Repairs & maintenance
- −$1,330
- − Management
- −$1,330
- − Depreciation
- −$3,578
- Taxable income
- $771
- Est. tax owed @ 24.0%
- −$185
- After-tax cash flow
- $2,482/yr
For passive investors: Depreciation is non-cash, so a rental often shows a tax loss while cash-flowing — sheltering income. Rental losses are passive: they offset passive income freely, and up to $25,000/yr can offset ordinary (W-2) income if you actively participate and your MAGI is under $100k (phasing out to $0 by $150k); unused losses carry forward. On sale, claimed depreciation is recaptured at up to 25%, and gains may owe capital-gains tax (a 1031 exchange can defer both). Figures are a year-1 estimate at your 24.0% rate — not tax advice; consult a CPA.
Schools (NCES district)
- District
- Detroit Public Schools Community District
- NCES district ID
- 2601103
- Math proficiency
- 10% ▼ -2.00%
- Reading proficiency
- 24% ▲ 6.00%
- Median HH income
- $25,815
- Composite
- 13.06/100
- National rank
- #9564
- State rank
- #499 of 540 in MI
Livability — Detroit
- Score
- 73/100
- State rank
- #218
- US rank
- #5427
Category grades
Schools grade is shown separately in the Schools card above.
Census & demographics
- Census place
- Detroit, MI
- County
- Wayne County · 1,562,939 people
- City population
- 572,865
- Metro
- Detroit-Warren-Dearborn, MI
- Population (ZIP)
- 41,392
- Household income
- $57,878
- Rent vs Own
- Severe rent burden
- 1646.0
Population outlook (Wayne County) Hauer SSP2
- Today (2025)
- 1,675,273 people
- By 2030
- 1,620,300 · -3.3%
- By 2040
- 1,502,341 · -10.3%
- By 2050
- 1,384,039 · -17.4%
- By 2075
- 1,124,592 · -32.9%
- By 2100
- 881,193 · -47.4%
Race, ethnicity, and origin ACS 2023
- Neighborhood character
- Predominantly Black (85%)
- Race & ethnicity
- Black 85% White 8% Two or more races 4% Asian 1%
- Common ancestry
- Romanian 1% Lithuanian 1%
- Foreign-born
- 2% · Canada
- Languages at home
- 97% English-only · Spanish 1% Other Indo-European 1%
Political lean MEDSL · Wayne
- 2024 margin
- Strong D (+29.0) · D 62.7% · R 33.7% · Other 3.6%
- 2008→2024 swing
- -20.5pp toward R · 2008: 49.5pp · 2024: 29.0pp
- All cycles
- 2024: D+29.0 2020: D+38.1 2016: D+37.3 2012: D+46.9 2008: D+49.5
Not yet ingested
- Civics
- —
Market trends
- HPI YoY
- ▼ -433.14%
- Current HPI
- 280.5434
- Rent YoY
- ▲ 3.44%
- Metro
- Detroit-Warren-Dearborn, MI
- State GDP YoY
- ▲ 1.37%
- F500 in state
- 28
Industry mix (Fortune 500 HQ in MI)
| Industry | F500 HQs | Revenue |
|---|---|---|
| Automotive Parts | 3 | $48B |
|
||
| Automotive | 2 | $372B |
|
||
| Chemicals | 1 | $45B |
|
||
| Automotive Retail | 1 | $29B |
|
||
| Healthcare / Medical Devices | 1 | $23B |
|
||
| Automotive Technology | 1 | $20B |
|
||
Price history
+61.2% since first listed19 events — show timeline
- 2026-05-04 Price Changed $124,000 MiRealSource-MiMLS
- 2026-05-04 Price Changed $124,000 REALCOMP
- 2026-02-23 Listed $125,000 REALCOMP
- 2026-02-23 Listed $125,000 MiRealSource-MiMLS
- 2026-02-12 Listing Removed — MiRealSource-MiMLS
- 2025-09-10 Relisted — MiRealSource-MiMLS
- 2025-09-10 Relisted — REALCOMP
- 2025-08-18 Price Changed $125,000 REALCOMP
- 2025-08-18 Listing Removed — REALCOMP
- 2025-08-18 Price Changed $125,000 MiRealSource-MiMLS
- 2025-08-18 Listing Removed — MiRealSource-MiMLS
- 2025-08-11 Listed $69,999 REALCOMP
- 2025-08-11 Listed $69,999 MiRealSource-MiMLS
- 2022-12-09 Sold (Public Records) $65,000 Public Records
- 2022-07-28 Listing Removed — REALCOMP
- 2022-07-27 Listing Removed — MiRealSource-MiMLS
- 2022-06-19 Listed $69,000 MiRealSource-MiMLS
- 2022-06-19 Listed $69,000 REALCOMP
- 2019-10-30 Sold (Public Records) $76,900 Public Records
Property tax history
+2.5%/yrLatest (2025): $2,110 · -54.3% YoY. Source: county tax records.
Cash-flow waterfall
monthlySold comps — $/sqft
last 12 mo · ≤1 miLoading sold comps…