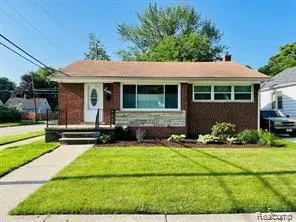
1040 E Maxlow Ave · Hazel Park, MI
Flood risk 1/10 · Minimal
- FEMA flood zone
- X (unshaded)
- Chance of flooding over 30 yrs
- 0.0%
- Est. flood insurance / yr
- $473 – $860
Fire risk 1/10 · Minimal
- Est. fire insurance / yr
- $784 – $1,456
Heat risk 3/10 · Minor
- Hot days now (above 97°F)
- 7 days/yr
- Hot days in 30 yrs
- 15 days/yr
Wind risk 2/10 · Minimal
- Chance of severe wind over 30 yrs
- —
Air-quality risk 3/10 · Minor
- Unhealthy air days now
- 3 days/yr
- Unhealthy air days in 30 yrs
- 5 days/yr
Risk factors via First Street. Map © Google.
Why this score? — see what drove the D grade
The composite is a weighted blend of 9 inputs, each scored 0–100. Each bar is that input's sub-score; the figure is the points it added to the 100-point composite (weight × sub-score).
- Cash flow +15.2/30.0
- ARV discount +5.9/15.0
- DSCR +4.7/10.0
- Livability +4.0/5.0
- 1% rule +3.8/10.0
- Rent growth +3.2/5.0
- Condition / age +2.5/5.0
- Schools +1.4/10.0
- Appreciation +0.0/10.0
$225,000
🖨 Deal sheet (PDF) 📄 Offer letter ✓ Due diligence
Listing remarks MLS
Updated, clean with new paint and hardwood floors throughout. 3 bedroom, 1 bath ranch home w/ central air. Kitchen includes newer black appliances with ice maker and dishwasher and updated bathroom. Large 2.5 car garage with opener and a full bright basement with washer and dryer. The home is located between 8 and 9 mile with access to I75 and 696 freeways, easy access.
Key facts
- Dishwasher
- New paint
- Ice maker
Tags
Property features AI
Finance
- Other: Pets allowed — contact for details
Exterior
- Parking: Detached garage with garage door opener; Garage faces side; Approximately 2.5 garage spaces
- Utilities: Public water; Public sewer
- Home design: Single family residence; One story; Ground-level entry with steps; Brick exterior; Faces not specified
- Construction: Built with brick construction; Block foundation; Asphalt roof; Full unfinished basement
- Exterior features: Porch; Corner lot; Paved road access
Interior
- Kitchen: Dishwasher; Free-standing gas range; Free-standing refrigerator; Microwave
- Bedrooms: Total of 6 rooms (bedrooms included)
- Bathrooms: 1 full bathroom
- Heating & cooling: Forced air heating (natural gas); Central air conditioning; Ceiling fan(s)
- Interior features: Gas water heater; Disposal; Sump pump; Awning(s)
- Laundry & utility: Washer; Dryer
Neighborhood map
What this means for you Summary
Snapshot
- This is a 4-bed/2.0-bath single-family listed at $225k.
Deal economics
- At list price, monthly cash flow is $78 ($942/yr) — positive.
- The deal already cash-flows at list — no discount required.
- To meet the 1% rule (rent ≥ 1% of price), the offer needs to be $198k (11.9% below list).
- Recommended offer: $198k (11.9% below list) — sets the bar for 1% rule.
Location & tenants
- Location reads 81/100 on livability (#65 in MI, #1,385 nationally) — a professional / high-income tenant draw. Strengths: commute A+, cost of living A+, housing A+; Watch: employment D+.
- Hazel Park School District (suburban): math 10% / reading 24% proficiency, ranked #490 of 540 in MI (top 91%) — low school quality limits family demand, transient renter base, plan for 1-2y turnover; 70% free/reduced lunch — lower-income household profile, screen leases tightly.
- Zoned schools: United Oaks Elementary School (math 12% / reading 17%, grade F, #1,185 of 1,397 statewide, top 86%, 350 students, 86% FRL); Hazel Park Junior High School (math 11% / reading 30%, grade F, #418 of 493 statewide, top 85%, 430 students, 78% FRL); Hazel Park High School (math 12% / reading 27%, grade F, #622 of 713 statewide, top 88%, 587 students, 73% FRL).
- Market conditions: Rents rising (+2.9%/yr); 141 active listings in the ZIP; 10 comparable units currently listed for rent nearby; rentals at typical pace (median 19d on market — plan ~3-4 weeks tenant-placement turnaround); 2,614 units permitted in Oakland County in 2024 (721 in 5+ unit buildings).
- This rent runs 35% of the median local income ($67k/yr) — at the standard rent-burdened threshold; future hikes will face affordability resistance.
Forward outlook
- Local home prices are declining (-3.0%/yr); year-one equity from $2k of loan paydown is wiped out by about $7k of value loss. Plan a longer hold.
- Oakland County population projected at +10% by 2050 — modest demand growth; plan on rents tracking national, not racing it.
Negotiation context
- Only 9 days on market — expect competitive offers; lowballing is unlikely to land.
- 9 sale attempts since 19y ago; this cycle's ask is 13135% above the opening price — seller raised mid-cycle; expect resistance to lowballs.
- Current owner paid $5k; list at $225k implies a 4400% gain — meaningful room to come down on a strong offer.
Risks & watch-outs
- Watch-outs: built in 1956 — expect roof / HVAC / electrical / plumbing capex.
Questions for the listing agent
- Built in 1956 — when were the roof, HVAC, electrical panel, plumbing, and water heater last replaced?
- Is there a deadline driving the sale (1031 exchange, divorce, estate, relocation)? That informs how much negotiation room exists.
- Schools are D-rated, which usually means shorter tenancies and higher turnover. Who's the typical renter profile here, and what's been the actual vacancy rate?
- The area grade is low — what's the realistic commute time and amenity access for the typical tenant pool here? Any planned neighborhood developments (good or bad) we should know about?
- What's the average days-on-market for RENTAL listings here right now (not sales)? A rising rental-DOM trend means longer vacancies and softer asking-rent achievability than the comps imply.
- What's the recent tenant-quality profile in this submarket — average credit score on applications, eviction rate, late-payment / NSF rate, and stable-employment percentage? A property-management company in the area should have these aggregated.
- How much new for-sale + rental construction is in the pipeline within 1–3 miles? Heavy new supply typically softens prices + rents 12–24 months out; constrained supply supports both.
Investment metrics
- 1% rule
- 0.88% ✗
- Cap rate
- 6.71%
- Cash-on-cash
- 1.49%
- DSCR
- 1.07
- GRM
- 9.5
CMA / ARV
- ARV (on-the-fly)
- $217,413
- Comps found
- 12
Show comp detail 12 sales within ~0.75 mi
| Address | Dist | Beds/Ba | Sqft | Sold | Price | $/sf | Match |
|---|---|---|---|---|---|---|---|
| 828 E Elza Ave | 0.14mi | 3/2.0 (-1) | 1,798 (-2%) | 0mo | $225,000 | $125 | 86 |
| 1451 E Pearl Ave | 0.44mi | 3/2.0 (-1) | 1,787 (-2%) | 4mo | $185,299 | $104 | 68 |
| 1429 E Milton Ave | 0.23mi | 3/1.0 (-1) | 1,975 (+8%) | 3mo | $190,000 | $96 | 64 |
| 1755 E George Ave | 0.49mi | 3/2.5 (-1) | 1,935 (+6%) | 1mo | $290,000 | $150 | 59 |
| 1705 E Meyers Ave | 0.42mi | 3/2.5 (-1) | 2,000 (+10%) | 1mo | $367,000 | $184 | 57 |
| 1844 E Jarvis Ave | 0.57mi | 3/2.5 (-1) | 1,723 (-6%) | 0mo | $310,000 | $180 | 56 |
| 1028 E Pearl Ave | 0.37mi | 3/1.0 (-1) | 1,679 (-8%) | 7mo | $180,000 | $107 | 54 |
| 1629 E Elza Ave | 0.34mi | 5/1.0 (+1) | 2,062 (+13%) | 1mo | $245,000 | $119 | 53 |
| 1021 E Granet Ave | 0.24mi | 3/3.0 (-1) | 2,098 (+15%) | 3mo | $239,000 | $114 | 52 |
| 115 W Elza Ave | 0.61mi | 3/1.0 (-1) | 1,927 (+6%) | 2mo | $184,000 | $95 | 52 |
| 507 E Muir Ave | 0.42mi | 3/2.5 (-1) | 2,057 (+13%) | 0mo | $318,000 | $155 | 52 |
| 2000 Pearl Ave | 0.70mi | 4/2.5 | 1,990 (+9%) | 4mo | $200,900 | $101 | 47 |
Match score weights: distance 35% · size 25% · config 20% · recency 20%. Top-matched comps best support the ARV.
Projected returns pro-forma
-3.0% appreciation · 2.9% rent growth · sell at horizon
- IRR
- -14.0%
- Equity multiple
- 0.50×
- Total profit
- $-31,672
- Equity at exit
- $33,548
- IRR
- -5.4%
- Equity multiple
- 0.65×
- Total profit
- $-22,007
- Equity at exit
- $19,454
Cash invested: $63,000 (down + closing). Projections, not guarantees.
Landlord ↔ Tenant lean methodology
- Overall (STATE)
- 62 Landlord-Friendly
- State Michigan
- 62 Landlord-Friendly · EVEN
- County
- — inherits STATE
- City
- — inherits STATE
ZIP-level market 48030
- Rents YoY
- 2.9%
- Active inventory
- 141
- Price-to-rent
- 9.5×
Monthly cashflow live
- Estimated rent
- $1,981 high interval (Pro) →
- Mortgage (P&I)
- −$1,180
- Tax from tax record
- −$213 /mo · $2,559/yr
- Insurance
- −$94
- HOA
- −$0
- Vacancy / Maint / Mgmt
- −$416
- Net cashflow
- $78
Break-even live
Sensitivity live
| Price | -10% $206 | -5% $142 | +0% $78 | +5% $15 | +10% $-49 |
|---|---|---|---|---|---|
| Rent | -10% $-78 | -5% $0 | +0% $78 | +5% $157 | +10% $235 |
| Rate | -1.0pp $192 | -0.5pp $136 | base $78 | +0.5pp $20 | +1.0pp $-39 |
UW: 25.0% down · 7.5% · 30yr · 1.5% tax · 5.0% vac · 8.0% maint · 8.0% mgmt
Financing live
Cash to close
- Down payment
- $56,250
- Closing costs
- $6,750
- Reserves months
- —
- Total cash needed
- —
Loan-product check · same deal, 3 products live
Conventional
25% down · 7.5% · 30yr
- Down + closing
- —
- Monthly P&I
- —
- Monthly cashflow
- —
- DSCR
- —
- Eligible?
- —
Personal DTI + credit; lowest rate.
DSCR
20% down · 8.5% · 30yr
- Down + closing
- —
- Monthly P&I
- —
- Monthly cashflow
- —
- DSCR
- —
- Eligible?
- —
No personal income docs; deal must DSCR.
Hard money
10% down · 12.0% · 12mo
- Down + closing
- —
- Monthly P&I
- —
- Monthly cashflow
- —
- DSCR
- —
- Eligible?
- —
Short-term bridge; refi at stabilization.
Rent comps 10 comps
| Address | Beds | Baths | Sqft | Rent | $/sqft | DOM | Units | Dist |
|---|---|---|---|---|---|---|---|---|
| 1301 E Muir Ave Hazel Park, MI | 3.0 | 2.0 | 1236 | $1,600 | $1.29 | 23d | 1 | 0.30mi |
| 329 W Muir Ave Hazel Park, MI | 4.0 | 2.0 | 1606 | $2,000 | $1.25 | 12d | 1 | 0.73mi |
| 20008 Hull St Highland Park, MI | 5.0 | 2.0 | 1332 | $1,600 | $1.20 | 18d | 1 | 0.77mi |
| 23304 Cayuga Ave Hazel Park, MI | 4.0 | 2.0 | 1540 | $2,150 | $1.40 | 26d | 1 | 0.84mi |
| 1330 E Chesterfield St Ferndale, MI | 4.0 | 2.0 | 1795 | $2,800 | $1.56 | 0d | 1 | 0.95mi |
| 20015 Lumpkin St Detroit, MI | 4.0 | 3.0 | 2500 | $1,800 | $0.72 | 6d | 1 | 0.96mi |
| 23400 Reynolds Ave Hazel Park, MI | 3.0 | 1.0 | 1305 | $1,900 | $1.46 | 7d | 1 | 0.97mi |
| 19995 Goddard St Detroit, MI | 4.0 | 1.0 | 1292 | $1,400 | $1.08 | 23d | 1 | 1.09mi |
| 2420 Woodward Hts Ferndale, MI | 3.0 | 1.0 | 1316 | $2,200 | $1.67 | 26d | 1 | 1.46mi |
| 959 E Shevlin Ave Hazel Park, MI | 3.0 | 1.0 | 1419 | $1,750 | $1.23 | 16d | 1 | 1.48mi |
Listing history 6 events
-
2026-06-07days on market $225,000 Active 9 DOM
-
2026-06-04days on market $225,000 Active 6 DOM
-
2026-06-03days on market $225,000 Active 5 DOM
-
2026-06-02days on market $225,000 Active 4 DOM
-
2026-06-01days on market $225,000 Active 3 DOM
-
2026-05-31days on market $225,000 Active 2 DOM
ⓘ Source: listings_history table (triggers on properties + properties_extension) + one-shot
backfill from property_details.listing_events for pre-trigger history.
Tax reassessment forecast MI · Partial reset (capped growth)
- Current annual tax
- $2,559 · $213/mo
- Projected year-2 tax
- $3,012 · $251/mo
- Expected delta
- +$453/yr (+$38/mo · 17.7%)
ⓘ Screening estimate from a state-policy table — verify with the county assessor before closing.
Climate risk First Street
- Flood 1/10 Low FEMA zone X (unshaded) · 0% chance over 30 yrs
- Wildfire 1/10 Low
- Heat 3/10 Moderate 7 d/yr ≥97°F today · 15 d/yr by 30 yrs out
- Wind 2/10 Low
- Air quality 3/10 Moderate 3 unhealthy d/yr today · 5 by 30 yrs out
Nearby sold comps map
Loading sold comps map…
Walkable amenities ~0.75 mi
Loading nearby amenities…
Taxation est. · year 1
- Rental income
- $23,778
- − Mortgage interest
- −$12,603
- − Property taxes
- −$2,559
- − Insurance
- −$1,125
- − Repairs & maintenance
- −$1,902
- − Management
- −$1,902
- − Depreciation
- −$6,545
- Taxable loss
- −$2,859
- Est. tax savings @ 24.0%
- +$686
- After-tax cash flow
- $1,628/yr
For passive investors: Depreciation is non-cash, so a rental often shows a tax loss while cash-flowing — sheltering income. Rental losses are passive: they offset passive income freely, and up to $25,000/yr can offset ordinary (W-2) income if you actively participate and your MAGI is under $100k (phasing out to $0 by $150k); unused losses carry forward. On sale, claimed depreciation is recaptured at up to 25%, and gains may owe capital-gains tax (a 1031 exchange can defer both). Figures are a year-1 estimate at your 24.0% rate — not tax advice; consult a CPA.
Schools (NCES district)
- District
- Hazel Park School District
- NCES district ID
- 2618030
- Math proficiency
- 10% ▼ -2.00%
- Reading proficiency
- 24% ▲ 1.00%
- Median HH income
- $36,181
- Composite
- 14.05/100
- National rank
- #9466
- State rank
- #490 of 540 in MI
Livability — Hazel Park
- Score
- 81/100
- State rank
- #65
- US rank
- #1385
Category grades
Schools grade is shown separately in the Schools card above.
Census & demographics
- Census place
- Hazel Park, MI
- County
- Oakland County · 1,009,092 people
- City population
- 14,963
- Metro
- Detroit-Warren-Dearborn, MI
- Population (ZIP)
- 14,963
- Household income
- $67,073
- Rent vs Own
- Severe rent burden
- 432.0
Population outlook (Oakland County) Hauer SSP2
- Today (2025)
- 1,335,747 people
- By 2030
- 1,375,100 · +2.9%
- By 2040
- 1,435,385 · +7.5%
- By 2050
- 1,469,250 · +10.0%
- By 2075
- 1,531,946 · +14.7%
- By 2100
- 1,450,485 · +8.6%
Race, ethnicity, and origin ACS 2023
- Neighborhood character
- Predominantly White (74%)
- Race & ethnicity
- White 74% Two or more races 10% Black 10% Hispanic / Latino 6% Asian 1%
- Hispanic origin (detail)
- Mexican 3% Puerto Rican 2%
- Common ancestry
- Romanian 11% Slovak 3% Lithuanian 2%
- Foreign-born
- 5% · Canada
- Languages at home
- 92% English-only · Spanish 5% Arabic 1% Russian/Polish/Slavic 1%
Political lean MEDSL · Oakland
- 2024 margin
- D (+10.6) · D 54.4% · R 43.8% · Other 1.9%
- 2008→2024 swing
- -3.9pp toward R · 2008: 14.5pp · 2024: 10.6pp
- All cycles
- 2024: D+10.6 2020: D+14.1 2016: D+8.1 2012: D+8.1 2008: D+14.5
Not yet ingested
- Civics
- —
Market trends
- HPI YoY
- ▼ -184.32%
- Current HPI
- 285.5923
- Rent YoY
- ▲ 2.90%
- Metro
- Detroit-Warren-Dearborn, MI
- State GDP YoY
- ▲ 1.37%
- F500 in state
- 28
Industry mix (Fortune 500 HQ in MI)
| Industry | F500 HQs | Revenue |
|---|---|---|
| Automotive Parts | 3 | $48B |
|
||
| Automotive | 2 | $372B |
|
||
| Chemicals | 1 | $45B |
|
||
| Automotive Retail | 1 | $29B |
|
||
| Healthcare / Medical Devices | 1 | $23B |
|
||
| Automotive Technology | 1 | $20B |
|
||
Price history
-90.7% since first listed23 events — show timeline
- 2026-05-30 Listed for Rent $1,700 REALSOURCE
- 2026-05-29 Listed $225,000 REALCOMP
- 2026-05-29 Listed $225,000 MiRealSource-MiMLS
- 2026-05-01 Rental Removed $1,650 REALCOMP
- 2026-04-29 Price Changed $1,650 REALCOMP
- 2026-03-14 Listed for Rent $1,700 REALCOMP
- 2009-06-19 Sold (MLS) $5,000 REALCOMP
- 2009-03-11 Listing Removed — REALCOMP
- 2009-03-11 Listed $17,000 REALCOMP
- 2008-12-11 Listed $18,000 REALCOMP
- 2008-10-15 Listing Removed — REALCOMP
- 2008-09-11 Listed $26,000 REALCOMP
- 2008-08-18 Listing Removed — REALCOMP
- 2007-12-31 Listing Removed — MiRealSource-MiMLS
- 2007-04-12 Listed $109,900 MiRealSource-MiMLS
- 2007-04-12 Listed $109,900 REALCOMP
- 2004-06-03 Sold (Public Records) $108,000 Public Records
- 2003-04-22 Sold (Public Records) $100,000 Public Records
- 1999-07-30 Sold (Public Records) $80,000 Public Records
- 1997-09-24 Sold (Public Records) $35,000 Public Records
- 1982-11-01 Sold (Public Records) $35,000 Public Records
- 1977-02-01 Sold (Public Records) $25,900 Public Records
- 1973-05-01 Sold (Public Records) $18,250 Public Records
Property tax history
+2.5%/yrLatest (2025): $2,559 · +2.1% YoY. Source: county tax records.
Cash-flow waterfall
monthlySold comps — $/sqft
last 12 mo · ≤1 miLoading sold comps…