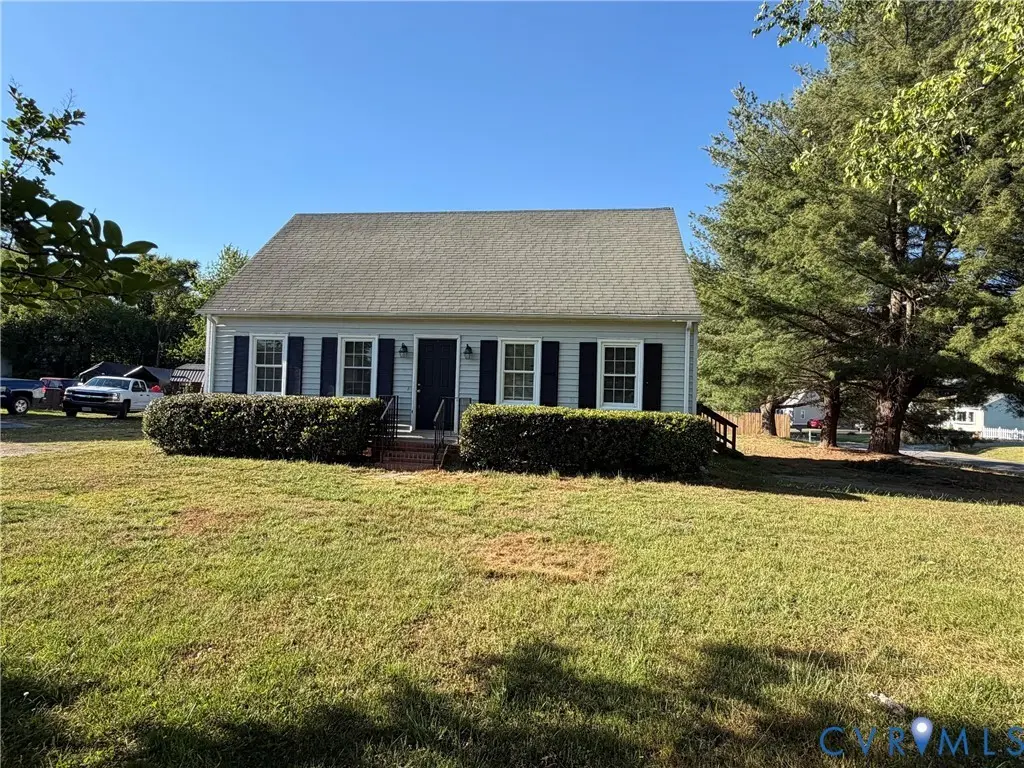
6520 Tammy Ln · Mechanicsville, VA
Flood risk 1/10 · Minimal
- FEMA flood zone
- X (unshaded)
- Chance of flooding over 30 yrs
- 0.0%
- Est. flood insurance / yr
- $507 – $1,088
Fire risk 1/10 · Minimal
- Est. fire insurance / yr
- $666 – $1,236
Heat risk 8/10 · Major
- Hot days now (above 105°F)
- 7 days/yr
- Hot days in 30 yrs
- 16 days/yr
Wind risk 6/10 · Moderate
- Chance of severe wind over 30 yrs
- 27.0%
Air-quality risk 2/10 · Minimal
- Unhealthy air days now
- 1 days/yr
- Unhealthy air days in 30 yrs
- 2 days/yr
Risk factors via First Street. Map © Google.
Why this score? — see what drove the D+ grade
The composite is a weighted blend of 9 inputs, each scored 0–100. Each bar is that input's sub-score; the figure is the points it added to the 100-point composite (weight × sub-score).
- ARV discount +13.3/15.0
- Cash flow +13.1/30.0
- Schools +7.0/10.0
- DSCR +3.9/10.0
- Livability +3.7/5.0
- 1% rule +3.0/10.0
- Rent growth +2.5/5.0
- Condition / age +2.5/5.0
- Appreciation +0.0/10.0
$299,000
🖨 Deal sheet 📄 Offer letter ✓ Due diligence
Listing remarks MLS
Beautiful 4 bedroom 2 bath Cape located in High Point Farms.
Key facts
- Large yard
- Cape style home
- Vinyl siding
Tags
Property features AI
Exterior
- Utilities: Public water; Public sewer
- Home design: Single-story (1 story); Frame construction with vinyl siding; Above-grade finished area approximately 1,296
- Construction: Built (year type listed as Actual)
- Exterior features: R2 zoning
Interior
- Bathrooms: Two full bathrooms (one on first level, one on second level) with tub and shower in each
- Heating & cooling: Electric heat pump; Central electric air conditioning
- Interior features: Resale condition; 6 total rooms
Neighborhood map
What this means for you Summary
Snapshot
- This is a 4-bed/2.0-bath single-family listed at $299k.
Deal economics
- At list price, monthly cash flow is $-9 ($-110/yr) — negative.
- To cash-flow at today's rent, offer at most $297k (0.5% below list).
- To meet the 1% rule (rent ≥ 1% of price), the offer needs to be $238k (20.3% below list).
- Recommended offer: $238k (20.3% below list) — sets the bar for 1% rule.
- Cap rate 6.3% vs local median 3.1% in Mechanicsville — top-decile yield for the area; either an underpriced asset or a hidden risk that comps aren't pricing in. Stress-test before assuming the spread holds.
Location & tenants
- Location reads 73/100 on livability (#165 in VA) — a middle-class / working-renter tenant base. Strengths: schools A+, employment A+, housing A+; Watch: amenities F, commute F.
- Hanover County Public School District (suburban): math 79% / reading 81% proficiency, ranked #5 of 131 in VA (top 4%) — strong family-tenant draw, lease renewals of 3-5y typical; only 15% free/reduced lunch — higher-income household profile.
- Market conditions: 214 active listings in the ZIP; 1 comparable units currently listed for rent nearby; solid renter incomes; 447 units permitted in Hanover County in 2024 (0 in 5+ unit buildings).
Forward outlook
- Local home prices are declining (-3.0%/yr); year-one equity from $2k of loan paydown is wiped out by about $9k of value loss. Plan a longer hold.
- Hanover County population projected at +11% by 2050 — modest demand growth; plan on rents tracking national, not racing it.
Negotiation context
- It's been on market 22 days — a 2% lower offer ($295k) is reasonable based on typical stale-listing flexibility.
- 7 sale attempts since 22y ago with the ask held roughly flat each time — persistent listings suggest the price (not the market) is what's stuck; bring a comps-based counter.
- Current owner paid $205k; 46% above their basis — modest negotiation headroom, anchor on the comps not their cost.
Risks & watch-outs
- Climate carrying-cost: major wind risk, 27% chance of damaging wind over 30y; extreme-heat days projected 7→16/yr by 2055 (HVAC capex compounding) — expect insurance premiums to compound above CPI over the hold.
Questions for the listing agent
- What do current leases actually rent for vs. the listed asking? Can we see a recent rent roll and the last 12 months of T-12 income?
- Is there a deadline driving the sale (1031 exchange, divorce, estate, relocation)? That informs how much negotiation room exists.
- Schools are A-rated — typically a magnet for longer-tenancy family renters. What's the average tenant stay here, and is there a school-zone premium baked into asking?
- The area grade is low — what's the realistic commute time and amenity access for the typical tenant pool here? Any planned neighborhood developments (good or bad) we should know about?
- What's the average days-on-market for RENTAL listings here right now (not sales)? A rising rental-DOM trend means longer vacancies and softer asking-rent achievability than the comps imply.
- What's the recent tenant-quality profile in this submarket — average credit score on applications, eviction rate, late-payment / NSF rate, and stable-employment percentage? A property-management company in the area should have these aggregated.
- How much new for-sale + rental construction is in the pipeline within 1–3 miles? Heavy new supply typically softens prices + rents 12–24 months out; constrained supply supports both.
Investment metrics
- 1% rule
- 0.80% ✗
- Cap rate
- 6.26%
- Cash-on-cash
- -0.13%
- DSCR
- 0.99
- GRM
- 10.5
CMA / ARV
- ARV (median comp)
- $342,818
- List price
- $299,000
- Delta
- -12.78%
- Verdict
- UNDERPRICED
- Comps
- 20 within 1.0 mi
Show comp detail 12 sales within ~0.75 mi
| Address | Dist | Beds/Ba | Sqft | Sold | Price | $/sf | Match |
|---|---|---|---|---|---|---|---|
| 7059 Poteet Ln | 0.46mi | 3/2.0 (-1) | 1,428 (+1%) | 2mo | $375,000 | $263 | 70 |
| 7077 Adaline Ln | 0.23mi | 4/2.0 | 1,512 (+7%) | 9mo | $350,000 | $231 | 70 |
| 6423 Chenault Way | 0.23mi | 3/2.0 (-1) | 1,319 (-6%) | 7mo | $350,000 | $265 | 67 |
| 6402 Sledds Lake Rd | 0.35mi | 4/2.0 | 1,320 (-6%) | 9mo | $325,000 | $246 | 65 |
| 6405 Selby Ln | 0.22mi | 4/2.0 | 1,296 (-8%) | 13mo | $375,000 | $289 | 65 |
| 6467 Luther Bosher Ln | 0.37mi | 4/2.0 | 1,512 (+7%) | 10mo | $360,000 | $238 | 62 |
| 7005 Brooking Way | 0.23mi | 3/2.0 (-1) | 1,512 (+7%) | 13mo | $375,000 | $248 | 61 |
| 7097 Bonniefield Dr | 0.58mi | 3/2.0 (-1) | 1,456 (+3%) | 5mo | $402,500 | $276 | 58 |
| 6466 Birch Tree Trce | 0.42mi | 3/2.0 (-1) | 1,300 (-8%) | 8mo | $340,000 | $262 | 56 |
| 7107 Brooking Way | 0.49mi | 3/2.0 (-1) | 1,300 (-8%) | 8mo | $350,000 | $269 | 52 |
| 6327 Draperfield Rd | 0.55mi | 3/2.0 (-1) | 1,200 (-15%) | 9mo | $340,000 | $283 | 37 |
| 6318 Sledds Lake Rd | 0.61mi | 3/1.5 (-1) | 1,216 (-14%) | 6mo | $366,500 | $301 | 36 |
Match score weights: distance 35% · size 25% · config 20% · recency 20%. Top-matched comps best support the ARV.
Projected returns pro-forma
-3.0% appreciation · 3.0% rent growth · sell at horizon
- IRR
- -16.6%
- Equity multiple
- 0.41×
- Total profit
- $-49,106
- Equity at exit
- $44,582
- IRR
- -8.4%
- Equity multiple
- 0.48×
- Total profit
- $-43,801
- Equity at exit
- $25,852
Cash invested: $83,720 (down + closing). Projections, not guarantees.
Landlord ↔ Tenant lean methodology
- Overall (STATE)
- 55 Moderately Landlord-Leaning
- State Virginia
- 55 Moderately Landlord-Leaning · D+2
- County
- — inherits STATE
- City
- — inherits STATE
ZIP-level market 23111
- Home prices YoY
- -14.0%
- Active inventory
- 214
- Price-to-rent
- 10.5×
Monthly cashflow live
- Estimated rent
- $2,384 medium interval (Pro) →
- Mortgage (P&I)
- −$1,568
- Tax from tax record
- −$200 /mo · $2,400/yr
- Insurance
- −$125
- HOA
- −$0
- Vacancy / Maint / Mgmt
- −$501
- Net cashflow
- $-9
Break-even live
UW: 25.0% down · 7.5% · 30yr · 1.5% tax · 5.0% vac · 8.0% maint · 8.0% mgmt
Financing live
Cash to close
- Down payment
- $74,750
- Closing costs
- $8,970
- Reserves months
- —
- Total cash needed
- —
Loan-product check · same deal, 3 products live
Conventional
25% down · 7.5% · 30yr
- Down + closing
- —
- Monthly P&I
- —
- Monthly cashflow
- —
- DSCR
- —
- Eligible?
- —
Personal DTI + credit; lowest rate.
DSCR
20% down · 8.5% · 30yr
- Down + closing
- —
- Monthly P&I
- —
- Monthly cashflow
- —
- DSCR
- —
- Eligible?
- —
No personal income docs; deal must DSCR.
Hard money
10% down · 12.0% · 12mo
- Down + closing
- —
- Monthly P&I
- —
- Monthly cashflow
- —
- DSCR
- —
- Eligible?
- —
Short-term bridge; refi at stabilization.
Rent comps 1 comps
| Address | Beds | Baths | Sqft | Rent | $/sqft | DOM | Units | Dist |
|---|---|---|---|---|---|---|---|---|
| 7264 Cold Harbor Rd Mechanicsville, VA | 2.0–3.0 | 2.0 | 1160 | $1,799 | $1.55 | 1d | 1 | 1.32mi |
Listing history 20 events
-
2026-06-02status $299,000 Pending 22 DOM
-
2026-06-01days on market $299,000 Active 22 DOM
-
2026-05-31days on market $299,000 Active 21 DOM
-
2026-05-13price $299,000 171-char remark
-
2026-05-08$309,000 Active 171-char remark
-
2007-11-16soldstatus $204,950 60-char remark
Show marketing remark (60 chars)
Beautiful 4 bedroom 2 bath Cape located in High Point Farms.
-
2007-11-16soldstatus $204,950
Show marketing remark (60 chars)
Beautiful 4 bedroom 2 bath Cape located in High Point Farms.
-
2007-10-05$204,950 60-char remark
Show marketing remark (60 chars)
Beautiful 4 bedroom 2 bath Cape located in High Point Farms.
-
2007-10-05$204,950
Show marketing remark (60 chars)
Beautiful 4 bedroom 2 bath Cape located in High Point Farms.
-
2005-08-31soldstatus $188,900
-
2005-08-30soldstatus $188,900
-
2005-08-30soldstatus $188,900
-
2005-04-25$188,900
-
2005-04-25$188,900
-
2004-09-23soldstatus $154,950
-
2004-09-01soldstatus $188,900
-
2004-09-01soldstatus $188,900
-
2004-07-13$154,950
-
2004-07-13$154,950
-
1989-11-01soldstatus $64,000
ⓘ Source: listings_history table (triggers on properties + properties_extension) + one-shot
backfill from property_details.listing_events for pre-trigger history.
Tax reassessment forecast VA · Resets to sale price
- Current annual tax
- $2,400 · $200/mo
- Projected year-2 tax
- $2,452 · $204/mo
- Expected delta
- +$52/yr (+$4/mo · 2.2%)
ⓘ Screening estimate from a state-policy table — verify with the county assessor before closing.
Climate risk First Street
- Flood 1/10 Low FEMA zone X (unshaded) · 0% chance over 30 yrs
- Wildfire 1/10 Low
- Heat 8/10 Severe 7 d/yr ≥105°F today · 16 d/yr by 30 yrs out
- Wind 6/10 Major 27% chance of damaging wind over 30 yrs
- Air quality 2/10 Low 1 unhealthy d/yr today · 2 by 30 yrs out
Nearby sold comps map
Loading sold comps map…
Walkable amenities ~0.75 mi
Loading nearby amenities…
Taxation est. · year 1
- Rental income
- $28,609
- − Mortgage interest
- −$16,749
- − Property taxes
- −$2,400
- − Insurance
- −$1,495
- − Repairs & maintenance
- −$2,289
- − Management
- −$2,289
- − Depreciation
- −$8,698
- Taxable loss
- −$5,311
- Est. tax savings @ 24.0%
- +$1,275
- After-tax cash flow
- $1,164/yr
For passive investors: Depreciation is non-cash, so a rental often shows a tax loss while cash-flowing — sheltering income. Rental losses are passive: they offset passive income freely, and up to $25,000/yr can offset ordinary (W-2) income if you actively participate and your MAGI is under $100k (phasing out to $0 by $150k); unused losses carry forward. On sale, claimed depreciation is recaptured at up to 25%, and gains may owe capital-gains tax (a 1031 exchange can defer both). Figures are a year-1 estimate at your 24.0% rate — not tax advice; consult a CPA.
Schools (NCES district)
- District
- Hanover County Public School District
- NCES district ID
- 5101830
- Math proficiency
- 79% ▼ -11.00%
- Reading proficiency
- 81% ▼ -3.00%
- Median HH income
- $78,386
- Composite
- 70.37/100
- National rank
- #268
- State rank
- #5 of 131 in VA
Livability — Mechanicsville
- Score
- 73/100
- State rank
- #165
- US rank
- #5098
Category grades
Schools grade is shown separately in the Schools card above.
Census & demographics
- Census place
- Mechanicsville, VA
- County
- Hanover County · 134,767 people
- City population
- 72,258
- Metro
- Richmond, VA
- Population (ZIP)
- 38,070
- Household income
- $98,969
- Rent vs Own
- Severe rent burden
- 825.0
Population outlook (Hanover County) Hauer SSP2
- Today (2025)
- 111,687 people
- By 2030
- 115,373 · +3.3%
- By 2040
- 120,828 · +8.2%
- By 2050
- 123,591 · +10.7%
- By 2075
- 132,168 · +18.3%
- By 2100
- 130,105 · +16.5%
Race, ethnicity, and origin ACS 2023
- Neighborhood character
- Predominantly White (83%)
- Race & ethnicity
- White 83% Black 8% Two or more races 6% Hispanic / Latino 2% Asian 1%
- Common ancestry
- Italian 3% Serbian 3% Lithuanian 2%
- Foreign-born
- 4% · Canada
- Languages at home
- 97% English-only · Spanish 1% Other Asian/Pacific 1%
Political lean MEDSL · Hanover
- 2024 margin
- Strong R (+25.8) · D 36.6% · R 62.4% · Other 1.1%
- 2008→2024 swing
- +7.8pp toward D · 2008: -33.6pp · 2024: -25.8pp
- All cycles
- 2024: R+25.8 2020: R+26.8 2016: R+32.5 2012: R+36.7 2008: R+33.6
Not yet ingested
- Civics
- —
Market trends
- HPI YoY
- ▼ -41.34%
- Current HPI
- 253.858
- Rent YoY
- —
- Metro
- Richmond, VA
- State GDP YoY
- ▲ 2.40%
- F500 in state
- 50
Industry mix (Fortune 500 HQ in VA)
| Industry | F500 HQs | Revenue |
|---|---|---|
| Aerospace / Defense | 4 | $236B |
|
||
| Technology / Defense | 3 | $32B |
|
||
| Financial Services | 2 | $176B |
|
||
| Utilities | 2 | $27B |
|
||
| Insurance | 2 | $25B |
|
||
| Technology | 2 | $15B |
|
||
Price history
+367.2% since first listed18 events — show timeline
- 2026-06-01 Pending — CVRMLS
- 2026-05-13 Price Changed $299,000 CVRMLS
- 2026-05-08 Listed $309,000 CVRMLS
- 2007-11-16 Sold (MLS) $204,950 CVRMLS
- 2007-11-16 Sold (MLS) $204,950 CVRMLS
- 2007-10-05 Listed $204,950 CVRMLS
- 2007-10-05 Listed $204,950 CVRMLS
- 2005-08-31 Sold (Public Records) $188,900 Public Records
- 2005-08-30 Sold (MLS) $188,900 CVRMLS
- 2005-08-30 Sold (MLS) $188,900 CVRMLS
- 2005-04-25 Listed $188,900 CVRMLS
- 2005-04-25 Listed $188,900 CVRMLS
- 2004-09-23 Sold (Public Records) $154,950 Public Records
- 2004-09-01 Sold (MLS) $188,900 CVRMLS
- 2004-09-01 Sold (MLS) $188,900 CVRMLS
- 2004-07-13 Listed $154,950 CVRMLS
- 2004-07-13 Listed $154,950 CVRMLS
- 1989-11-01 Sold (Public Records) $64,000 Public Records
Property tax history
+6.0%/yrLatest (2026): $2,400 · +7.1% YoY. Source: county tax records.
Cash-flow waterfall
monthlySold comps — $/sqft
last 12 mo · ≤1 miLoading sold comps…